Supply and Demand: five questions to try now
Real questions, the answer key from the mark scheme, and the explanation that goes with it. No account needed to answer them.
Cross-board concept practice · originally a CIE 9708 question, used here because the concept is the same. It is not AP Economics past-paper material.
Question 1
The diagrams show initial equilibrium positions at Y1P1. Which diagram reflects the impact on an economy of higher unit wage costs and an improvement in the balance of trade?
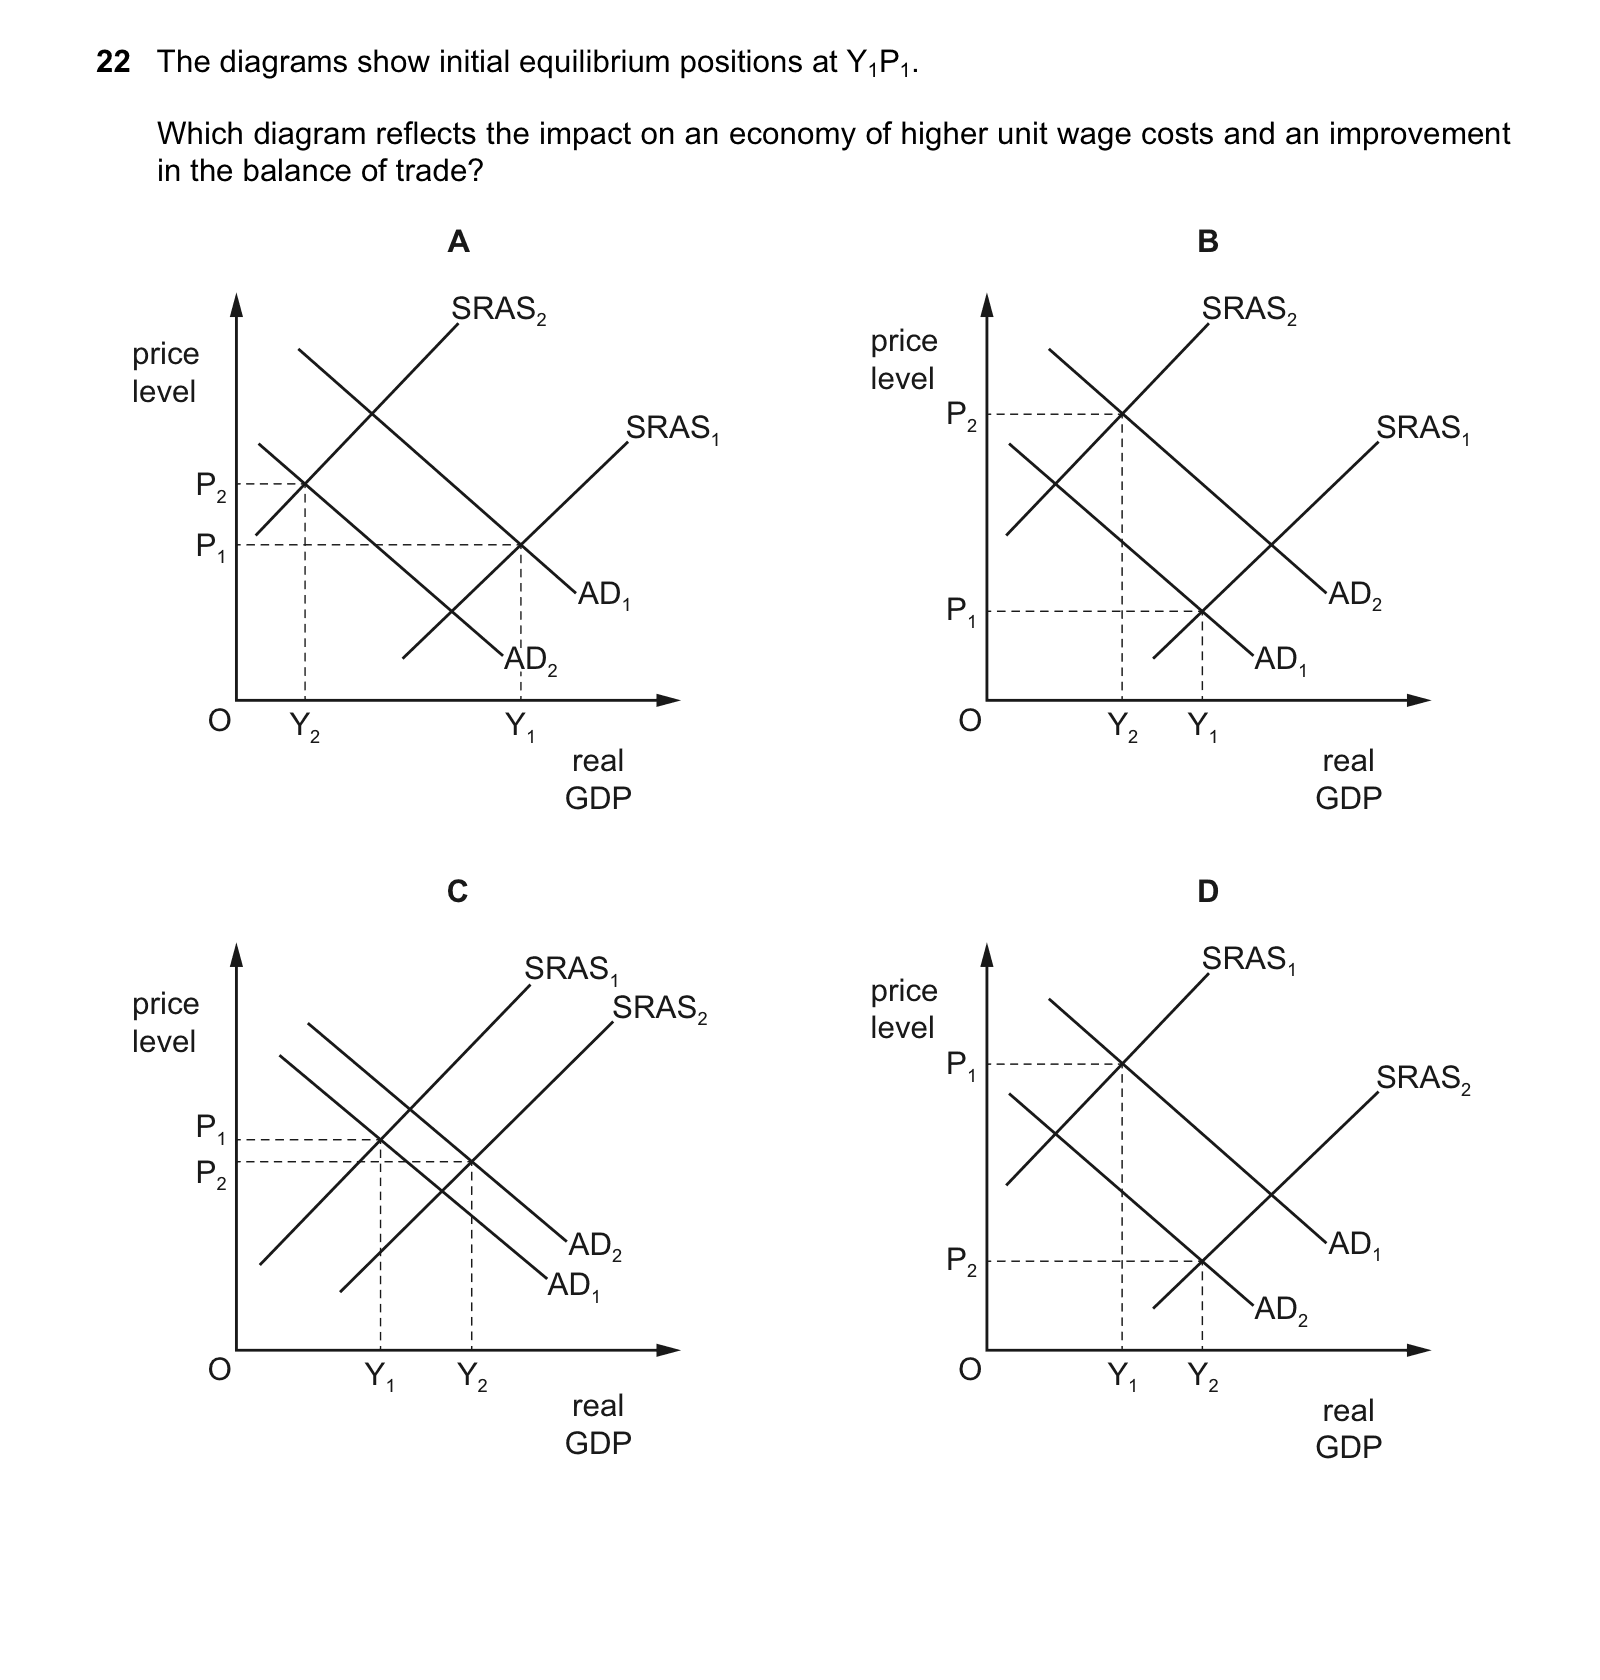
Answer: B.
Explanation:
- An improvement in the balance of trade means that the country is exporting more than it is importing, leading to an increase in net exports and ultimately boosting the aggregate demand (AD) curve.
- Higher unit wage costs would lead to an increase in production costs for firms, shifting the short-run aggregate supply (SRAS) curve to the left as they would need to increase prices to maintain profit margins.
- The combination of an upward shift in the AD curve and a leftward shift in the SRAS curve would lead to an increase in the price level (from P1 to P2) and a decrease in real GDP (from Y1 to Y2), which is depicted in diagram B.
Cross-board concept practice · originally a CIE 9708 question, used here because the concept is the same. It is not AP Economics past-paper material.
Question 2
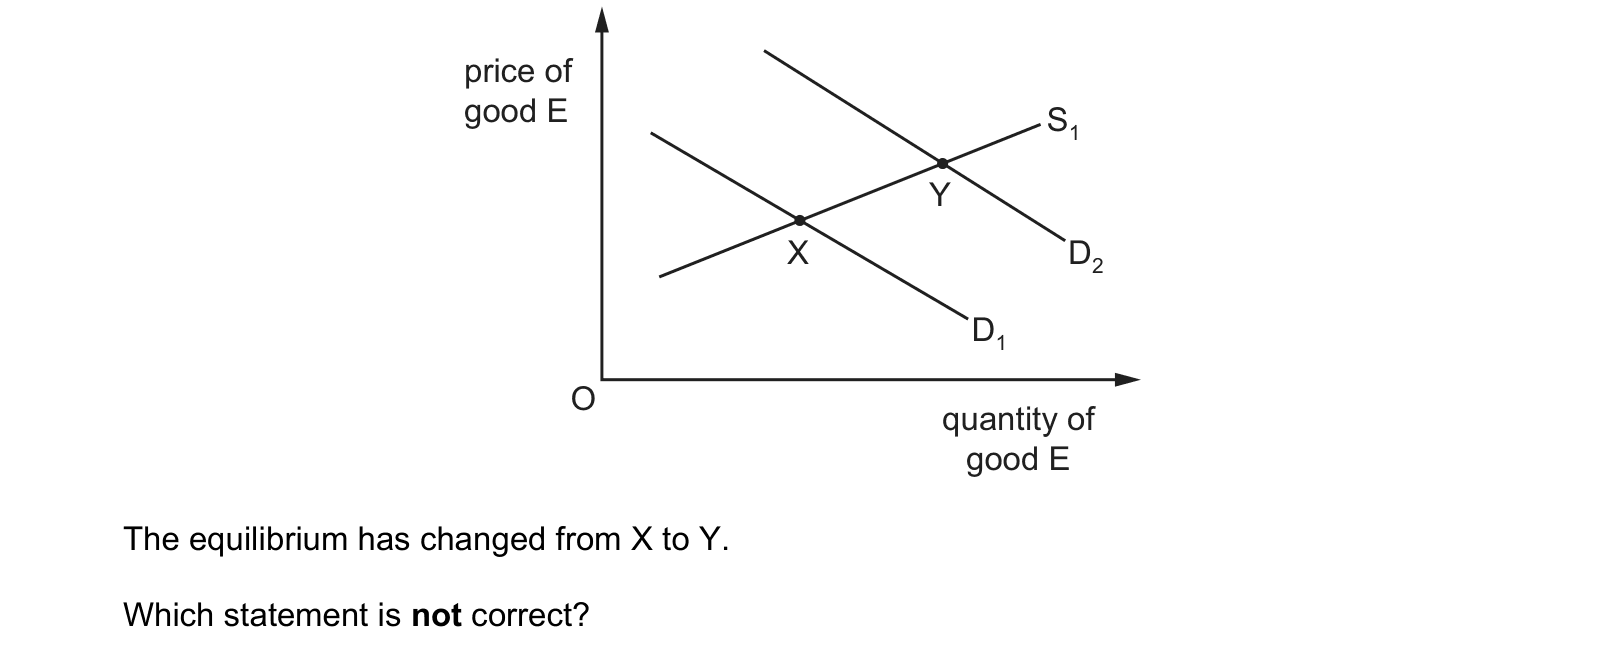
The diagram shows the market demand for and supply of good E. price of good E quantity of good E D1 S1 D2 X Y O The equilibrium has changed from X to Y. Which statement is not correct?
Answer: C.
Explanation:
A - Incomes of consumers may have increased and good E is a normal good:
This statement is correct. If incomes of consumers have increased and good E is a normal good, it implies that consumers are willing and able to buy more of good E at each price. Therefore, an increase in income could lead to an increase in demand for good E, shifting the demand curve to the right from D1 to D2, resulting in a new equilibrium at point Y.
B - The quantity supplied has risen because price has increased:
This statement is correct. As the market moves from point X to Y due to an increase in demand, the price of good E will increase, leading to an increase in the quantity supplied by producers, moving along the supply curve from point O to Y.
C - The quantity supplied has risen because the production of good E has been subsidised:
This statement is not correct. Subsidies affect the cost of production for producers, encouraging an increase in supply, but in this scenario, the increase in quantity supplied is due to an increase in price and not a subsidy. In the given scenario, the increase in quantity supplied is a result of the market equilibrium shifting due to increased demand, leading to a higher price and producers responding to this price signal by supplying more at the new equilibrium quantity Y.
D - The price of good F, which is a substitute for good E, may have risen:
This statement is correct. If the price of a substitute for good E (in this case, good F) rises, consumers may switch their preferences to good E, leading to an increase in demand for good E, shifting the demand curve to the right from D1 to D2, resulting in a new equilibrium at point Y.
Cross-board concept practice · originally a CIE 9708 question, used here because the concept is the same. It is not AP Economics past-paper material.
Question 3
The diagram shows the demand and supply curves of a commodity before and after a specific tax is removed. What is the tax per unit of output and what is the price after the removal of the tax?
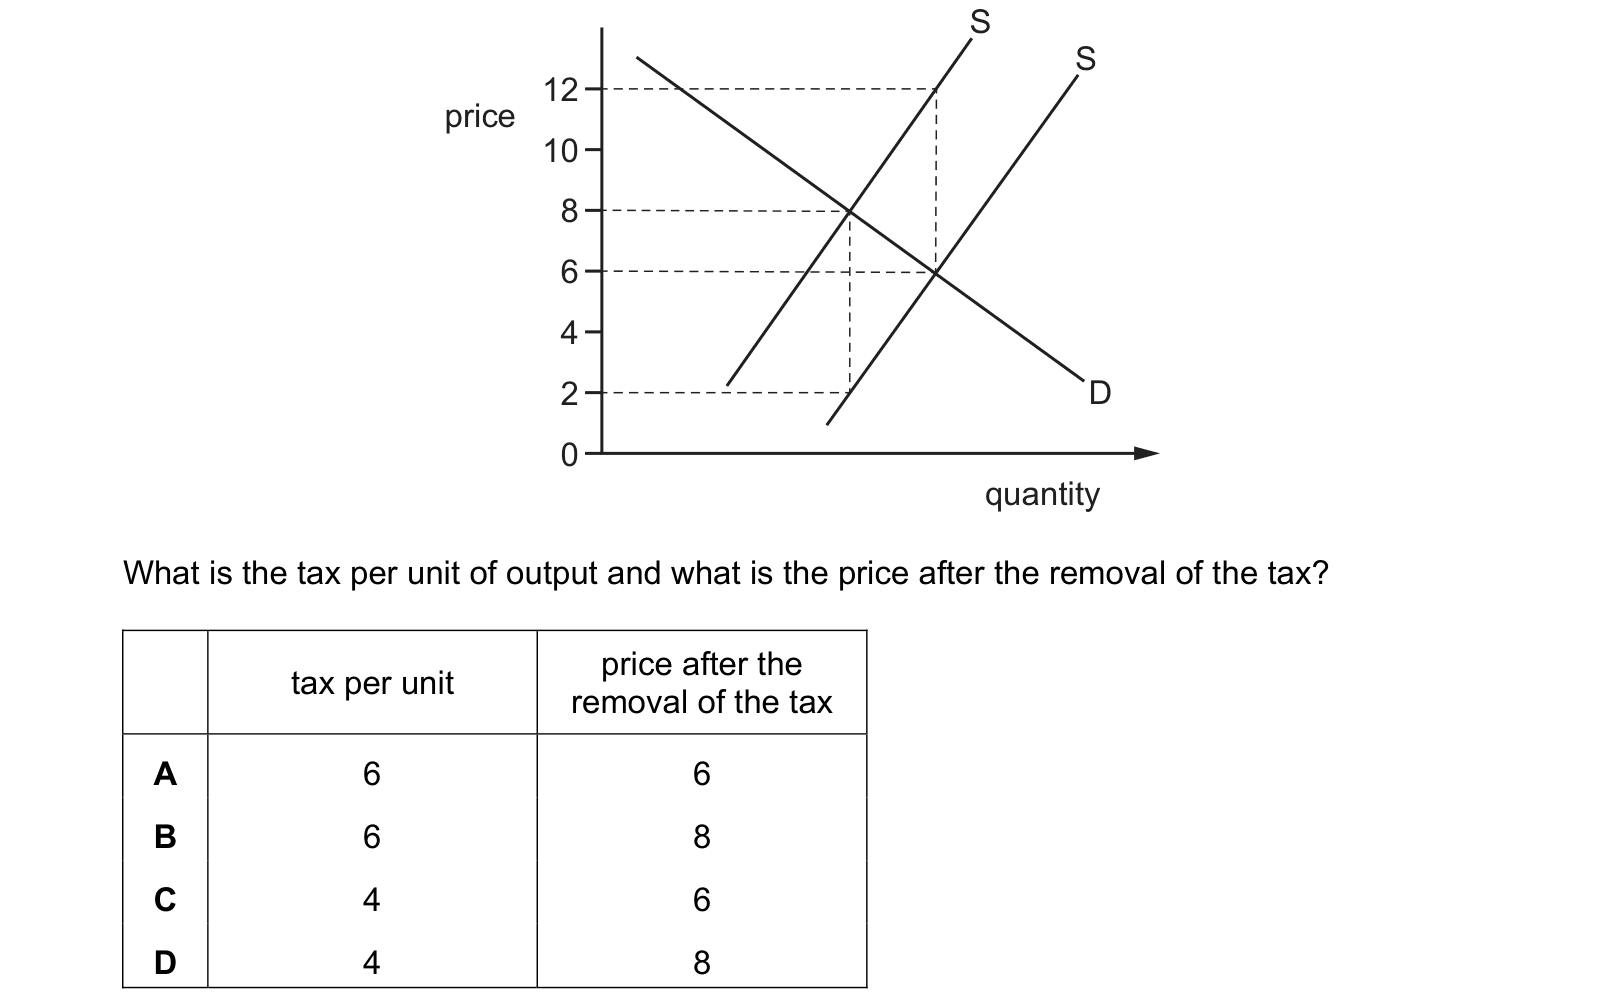
Answer: A.
Cross-board concept practice · originally a IGCSE Economics question, used here because the concept is the same. It is not AP Economics past-paper material.
Question 4
In the diagram, suppliers have set the price of a product at P S. Economic theory predicts that the equilibrium price of the product will rise to P E.
What is the reason for this movement in price?

Answer: C.
At the price PS the quantity demanded exceeds the quantity supplied, so there is a shortage. In a shortage, buyers compete for the limited amount available, and because the demand curve slopes downwards there are consumers further up it who value the product enough to pay more than PS. Suppliers discover this and raise the price. The rise continues, choking off some quantity demanded and drawing out more quantity supplied, until the shortage disappears at PE. The mechanism at work is rationing by price.
Why the other options are wrong:
- A says demand will increase. The demand curve does not move at all here; the market simply travels up it as the price rises, which is a contraction in the quantity demanded rather than an increase in demand.
- B says no more of the product can be supplied. The supply curve slopes upwards, so more can be supplied, and that is precisely what the higher price brings about.
- D says suppliers face rising costs. Rising costs would shift the supply curve to the left and change the equilibrium itself, whereas PE is the equilibrium the existing curves already determine.
Cross-board concept practice · originally a CIE 9708 question, used here because the concept is the same. It is not AP Economics past-paper material.
Question 5
The diagram shows the market demand and supply curves for rice. What would happen if a government imposed a maximum price of $10?
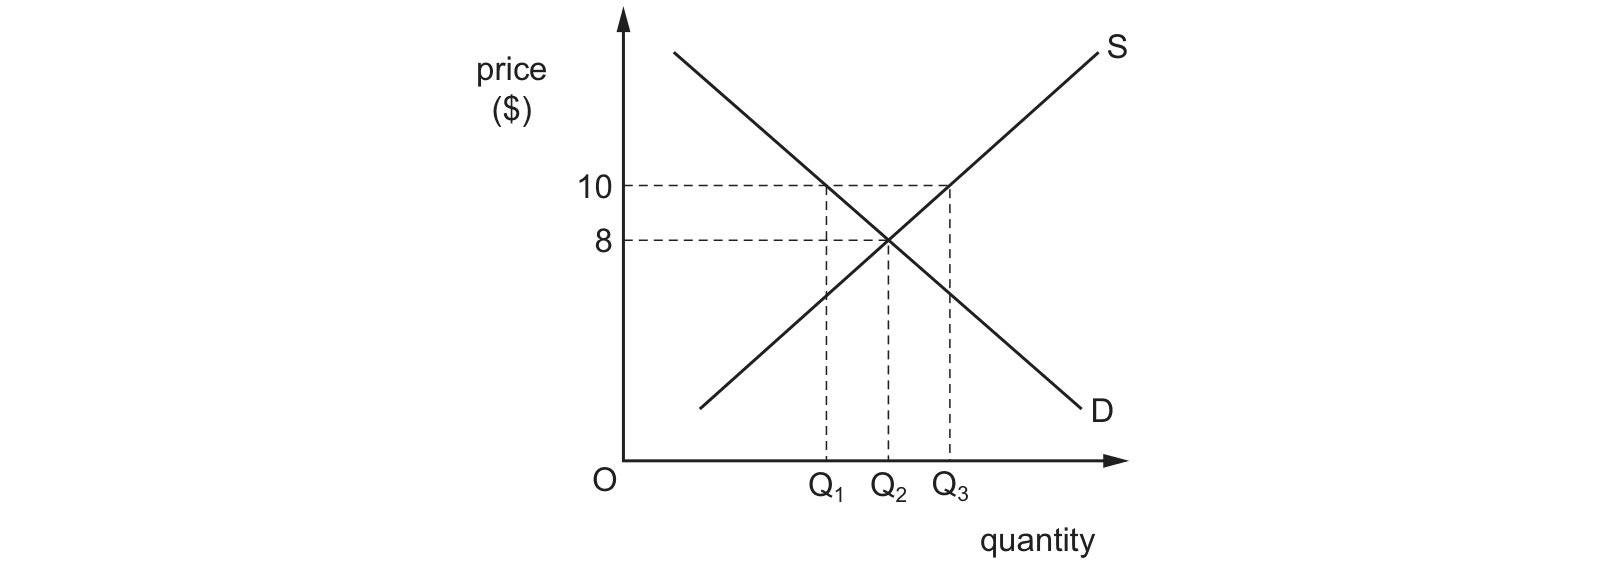
Answer: C.
What this practice covers
These questions are drawn from past Cambridge papers, mapped across to this topic because the concept is the same. You answer, you find out immediately whether you were right, and you get the reasoning for the correct option and for each distractor. Wrong answers go to a mistakes locker so you can come back to exactly those.
Practice is free. You need an account only so your progress and your mistakes are still there next time.
What examiners see students get wrong here
These are the errors that cost marks on supply and demand, taken from our own topic notes. Read them before you practise and you will recognise the traps in the questions.
- Shifting demand when only the good's own price changed.
- Shifting supply for a change in the price of a substitute, related goods act on demand.
- Drawing a price ceiling above equilibrium and then claiming a shortage.
- Reporting PED with a negative sign and misclassifying by sign instead of absolute value.
- Misreading the sign of YED or XED, which is where the whole answer usually lies.
- Forgetting to shade and label deadweight loss when a tax is imposed.
- Assuming whoever writes the cheque bears the tax.
- Claiming a determinate outcome when both curves shift.
Revise it first
If any of the above is unfamiliar, work through the notes before practising: Supply and Demand revision notes.