Employment and Unemployment: five questions to try now
Real past-paper questions, the answer key from the mark scheme, and the explanation that goes with it. No account needed to answer them.
Question 1
The table shows the percentage change in employment over a period for a country with three economic sectors.
agriculture –6 manufacturing +2
services +4
What could be concluded from this information?

Answer: B.
Question 2
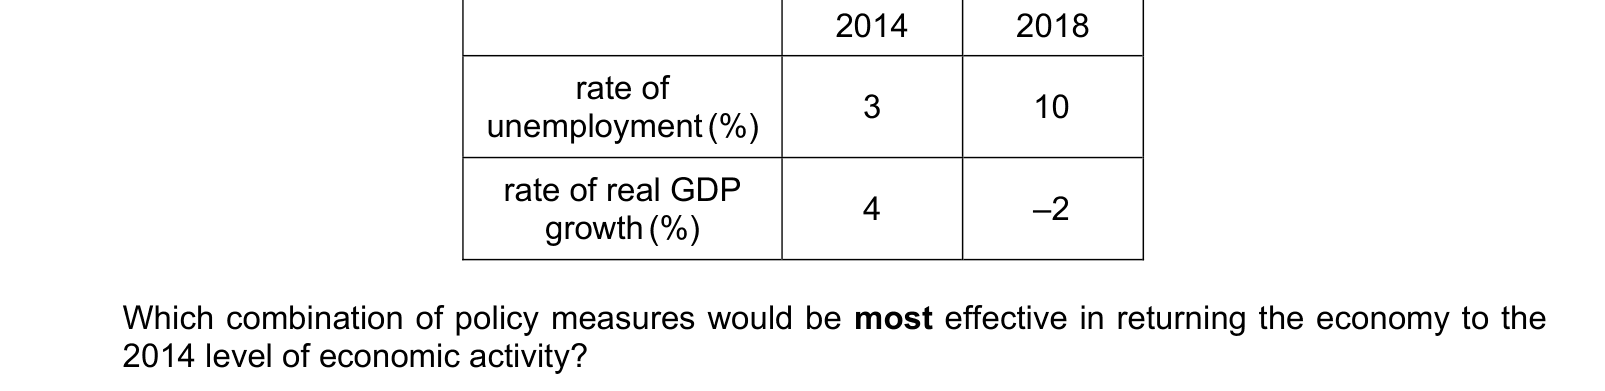
The table shows the rates of unemployment and real GDP growth for an economy in 2014 and
2018.
Answer: D.
Compare the two years. Unemployment has risen from 3% to 10% and real GDP growth has turned from plus 4% to minus 2%, so the economy has moved from healthy expansion into recession. The problem is a shortage of total demand, so both instruments must be expansionary. Higher government spending injects demand directly, and a lower interest rate encourages households to borrow and spend and firms to invest. Used together they reinforce one another.
Why the other options are wrong:
- A pairs a tax cut, which is expansionary, with a rate rise, which is contractionary. The two work against each other.
- B has both measures contractionary: less government spending and dearer borrowing would deepen the recession and raise unemployment further.
- C pairs higher direct taxes, which cut disposable income and reduce demand, with a rate cut. Again the two pull in opposite directions.
Question 3
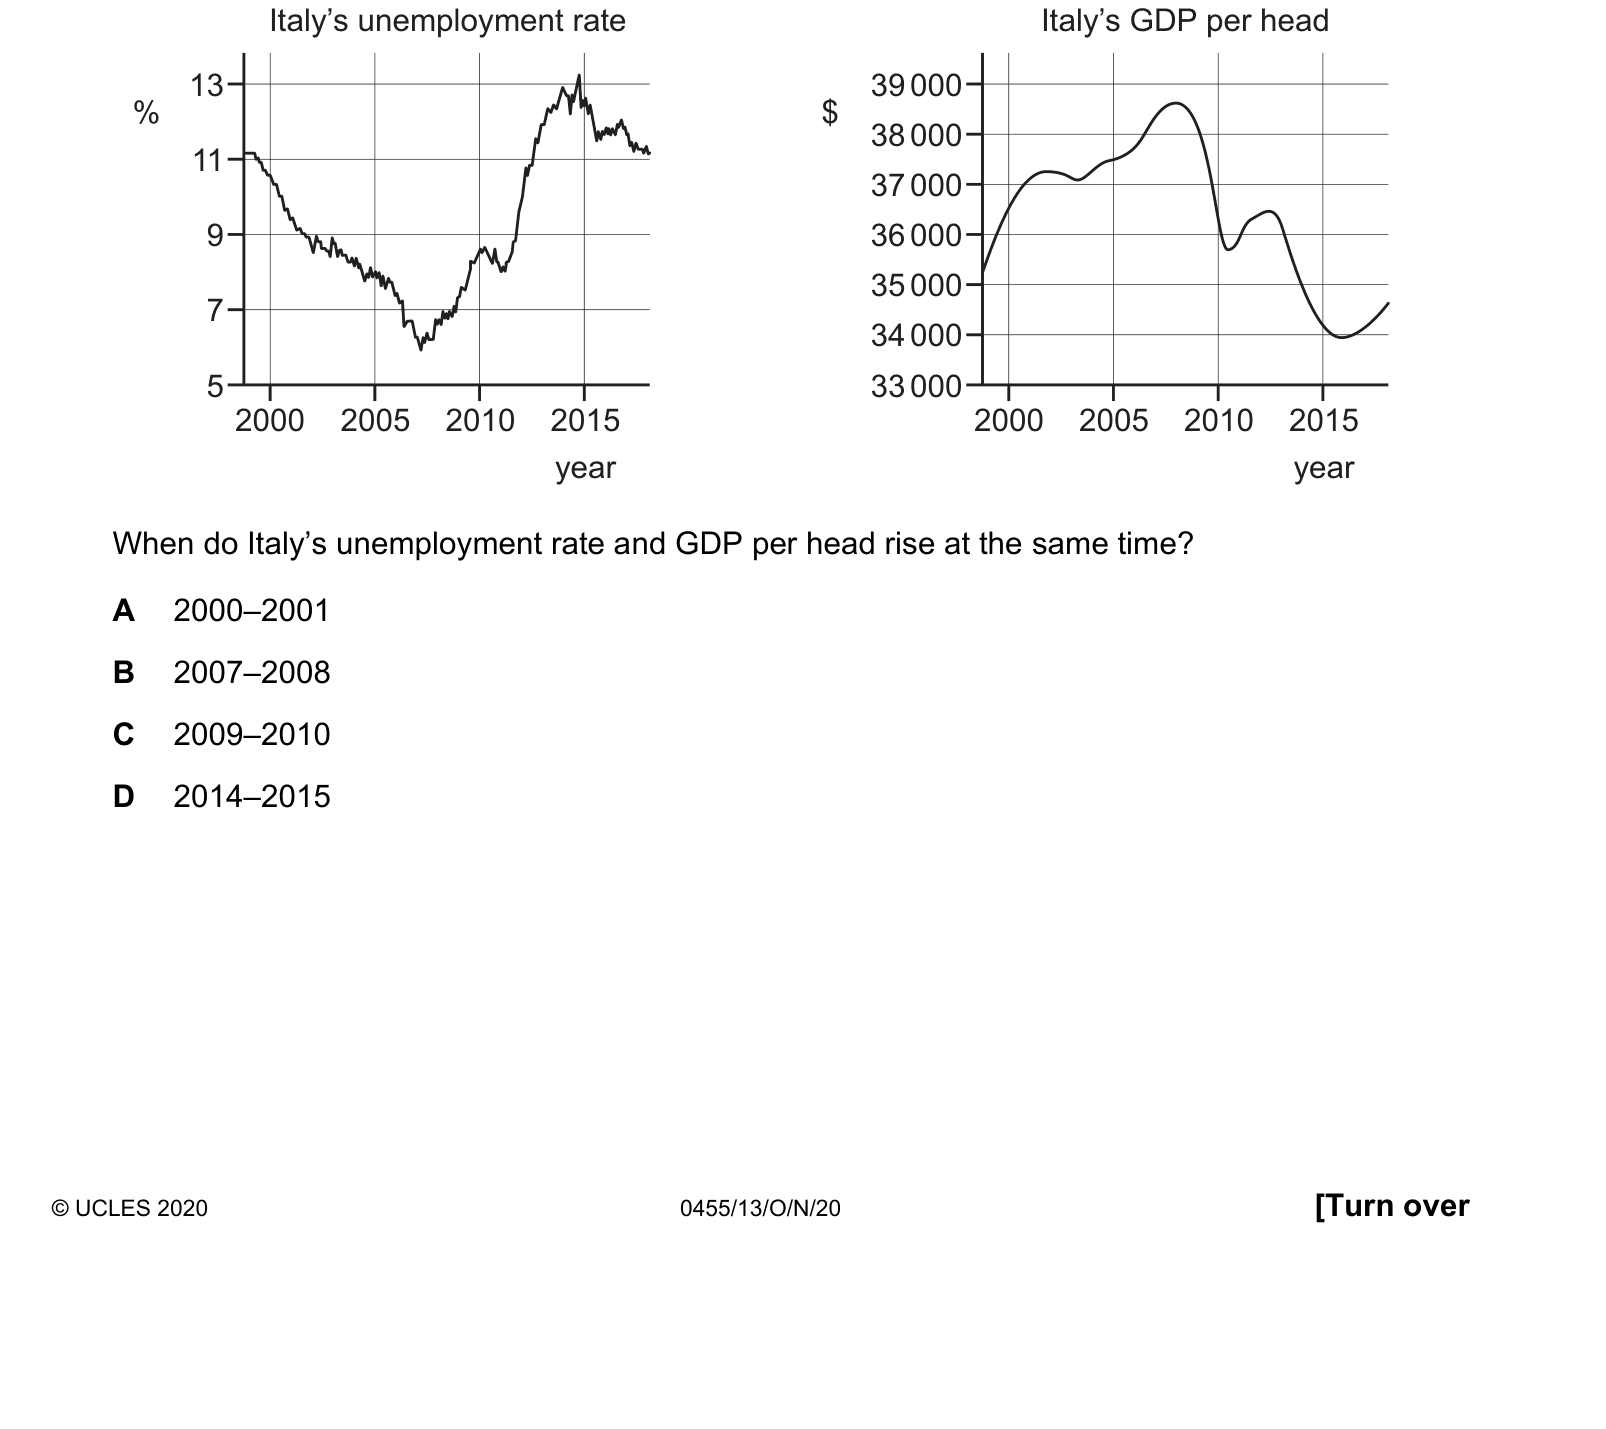
The diagrams show Italy’s unemployment rate and GDP per head. Italy’s unemployment rate
Answer: B.
The question asks for a period in which both lines are rising, which is unusual because unemployment and output per head normally move in opposite directions. Read each graph. Unemployment falls steadily from 2000 to a trough of about 6% in 2007 and then begins to climb. GDP per head rises from 2000 and reaches its peak of roughly $38 600 in 2008. So during 2007 to 2008 unemployment has already turned upwards while output per head is still rising to its peak.
Why the other options are wrong:
- A, 2000 to 2001, has GDP per head rising but unemployment falling sharply from about 11%.
- C, 2009 to 2010, has unemployment rising, but GDP per head is still falling steeply from its 2008 peak towards its low point around 2010.
- D, 2014 to 2015, has unemployment coming down from its peak of about 13% while GDP per head is at its lowest, so neither line matches.
Question 4
What is most likely to have caused a long-term decrease in the numbers employed in the banking sector of an economy?
Answer: C.
Question 5
A government increases the rate of income tax in order to pay for extra transfer payments, including cash benefits to the poor. What must occur as a result of this?
Answer: A.
What this practice covers
These questions are drawn from past Cambridge IGCSE papers and filtered to employment and unemployment. You answer, you find out immediately whether you were right, and you get the reasoning for the correct option and for each distractor. Wrong answers go to a mistakes locker so you can come back to exactly those.
Practice is free. You need an account only so your progress and your mistakes are still there next time.
What examiners see students get wrong here
These are the errors that cost marks on employment and unemployment, taken from our own topic notes. Read them before you practise and you will recognise the traps in the questions.
- Dividing by the population instead of the labour force.
- Counting economically inactive people as unemployed.
- Recommending demand-side policy for structural unemployment.
- Treating all unemployment as damaging, some frictional unemployment is normal.
- Giving consequences only for the unemployed, ignoring the government and the wider economy.
- Confusing the claimant count with the Labour Force Survey.
Revise it first
If any of the above is unfamiliar, work through the notes before practising: Employment and Unemployment revision notes.