Inflation: five questions to try now
Real past-paper questions, the answer key from the mark scheme, and the explanation that goes with it. No account needed to answer them.
Question 1
Rates of inflation and deflation are measured using a consumer prices index (CPI) over a period
of time.
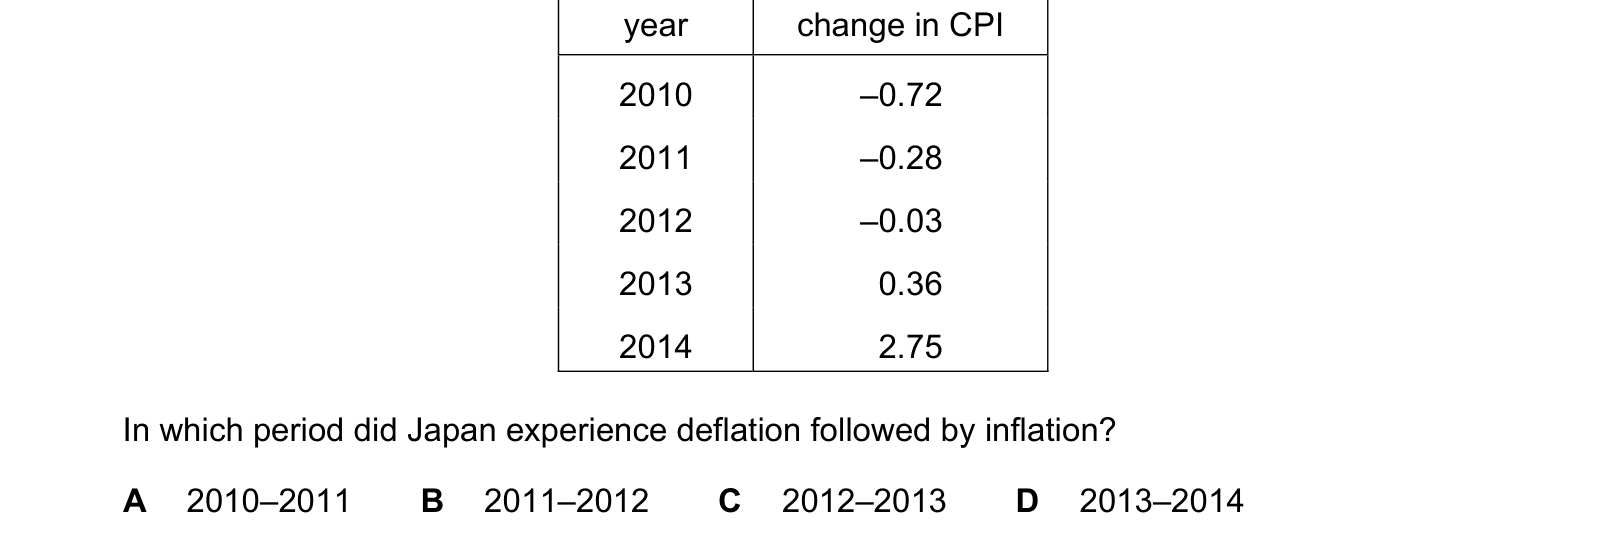
The table shows average rates of CPI for Japan from 2010–2014. year change in CPI
Answer: C.
A negative change in the consumer prices index means the general price level fell, which is deflation; a positive change means it rose, which is inflation. Read the column: 2010 is minus 0.72, 2011 is minus 0.28 and 2012 is minus 0.03, all deflation, while 2013 is plus 0.36 and 2014 is plus 2.75, both inflation. The switch from a negative figure to a positive one happens between 2012 and 2013.
Why the other options are wrong:
- A, 2010 to 2011, has two negative figures, so it is deflation followed by deflation.
- B, 2011 to 2012, is deflation followed by deflation again. The figure is getting closer to zero, but a smaller fall in prices is still a fall.
- D, 2013 to 2014, has two positive figures, so it is inflation followed by inflation, and the rate accelerates sharply.
Question 2
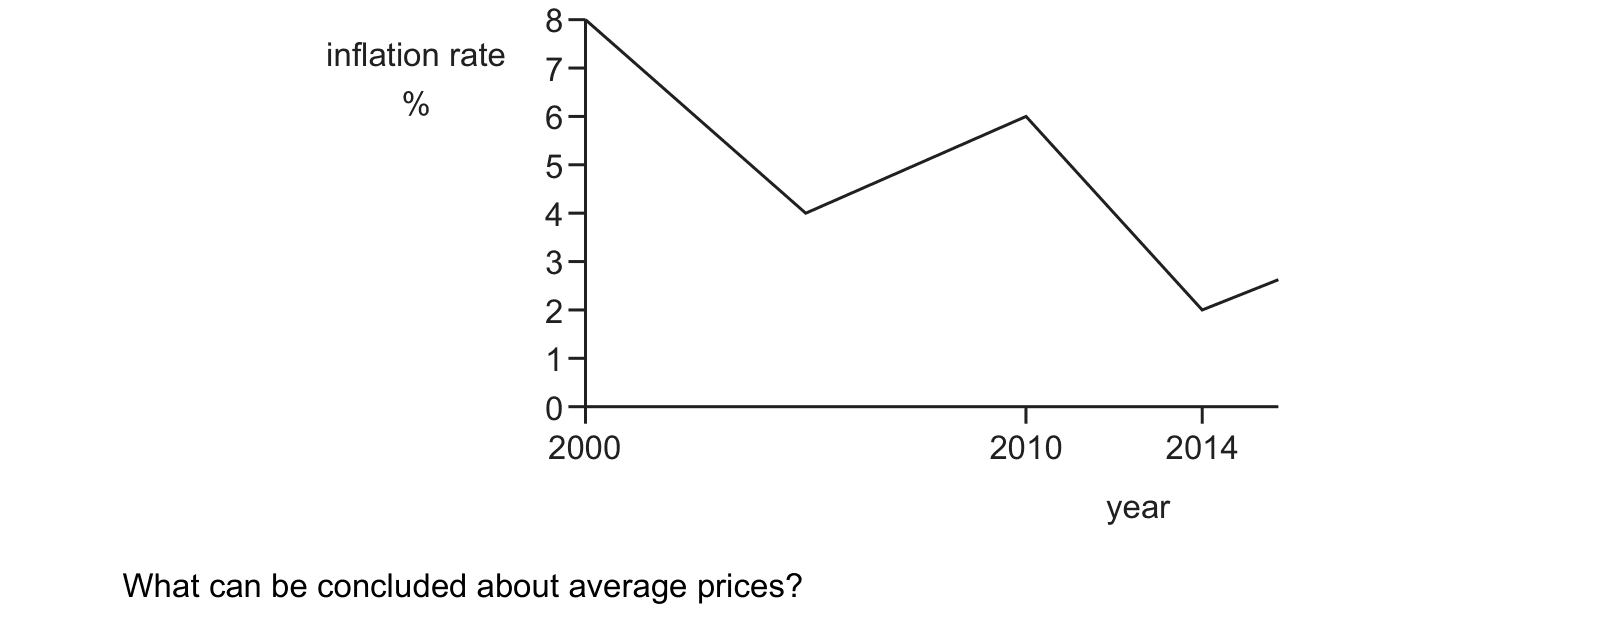
The graph shows the rate of inflation in a country between 2000 and 2014.
Answer: C.
The vertical axis is the rate of inflation, not the price level. Every point on the line lies above zero, ranging from about 8% at the start down to about 2% at its lowest. A positive inflation rate in a given year means average prices were higher at the end of that year than at the beginning, and since the rate never becomes negative, prices rose in every year of the period.
Why the other options are wrong:
- A says prices fell throughout the period. That would require the line to lie below zero, which is deflation, and it never does. The line does fall in places, but a falling rate of inflation still means rising prices.
- B says prices peaked in 2000. The rate of inflation peaked in 2000 at 8%, but prices carried on rising every year afterwards, so the price level is highest at the end of the period.
- D says prices were lower in 2014 than in 2010. Prices rose in each intervening year, so they must be higher in 2014.
Question 3
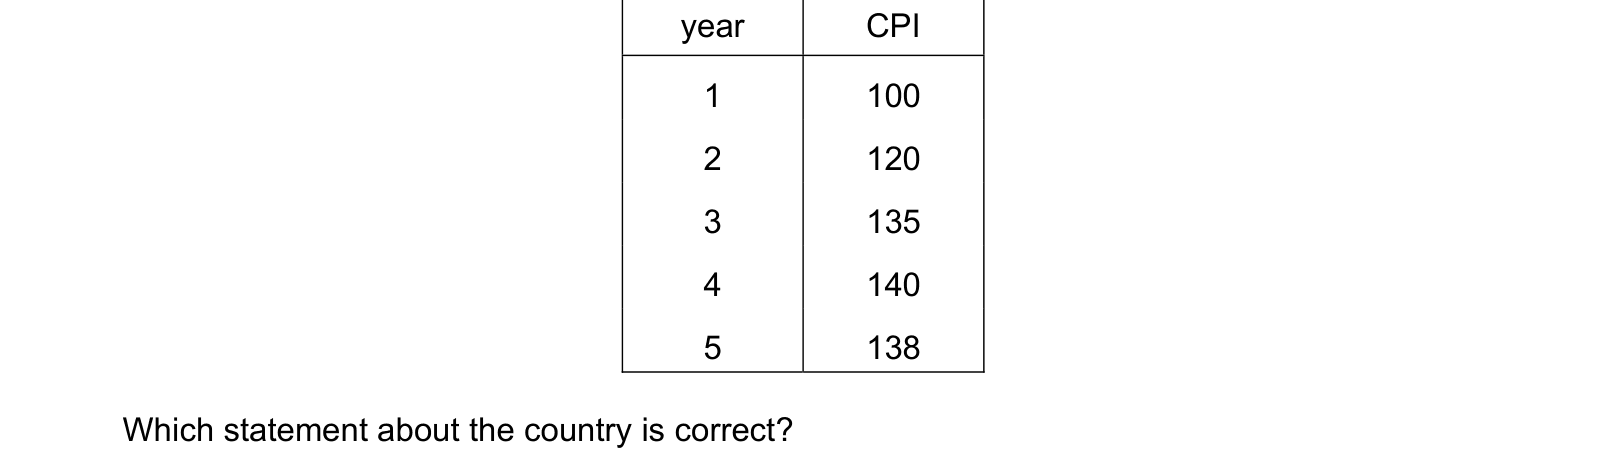
The table shows the Consumer Prices Index (CPI) of a country for five years. year CPI 1 100 2 120 3 135 4 140 5 138 Which statement about the country is correct?
Answer: C.
Question 4
The table shows changes in the Consumer Prices Index (CPI) from the base year, 1, and for the next three years. year 1 2 3 4 CPI 100 101.1 101.8 102.1 Which statement is correct?

Answer: C.
Question 5
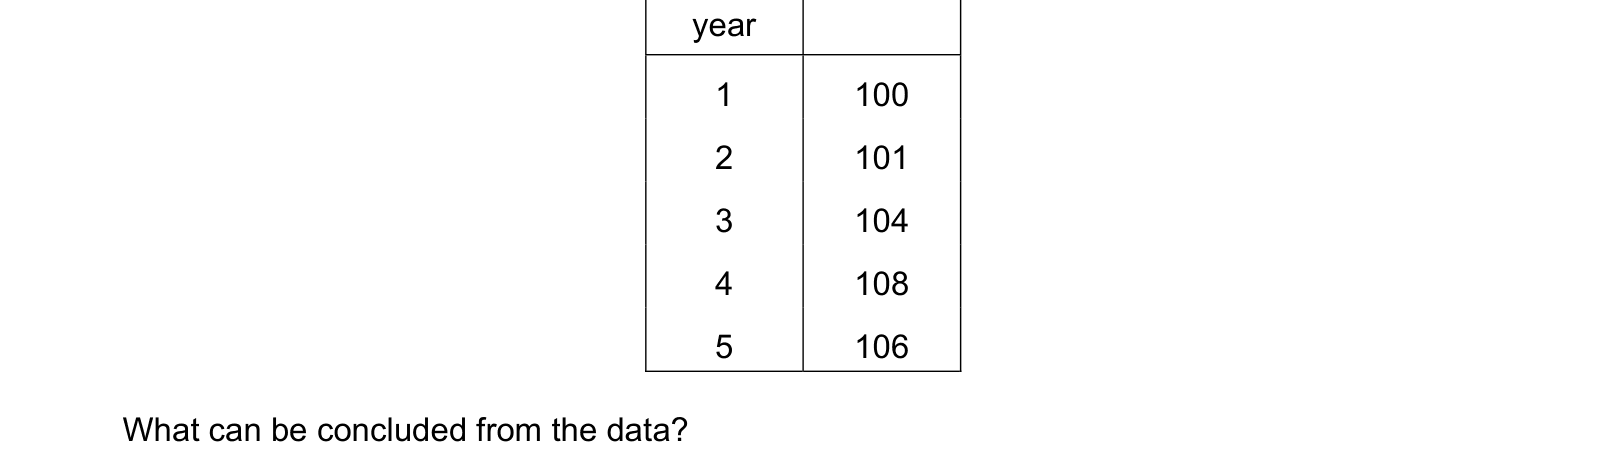
The table shows the Consumer Prices Index (CPI) of an economy. year 1 100 2 101 3 104 4 108 5 106 What can be concluded from the data?
Answer: A.
What this practice covers
These questions are drawn from past Cambridge IGCSE papers and filtered to inflation. You answer, you find out immediately whether you were right, and you get the reasoning for the correct option and for each distractor. Wrong answers go to a mistakes locker so you can come back to exactly those.
Practice is free. You need an account only so your progress and your mistakes are still there next time.
What examiners see students get wrong here
These are the errors that cost marks on inflation, taken from our own topic notes. Read them before you practise and you will recognise the traps in the questions.
- Confusing disinflation with deflation.
- Saying inflation means prices are "high" rather than rising.
- Explaining demand-pull inflation without mentioning capacity.
- Presenting inflation as purely bad, borrowers gain, and low positive inflation is the aim.
- Treating deflation as good news.
- Recommending interest-rate rises for cost-push inflation without qualification.
Revise it first
If any of the above is unfamiliar, work through the notes before practising: Inflation revision notes.