Five past-paper questions are below. Answer on the page: each one is marked the moment you pick, the correct option is shown whether or not you found it, and the full explanation opens either way.
AQA A-LevelPaper 3 MCQsFree account
Demand, Supply and Elasticities: five questions to try now
Real past-paper questions, the answer key from the mark scheme, and the explanation that goes with it. No account needed to answer them.
Question 1
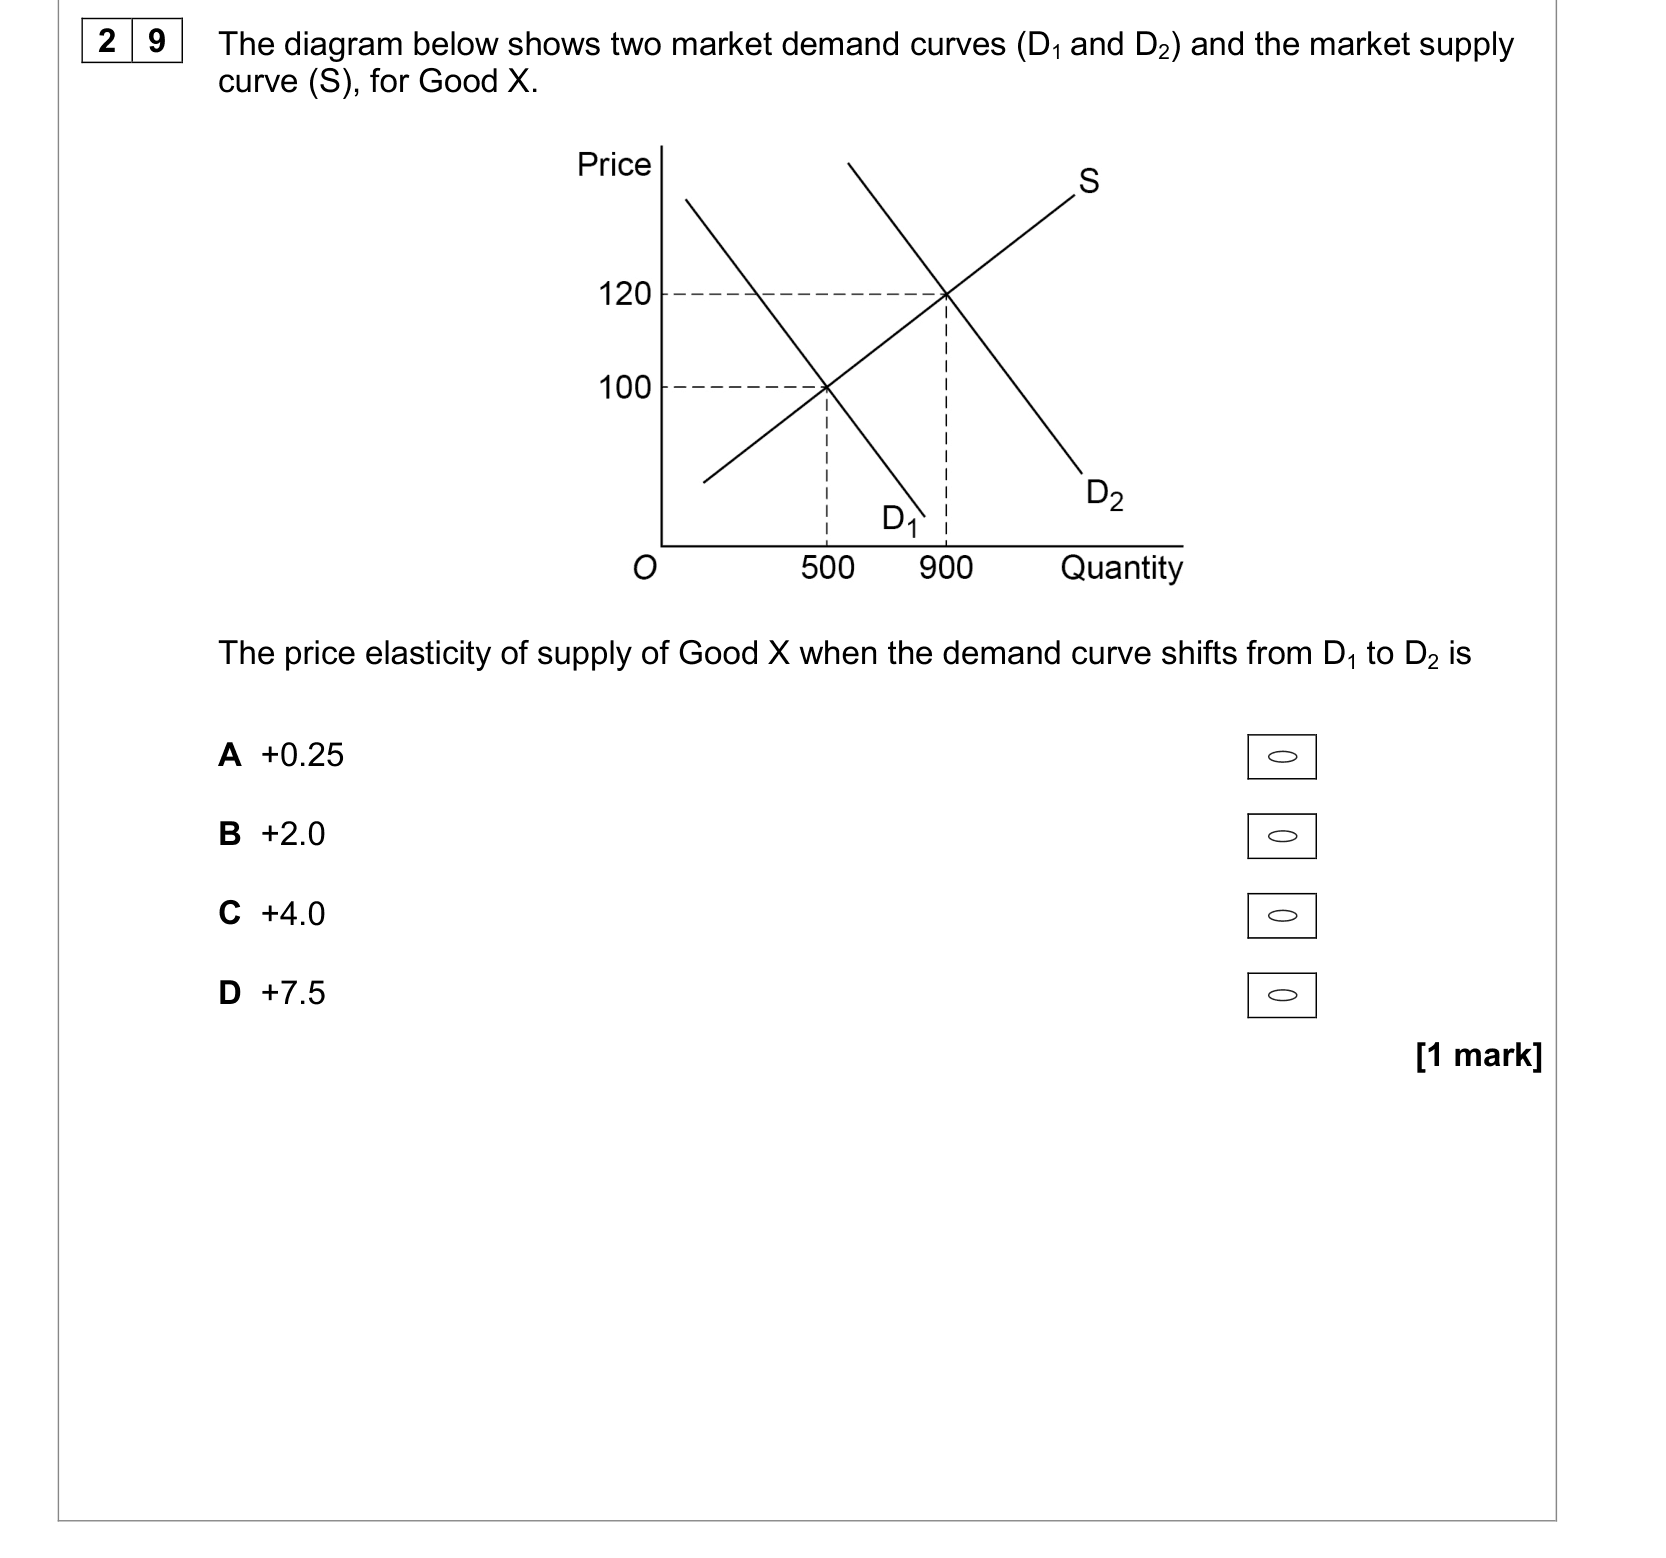
The diagram below shows two market demand curves (D 1 and D 2 ) and the market supply curve (S), for Good X. The price elasticity of supply of Good X when the demand curve shifts from D 1 to D 2 is
Answer: C.
Price elasticity of supply is read along the supply curve, so use the two equilibrium points where the demand curves cut S. Demand shifting out from D1 to D2 moves the market from a price of 100 and a quantity of 500 to a price of 120 and a quantity of 900. Quantity supplied therefore rises by 400 on a base of 500, which is +80%, while price rises by 20 on a base of 100, which is +20%. Dividing gives 80 ÷ 20 = 4.0, so supply is highly elastic, a small price rise draws out a large increase in output. The sign is positive because supply curves slope upwards, price and quantity moving together. The +0.25 option is the same two figures divided the wrong way round, and +2.0 comes from using the price rise of 20 against a 40% quantity change rather than the 80% the diagram actually shows.
Question 2
The diagram below shows the aggregate demand (AD) and two short-run aggregate supply (SRAS) curves for an economy. All other things being equal, which one of the following is most likely to cause the short-run aggregate supply curve to shift from SRAS 1 to SRAS 2?
Answer: D.
A rightward shift of short-run aggregate supply comes from lower costs of production. Lower world commodity prices cut the cost of imported raw materials and energy for every firm, so at any price level firms are willing to supply more, which is exactly the shift shown. A is wrong because a smaller labour force reduces supply capacity, shifting SRAS the other way. B is wrong because imports affect aggregate demand, not the cost of domestic production. C is the trap: the multiplier scales a change in aggregate demand, so it moves AD and leaves SRAS where it was.
Question 3
A large Asian steel-producing country dumps its surplus steel on the world market. All other things being equal, if the demand for steel is price elastic, the most likely consequence for the EU market for steel will be to
Answer: C.
Dumping floods the market with cheap steel, and with price-elastic demand buyers switch away from EU steel in large numbers. Labour is a DERIVED demand, firms hire workers to make output they can sell, so falling demand for EU steel shifts the demand curve for EU steel workers left. Note that supply of workers has not changed; it is demand for them that collapses.
Question 4
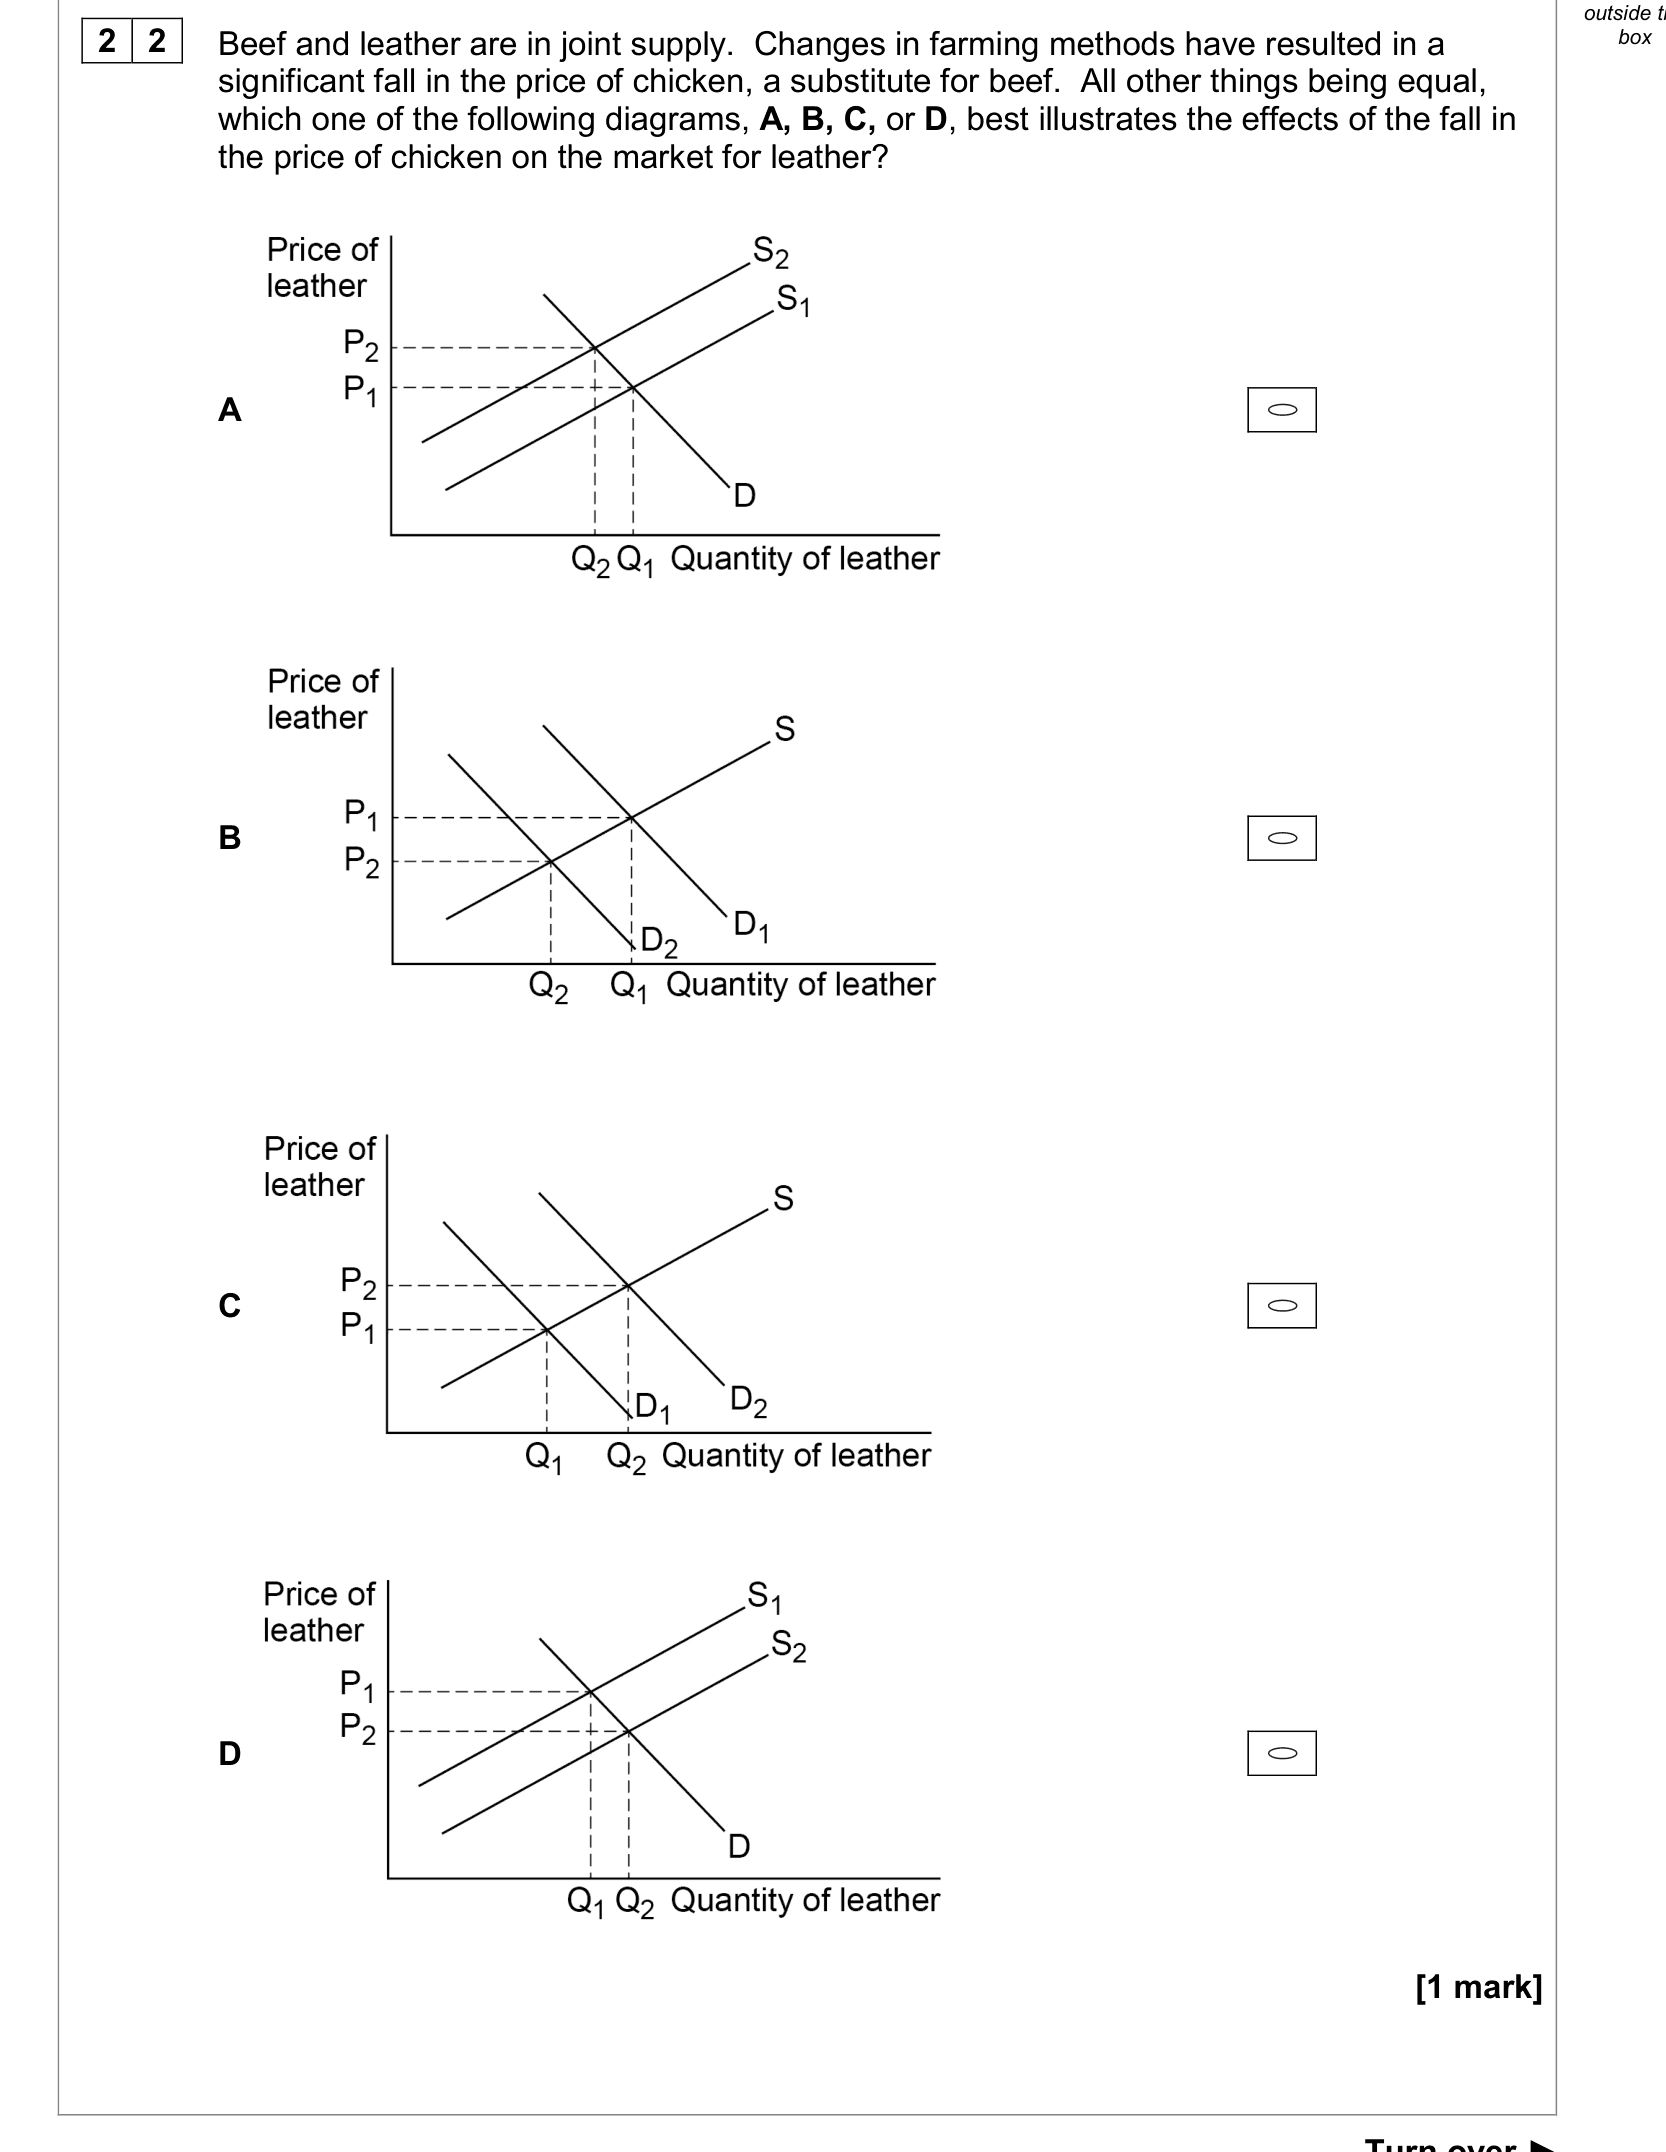
Beef and leather are in joint supply. Changes in farming methods have resulted in a significant fall in the price of chicken, a substitute for beef. All other things being equal, which one of the following diagrams, A, B, C, or D, best illustrates the effects of the fall in the price of chicken on the market for leather?
Answer: A.
Follow the chain: chicken is a substitute for beef, so cheaper chicken cuts the demand for beef. Beef and leather are in JOINT SUPPLY, so farmers rearing fewer cattle produce less leather too, the supply of leather shifts LEFT, raising its price and cutting the quantity traded. The diagram to pick is the one showing a leftward supply shift in the leather market, not a demand shift.
Question 5
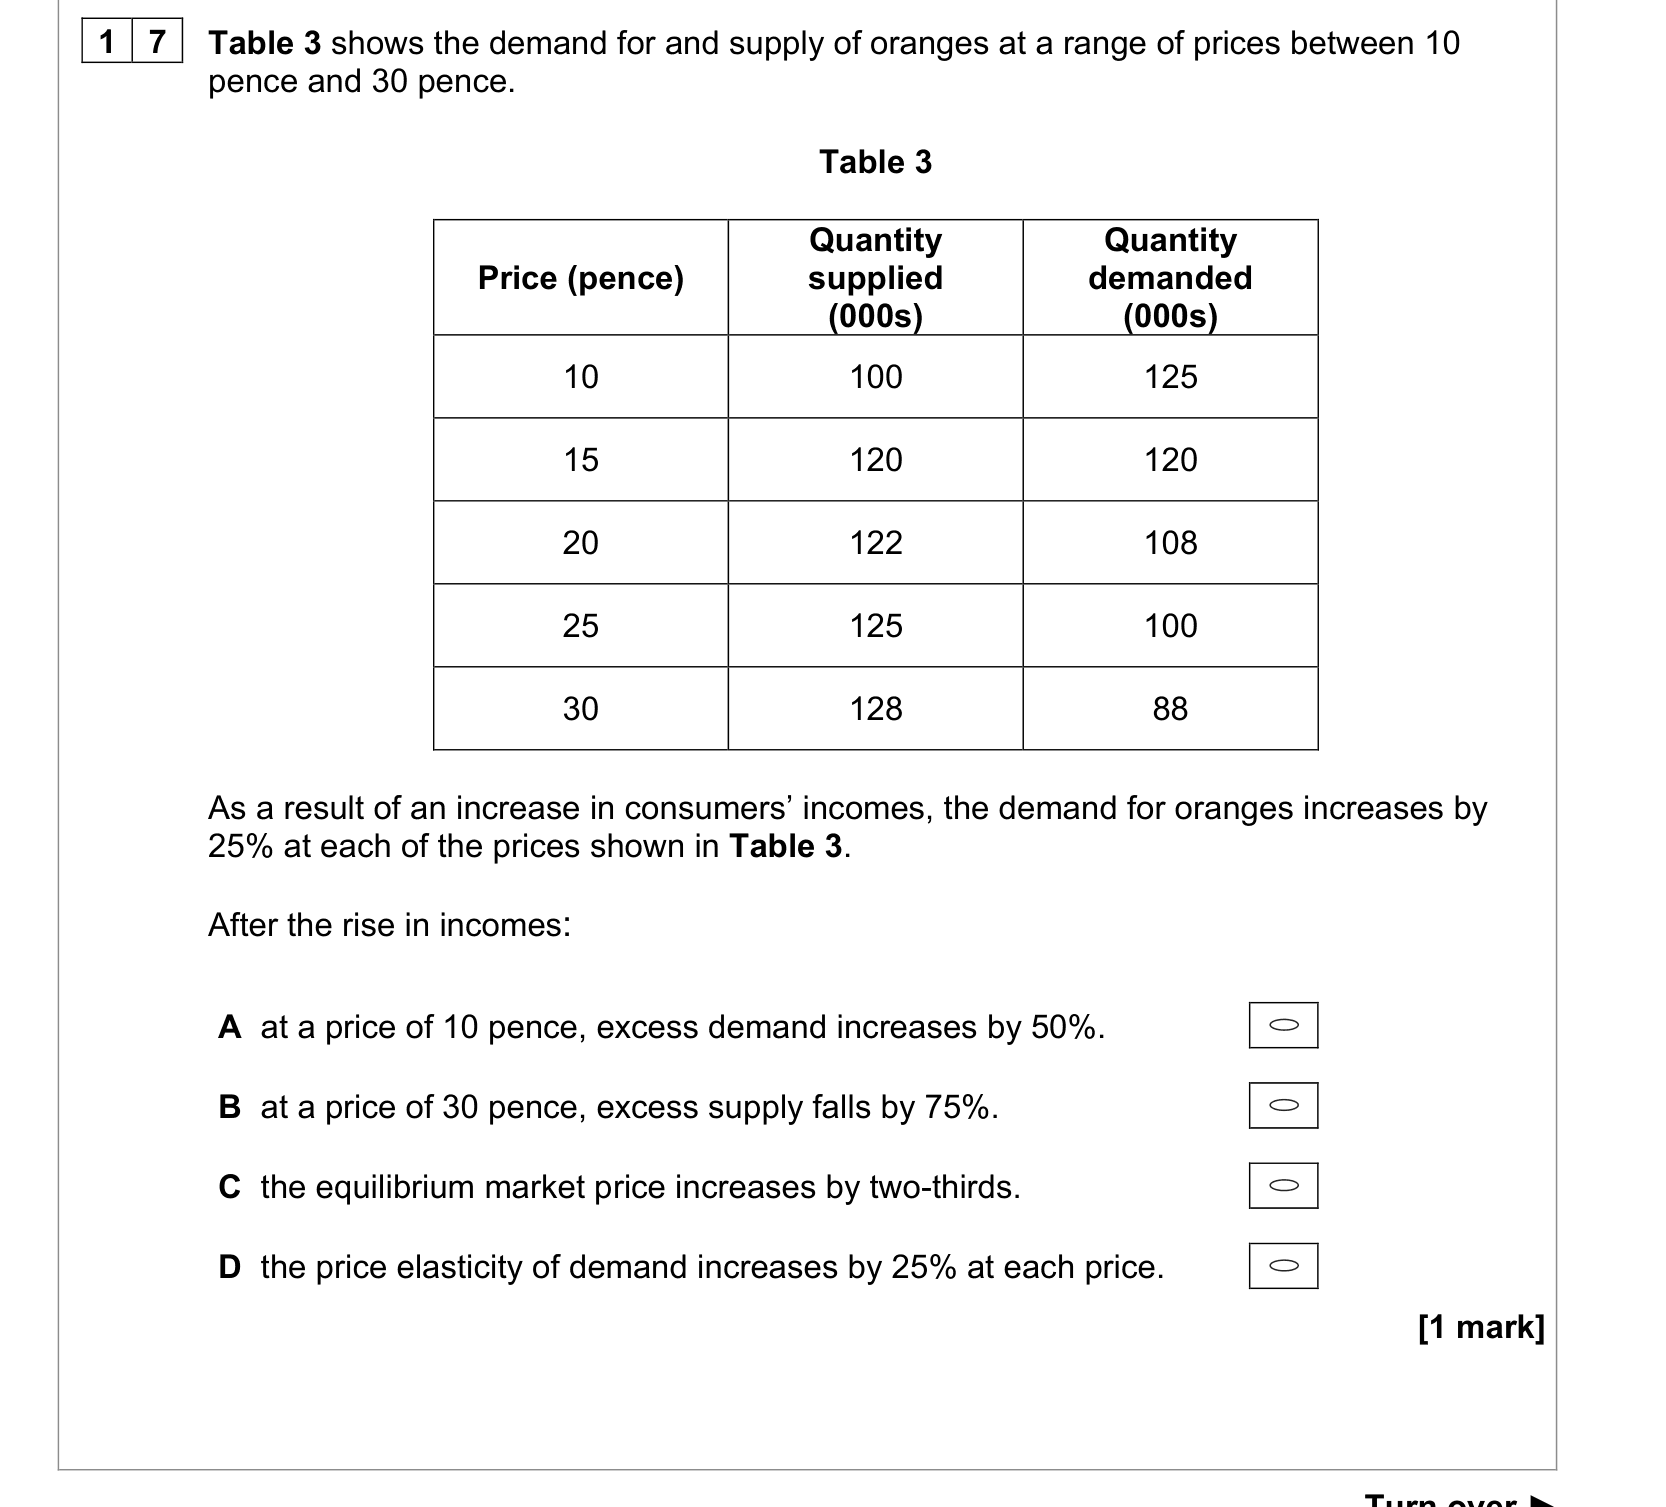
Table 3 shows the demand for and supply of oranges at a range of prices between 10 pence and 30 pence. Table 3 Price (pence) Quantity supplied (000s) Quantity demanded (000s) 10 100 125 15 120 120 20 122 108 25 125 100 30 128 88 As a result of an increase in consumers’ incomes, the demand for oranges increases by 25% at each of the prices shown in Table 3. After the rise in incomes:
Answer: C.
Find both equilibria from the table. Initially supply equals demand at 15 pence, where both are 120. Higher consumer income shifts demand right, and the new equilibrium in the table is at 25 pence, a rise of 10 pence on 15, which is two-thirds. Locate the row where the two quantities match before and after, then compare the prices.
These questions are drawn from past AQA A-Level papers. You answer, you find out immediately whether you were right, and you get the reasoning for the correct option and for each distractor. Wrong answers go to a mistakes locker so you can come back to exactly those.
Practice is free. You need an account only so your progress and your mistakes are still there next time.
These are the errors that cost marks on demand, supply and elasticities, taken from our own topic notes. Read them before you practise and you will recognise the traps in the questions.
Confusing a movement along the curve with a shift. Only the good's own price causes a movement.
Dropping the sign in elasticity answers, the sign carries the meaning in YED and XED.
Saying an elasticity is "high" without saying elastic or inelastic relative to 1.
Treating "inferior good" as low quality; it means demand falls as income rises.
Adding percentage changes to find the revenue effect instead of multiplying the factors.
Treating a whole demand curve as having one elasticity.
Judging PES from the steepness of a straight-line supply curve rather than which axis it cuts.
Assuming whoever pays the tax to the government bears it.