Consumer and Producer Surplus
Contents: 9 sections
What the surpluses measure
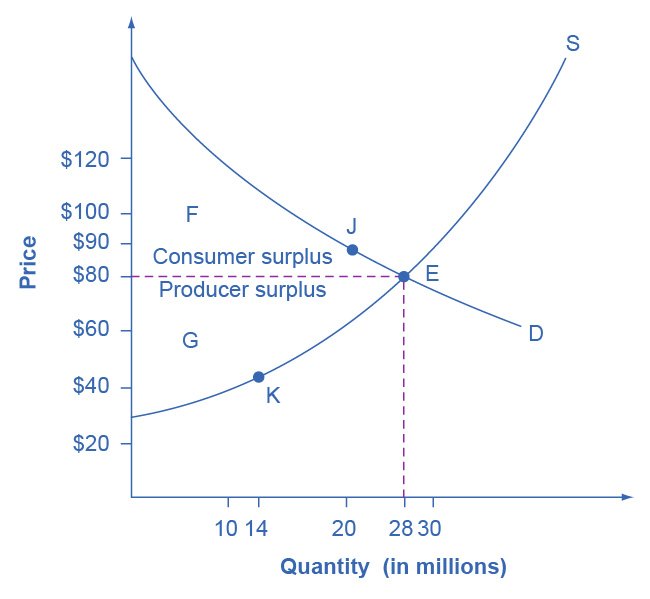
Surplus measures the welfare gain from trade, the benefit each side gets over and above what they would have accepted.
Consumer surplus is the difference between what consumers are willing to pay and what they actually pay.
On a diagram it is the area below the demand curve and above the market price, up to the equilibrium quantity.
The demand curve traces willingness to pay: the first unit is bought by the consumer who values it most. Everyone who would have paid more than the market price captures the difference.
Producer surplus is the difference between the price producers receive and the minimum they would have accepted (their marginal cost).
It is the area above the supply curve and below the market price, up to the equilibrium quantity.
Total welfare (community surplus) = consumer surplus + producer surplus. In a competitive market with no externalities, the free-market equilibrium maximises it, the standard efficiency result and the benchmark against which every intervention is judged.
What changes the surpluses
| Change | Consumer surplus | Producer surplus |
|---|---|---|
| Demand rises (shift right) | Rises | Rises |
| Demand falls | Falls | Falls |
| Supply rises (shift right, e.g. new technology) | Rises: price falls, quantity rises | Ambiguous: lower price but higher volume |
| Supply falls (e.g. cost shock) | Falls | Ambiguous |
| Price rises above equilibrium (e.g. minimum price) | Falls | May rise, but quantity traded falls |
Elasticity determines how the gain is shared, and this is the point that separates strong answers:
- The more inelastic side of the market captures the larger share of the surplus and bears the larger share of any tax.
- A very inelastic demand curve is steep, so the area between it and the price is large, consumer surplus is high, because consumers value the good far above what they pay.
Indirect taxes and surplus
An indirect tax raises firms' costs, shifting supply left (upwards by the amount of the tax).
- Price rises, quantity falls
- consumer surplus falls
- producer surplus falls
- part of the lost surplus is transferred to the government as tax revenue
- but part is lost altogether.
That lost part is deadweight loss, the welfare of trades that would have been mutually beneficial but no longer happen because the tax has priced them out. It is the triangle between the two supply curves, bounded by the demand curve, over the range of the fall in quantity.
Tax incidence, who actually bears the tax, depends on relative elasticity:
- Demand inelastic relative to supply
- most of the burden falls on consumers, and the deadweight loss is small because quantity barely changes.
- Demand elastic
- most falls on producers, and the deadweight loss is large.
Working the areas
The surpluses are triangles and the tax areas are a rectangle plus two triangles, so every one of them is arithmetic once the prices and quantities are read off.
Before any tax. Demand meets supply at £30 with 600 units. Demand reaches zero at £70; supply starts at £10.
Consumer surplus = ½ × (70 − 30) × 600 = £12,000
Producer surplus = ½ × (30 − 10) × 600 = £6,000
Community surplus = £18,000
Now a £6 per-unit tax. Consumers pay £34, producers keep £28, quantity falls to 500.
Government revenue = £6 × 500 = £3,000
Consumer surplus lost = (34 − 30) × 500 + ½ × (34 − 30) × 100 = £2,200
Producer surplus lost = (30 − 28) × 500 + ½ × (30 − 28) × 100 = £1,100
Deadweight loss = ½ × £6 × (600 − 500) = £300
Check the parts account for each other: £2,200 + £1,100 = £3,300 lost between the two sides, of which £3,000 is transferred to the government and £300 is destroyed. If your figures do not reconcile like that, a price has been read off the wrong curve.
Consumers bear two-thirds of the burden, so demand is the more inelastic side here, and note the consumer price rose by £4, not the full £6.
Subsidies and surplus
A subsidy lowers firms' costs, shifting supply right.
- Price falls, quantity rises
- consumer surplus rises
- producer surplus rises
- but the government pays out, and that cost exceeds the combined gain
- there is again a deadweight loss, because output has been pushed beyond the efficient level.
The gain is split according to elasticity, exactly as with a tax: the more inelastic side captures the larger share of the subsidy's benefit.
The crucial evaluation point is the opportunity cost of the government spending, and whether the subsidy is justified, which it is if the good generates positive externalities, because the free-market quantity was too low to begin with (5.1).
Worked example
A government imposes a specific tax of £2 per unit on a good with inelastic demand.
- Supply shifts up by £2
- the equilibrium price rises. Say by £1.60, and quantity falls slightly
- consumers pay £1.60 more per unit and producers absorb 40p of the tax.
Working through the welfare effects:
- Consumer surplus falls by the price rise multiplied by the units still bought, plus a small triangle for the units no longer bought.
- Producer surplus falls by the 40p per unit they absorb, plus their share of the lost trades.
- Government revenue = £2 × the new quantity, a transfer, not a loss, since it can be spent on public services.
- Deadweight loss = the small triangle representing trades that no longer take place.
Evaluation.
- Because demand is inelastic, quantity barely falls, so the deadweight loss is small and revenue is large; this is precisely why governments tax inelastic goods such as fuel, alcohol and tobacco.
- But the incidence falls overwhelmingly on consumers, and since inelastic goods are usually necessities, the tax is regressive.
- The welfare loss calculation assumes the free-market equilibrium was efficient. If the good generates negative externalities, the tax increases total welfare by correcting an over-allocation of resources, the deadweight loss triangle is then an efficiency gain, not a loss.
- Whether the government revenue improves welfare depends entirely on how it is spent.
Judgement: on inelastic goods, taxation raises substantial revenue at low efficiency cost, but with a regressive distributional effect. Where the good is demerit, the efficiency case is stronger still; where it is not, the tax is a pure transfer with a welfare cost attached.
Common exam mistakes
- Reversing the two areas. Consumer surplus is below demand, above price; producer surplus is above supply, below price.
- Forgetting that government tax revenue is a transfer, not part of the deadweight loss.
- Omitting the deadweight loss entirely when asked about welfare effects of a tax.
- Saying a subsidy raises welfare unconditionally, it creates deadweight loss unless it corrects a positive externality.
- Ignoring elasticity when discussing who bears a tax.
- Shading the tax revenue rectangle as if it were lost welfare.
Exam technique
Draw the diagram. Almost every mark in this topic is attached to correctly identified areas. Label the pre-tax and post-tax price, the price producers receive, the quantities, and shade consumer surplus, producer surplus, tax revenue and deadweight loss distinctly.
State incidence explicitly and link it to elasticity, "because demand is more inelastic than supply, consumers bear the larger share."
For evaluation, question whether the original equilibrium was efficient at all. If there are externalities, the whole welfare analysis changes sign, and saying so is the highest-level point available.
Quick revision
- Consumer surplus: below demand, above price. Willingness to pay minus price paid.
- Producer surplus: above supply, below price. Price received minus minimum acceptable.
- Community surplus = the two combined; maximised at competitive equilibrium with no externalities.
- Indirect tax
- both surpluses fall; part transfers to government, part is deadweight loss.
- Subsidy
- both surpluses rise, but government cost exceeds the gain; deadweight loss again.
- Incidence and benefit fall mainly on the more inelastic side.
- Inelastic demand → large revenue, small deadweight loss, regressive.
- If externalities exist, the free-market equilibrium was not efficient, and intervention can raise welfare.
What the syllabus asks for on this topicSpecification points
Specification points
- Consumer and producer surplus and how they are shown on a diagram.
- The effects of changes in supply and demand on surplus.
- The impact of indirect taxes and subsidies on surplus.
Related AQA A-Level topics
Not the topic you were looking for? Describe what you are stuck on in your own words and we will take you to the notes that answer it.