Revenue and Profit
Contents: 9 sections
Revenue
| Measure | Formula | Note |
|---|---|---|
| Total revenue (TR) | Price × quantity | |
| Average revenue (AR) | TR ÷ Q | AR = price, so the AR curve is the demand curve |
| Marginal revenue (MR) | ΔTR ÷ ΔQ | Revenue from selling one more unit |
Two cases, and AQA tests both:
A price taker (perfect competition) can sell any quantity at the market price. Its demand curve is perfectly elastic, so AR = MR = price, both horizontal, and TR rises in a straight line.
A price maker (any firm with market power) faces a downward-sloping demand curve. To sell one more unit it must lower the price on every unit, so MR falls faster than AR and MR lies below AR. For a straight-line demand curve, MR has twice the gradient and cuts the horizontal axis halfway to where AR does.
The link to elasticity is the point that carries the marks:
- Where demand is elastic, MR is positive, cutting price raises total revenue.
- Where demand is unit elastic, MR = 0 and TR is at a maximum.
- Where demand is inelastic, MR is negative, cutting price reduces total revenue.
A profit-maximising firm therefore never operates on the inelastic part of its demand curve: it could raise price, sell less, earn more revenue and incur lower costs simultaneously.
Building the revenue schedule
The relationships above are far easier to trust once computed. A price maker faces this demand schedule:
| Q | Price (= AR) | TR | MR |
|---|---|---|---|
| 1 | £10 | £10 | £10 |
| 2 | £9 | £18 | £8 |
| 3 | £8 | £24 | £6 |
| 4 | £7 | £28 | £4 |
| 5 | £6 | £30 | £2 |
| 6 | £5 | £30 | £0 |
| 7 | £4 | £28 | −£2 |
Three things to read off it, all of which the exam asks:
- MR falls twice as fast as AR. AR drops £1 per unit; MR drops £2. That is the "twice the gradient" rule arriving as arithmetic rather than assertion.
- TR is maximised where MR = 0, at 6 units, and stays flat between 5 and 6 because MR there is £2 and £0. Past that, MR turns negative and TR falls.
- MR is below AR at every quantity beyond the first, because selling one more unit means cutting the price on all the earlier ones too. At Q = 2 the firm gains £9 on the new unit but loses £1 on the first: MR = £8, not £9.
That last line is the whole reason market power produces P > MC, and it is worth being able to state in one sentence.
Profit
Profit = total revenue − total cost
Economists count opportunity cost, which accountants do not. Total cost includes the return the entrepreneur could have earned in the next best use of their time and capital.
- Normal profit is the minimum return needed to keep the entrepreneur in this industry. It is treated as a cost of production, so a firm earning exactly normal profit breaks even in economic terms (TR = TC) and has no reason to leave.
- Supernormal (abnormal) profit is any profit above normal. It attracts new entrants, unless barriers to entry prevent them (4.1).
- A loss means TR < TC. In the short run a firm continues while it covers average variable cost, since it must pay fixed costs either way; below AVC it shuts down immediately. In the long run it leaves unless it covers average total cost.
The shut-down conditions, which are frequently examined:
| Condition | Decision |
|---|---|
| AR ≥ ATC | Continue; at least normal profit |
| AVC ≤ AR < ATC | Continue in the short run: losses are smaller than the fixed costs of closing |
| AR < AVC | Shut down immediately |
The profit-maximising rule
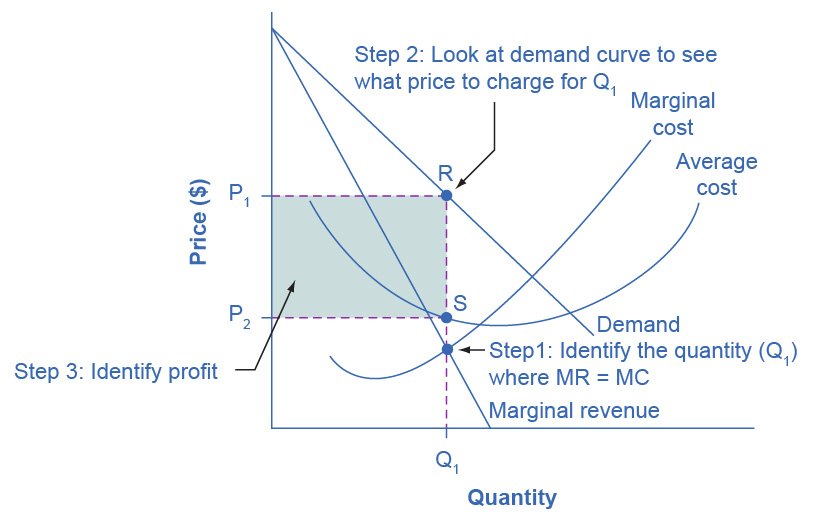
Profit is maximised where MC = MR, with MC rising through MR.
The logic is marginal, and stating it earns credit: while MR > MC, the next unit adds more to revenue than to cost, so producing it raises profit. While MR < MC it destroys profit. Profit is therefore greatest where they are equal.
Reading profit off the diagram is a two-step move worth drilling, because reversing it is the most common error in this topic:
- Find the quantity where MR = MC.
- Read up to the AR (demand) curve for the price. Never off MR.
- The profit per unit is the vertical gap between price and ATC at that quantity; total profit is that gap × quantity, shown as a rectangle.
Worked figures. A firm maximises profit at 400 units, where price is £18 and ATC is £13.
Profit per unit = £18 − £13 = £5
Total supernormal profit = £5 × 400 = £2,000
If ATC were £18, the firm would earn exactly normal profit, zero supernormal, but still a viable business, because normal profit is already inside ATC as a cost.
Alternative objectives
Firms do not always maximise profit, and explaining why matters more than listing the alternatives.
The divorce of ownership from control. In large firms, shareholders own but managers control. Managers pursue their own objectives, larger salaries, prestige, job security, which are tied more closely to size than to profit. This is a principal–agent problem, and it rests on asymmetric information: shareholders cannot fully observe what managers do.
| Objective | Rule | Why |
|---|---|---|
| Profit maximisation | MC = MR | Shareholder returns |
| Revenue maximisation | MR = 0 | Managerial pay and status tied to sales; economies of scale |
| Sales (output) maximisation | AR = ATC: the largest output consistent with normal profit | Market share, deterring entry |
| Profit satisficing | "Good enough" profit | Balancing competing stakeholder demands |
| Survival | Whatever it takes | New firms, or recession |
| Social or environmental objectives | Non-financial targets | Reputation, ethics, regulation |
Note the ordering: for a firm with market power, output is lowest under profit maximisation, higher under revenue maximisation, and highest under sales maximisation, with price moving the opposite way. Consumers therefore benefit when firms depart from profit maximisation, which is a useful evaluation point.
Worked example
A monopolist's managers switch from profit maximisation to revenue maximisation.
Profit maximisation sets output where MC = MR. Revenue maximisation sets output where MR = 0, which is further right → so output rises and, reading up to the AR curve, price falls.
Consequences:
- Consumers gain: lower price, higher output, greater consumer surplus (2.3), and allocative efficiency improves because price moves closer to marginal cost.
- Shareholders lose: profit is no longer at its maximum, so dividends and share price fall.
- The firm moves to where demand is unit elastic; any further price cut would now reduce revenue.
- Higher output may deliver economies of scale (3.1), lowering average cost and partly offsetting the lost profit margin.
Evaluation.
- The switch depends on the divorce of ownership from control. Shareholders can close the gap with performance-related pay or share options, realigning managers' incentives with profit.
- The lower profit reduces retained earnings, the main source of investment finance, so long-run innovation and capacity may suffer, harming the consumers who gained in the short run.
- Firms rarely know their MR and MC curves precisely, so in practice they satisfice, using cost-plus pricing rather than any exact rule.
- Sustained supernormal profit is what attracts entry; a firm deliberately holding profit down may be pursuing entry deterrence rather than managerial self-interest, in which case its long-run profit is higher, not lower.
Judgement: revenue maximisation raises short-run consumer welfare relative to profit maximisation, but the effect on long-run welfare depends on whether the lost profit would have funded investment.
Common exam mistakes
- Saying normal profit means zero profit. It is zero economic profit but a positive accounting return, and it is a cost.
- Drawing MR anywhere other than twice the gradient, cutting the axis halfway along AR.
- Forgetting that in perfect competition AR = MR = price.
- Confusing revenue maximisation (MR = 0) with sales maximisation (AR = ATC).
- Giving the shut-down point as ATC rather than AVC in the short run.
- Stating MC = MR without the marginal reasoning behind it.
Exam technique
Always identify whether the firm is a price taker or price maker before drawing anything, the whole revenue diagram follows from that.
For "why might a firm not profit maximise", the analytical core is the divorce of ownership from control and the principal–agent problem. Name them.
For evaluation, compare objectives by their effect on price, output, consumer surplus and long-run investment, and note that firms rarely have the information to apply any rule precisely.
Quick revision
- AR = price = the demand curve. MR = ΔTR ÷ ΔQ.
- Price taker: AR = MR = price, horizontal. Price maker: MR below AR, twice the gradient.
- MR > 0 where demand is elastic; MR = 0 at maximum TR; MR < 0 where inelastic.
- Normal profit = the minimum to stay in the industry; counted as a cost.
- Supernormal profit attracts entry unless barriers exist.
- Short-run shut-down: below AVC. Long-run: below ATC.
- Profit maximised where MC = MR, MC rising.
- Revenue maximisation: MR = 0. Sales maximisation: AR = ATC.
- Alternative objectives arise from the divorce of ownership from control and generally mean lower price and higher output.
Check you have it
Question 1
The diagram below shows the average revenue and marginal revenue (AR and MR) curves, and the average cost and marginal cost (AC and MC) curves, for the only firm in an industry. If the market is highly contestable, in the long run, the firm is most likely to set its price at
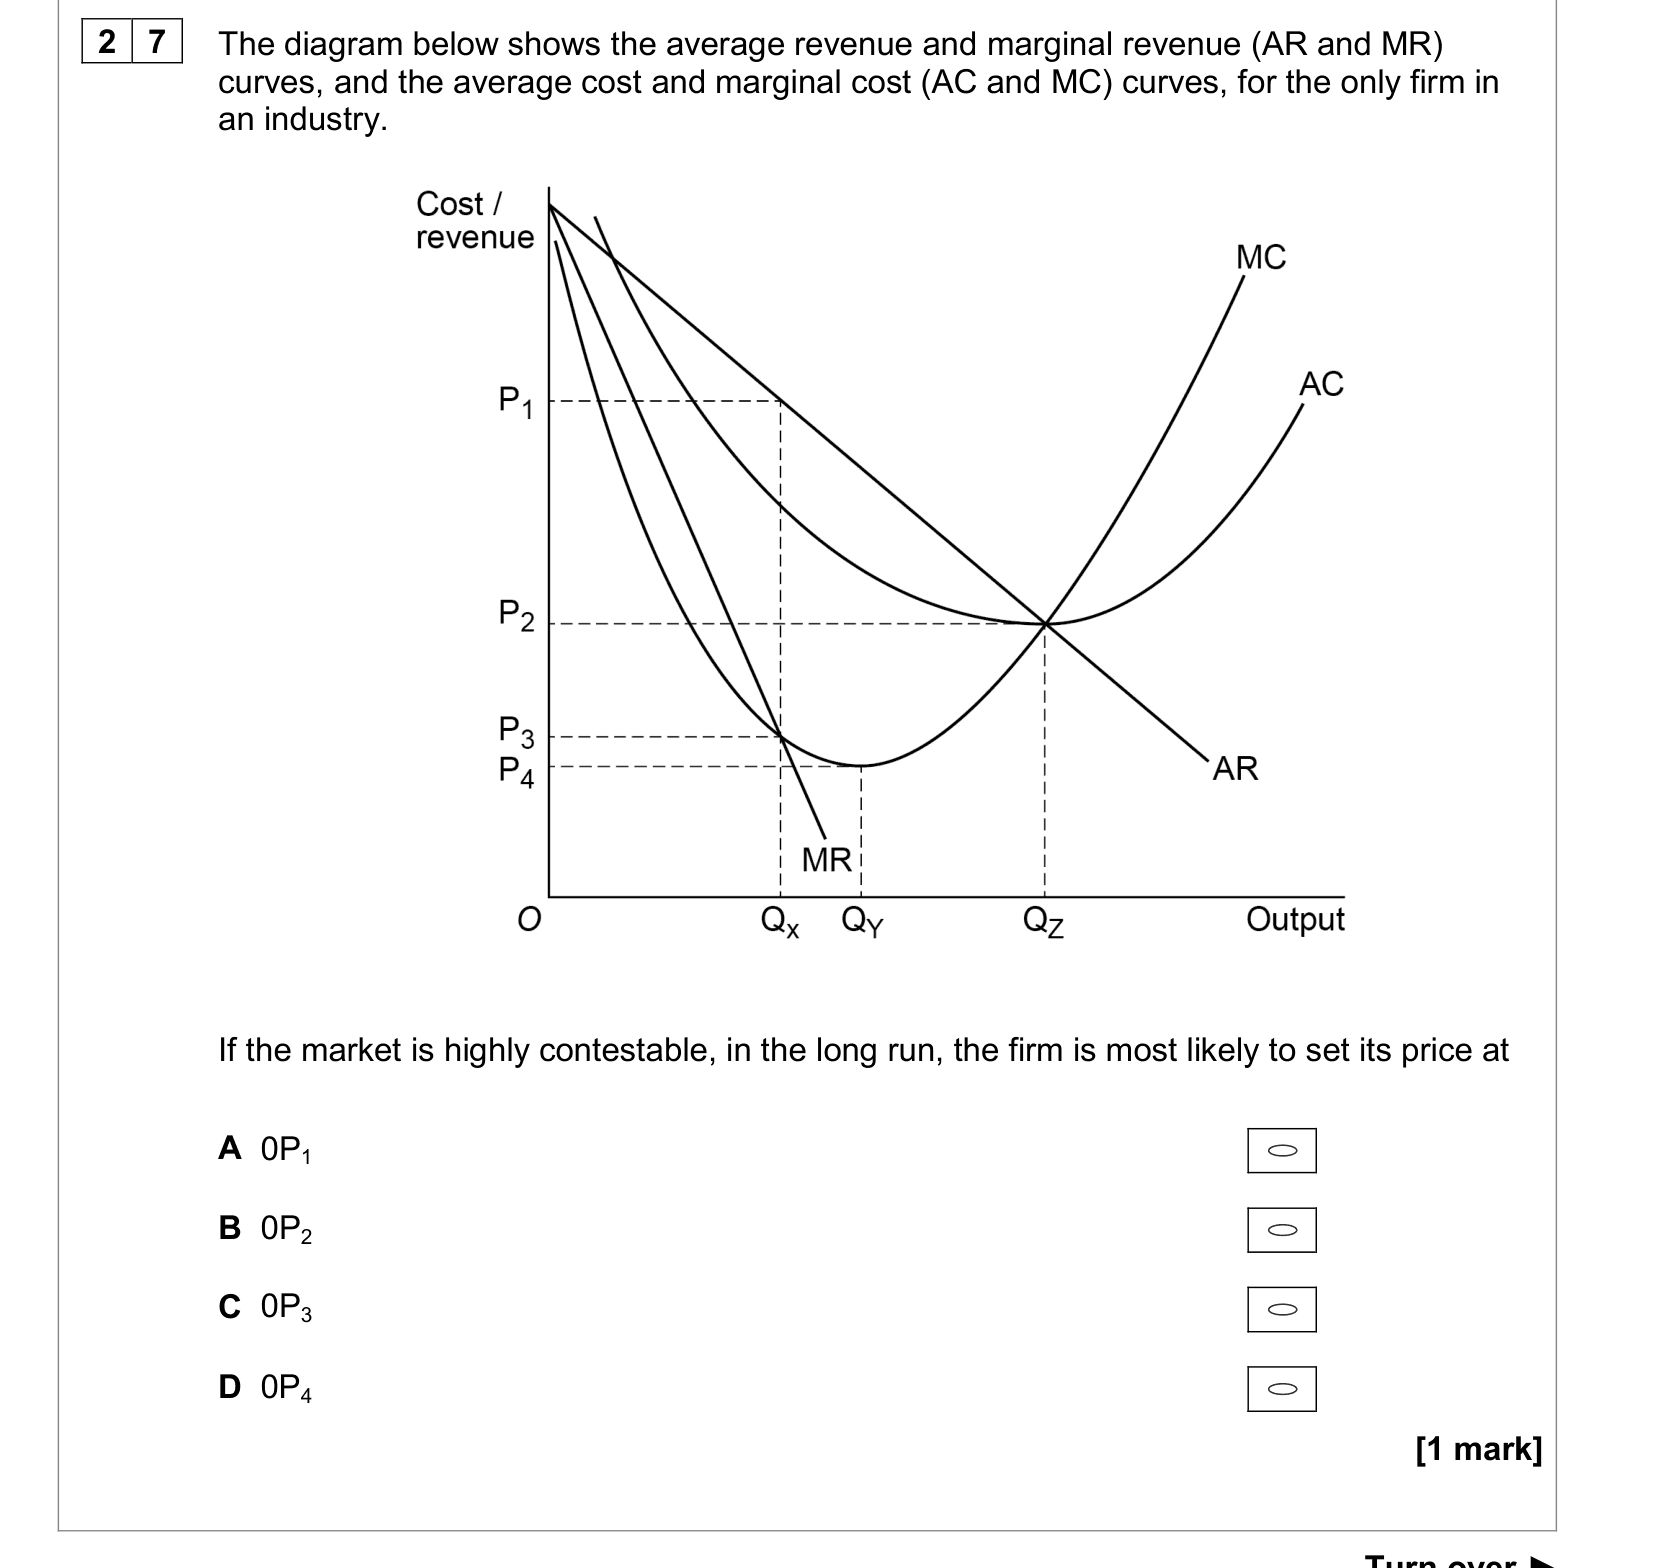
Answer: B.
Question 2
Table 7 shows how the number of workers employed by a profit-maximising firm affects its total output per hour and the price it is able to charge. 1 worker: 3 units at £5.00. 2 workers: 7 units at £4.50. 3 workers: 15 units at £4.20. 4 workers: 20 units at £4.10. 5 workers: 24 units at £4.00. The firm pays its workers £18 per hour. It has no other variable costs and its fixed costs are £3 per hour. How many workers will the firm employ?
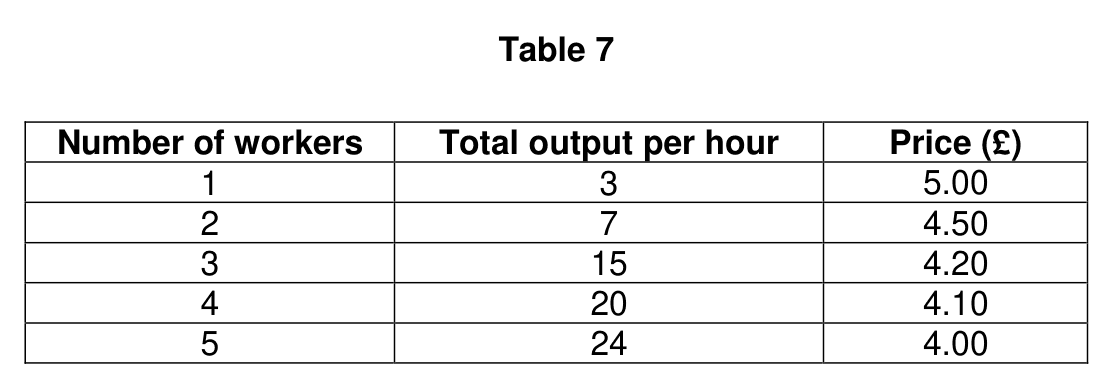
Answer: C.
Question 3
Figure 5 shows the average revenue ( AR ), marginal revenue ( MR ) and marginal cost ( MC ) curves for an industry which was perfectly competitive but is now a monopoly. The cost and revenue curves remain unchanged. Figure 5 Which of the following areas shows the total deadweight loss of consumer and producer surplus resulting from the structure of the industry changing from perfect competition to monopoly?
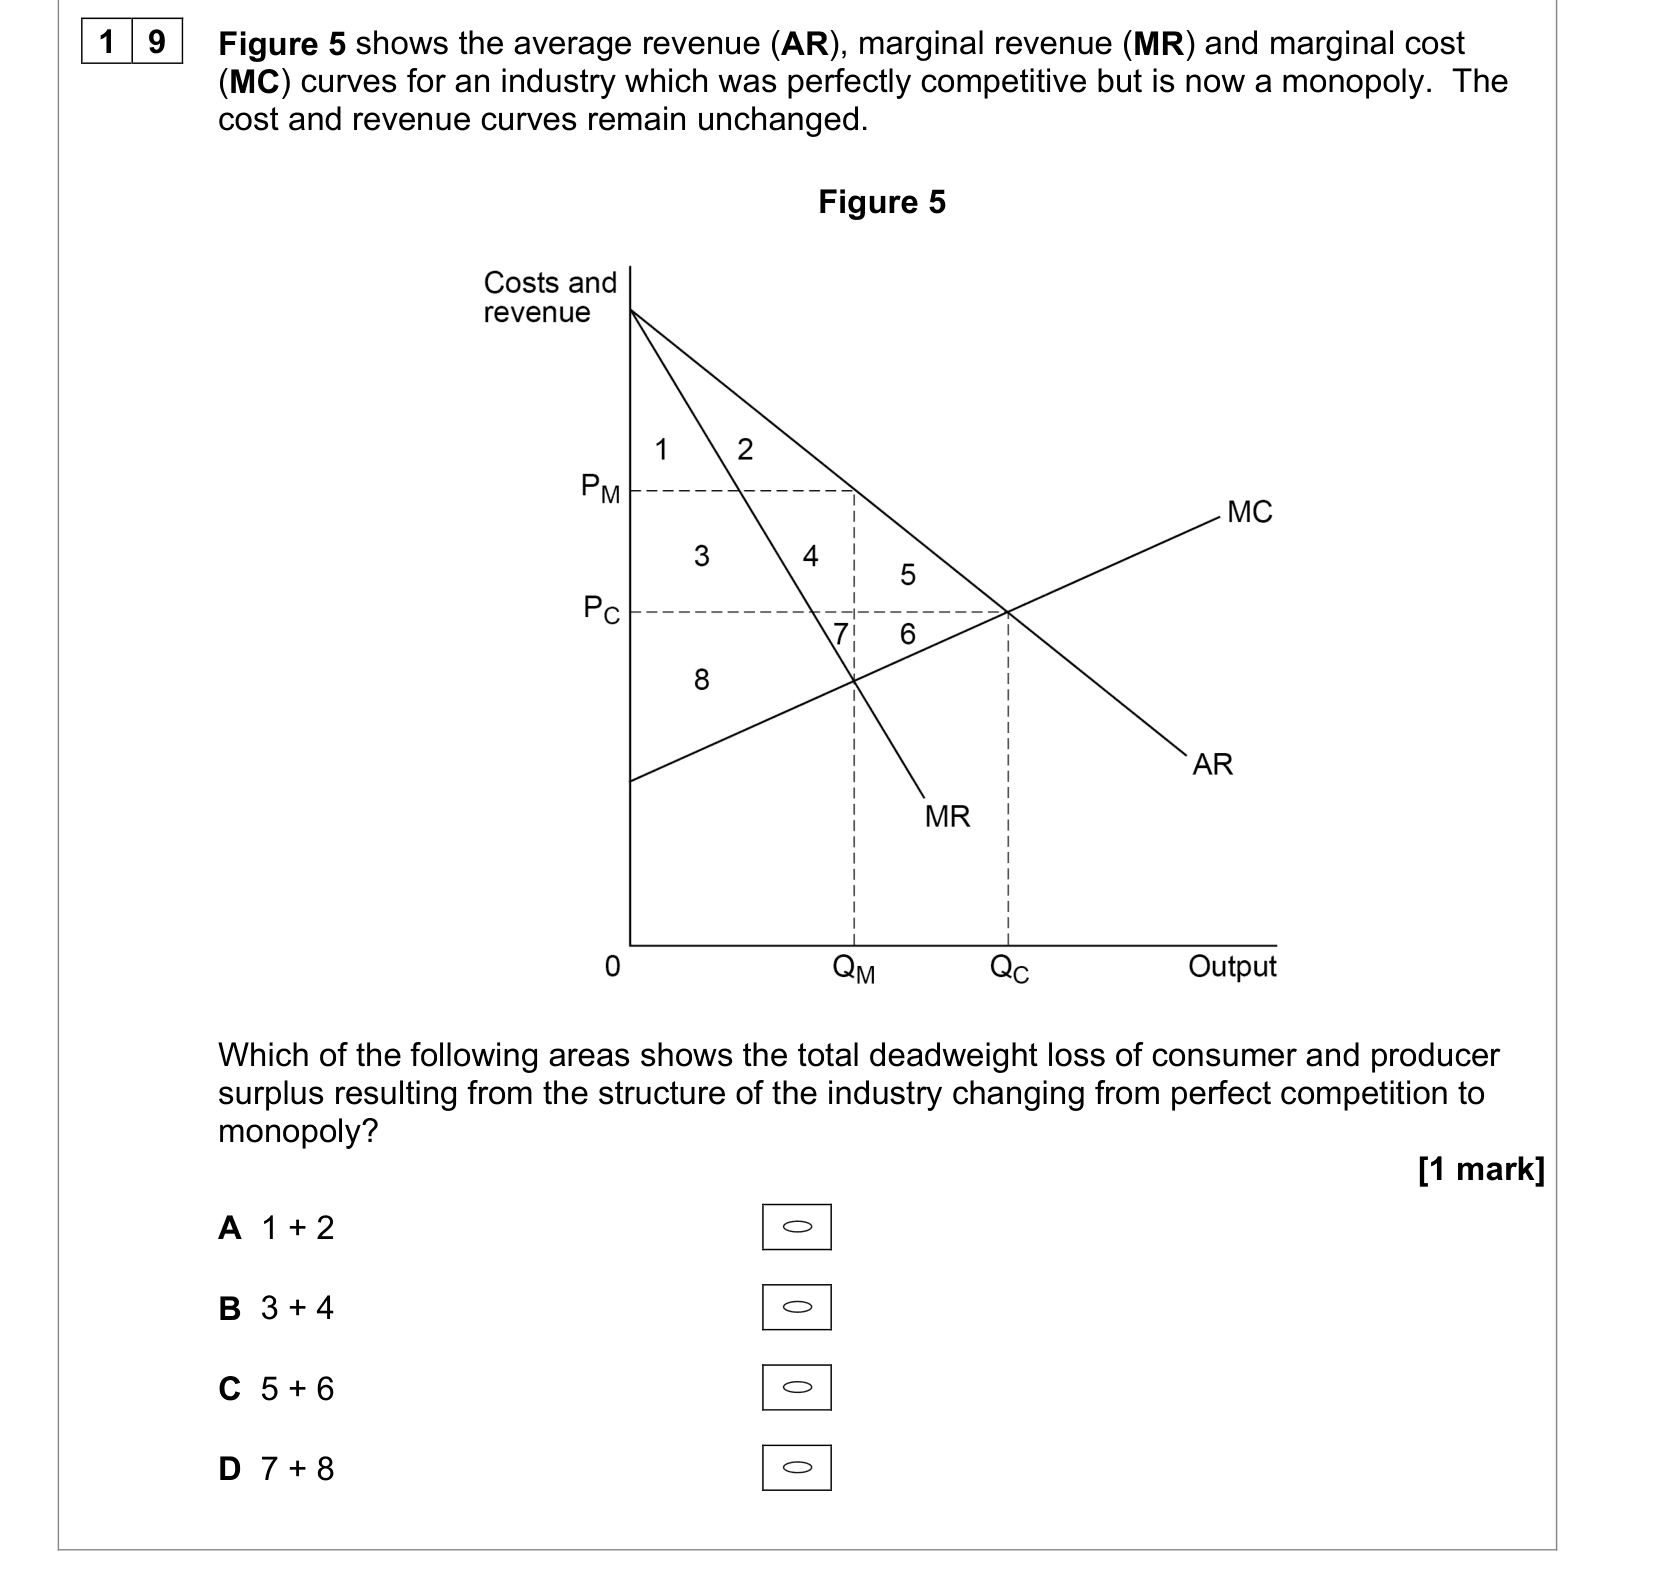
Answer: C.
Options A, B, and D are incorrect because they refer to areas representing either producer surplus gains or simple transfers from consumers to the monopolist. These areas redistribute existing wealth rather than representing the total "leakage" of welfare loss that defines the deadweight burden.
What the syllabus asks for on this topicSpecification points
Specification points
- Total, average and marginal revenue.
- Normal and supernormal profit; the objectives of firms.
- The profit-maximising rule and alternative objectives.
Related AQA A-Level topics
Not the topic you were looking for? Describe what you are stuck on in your own words and we will take you to the notes that answer it.