161 past-paper questions on this unit. Five of them are below. Answer on the page: each one is marked the moment you pick, the correct option is shown whether or not you found it, and the full explanation opens either way.
CIE 0625 PhysicsPaper 1 and Paper 2 MCQsFree account
Kinetic particle model of matter: five questions to try now
Real past-paper questions, the answer key from the mark scheme, and the explanation that goes with it. No account needed to answer them.
Question 1
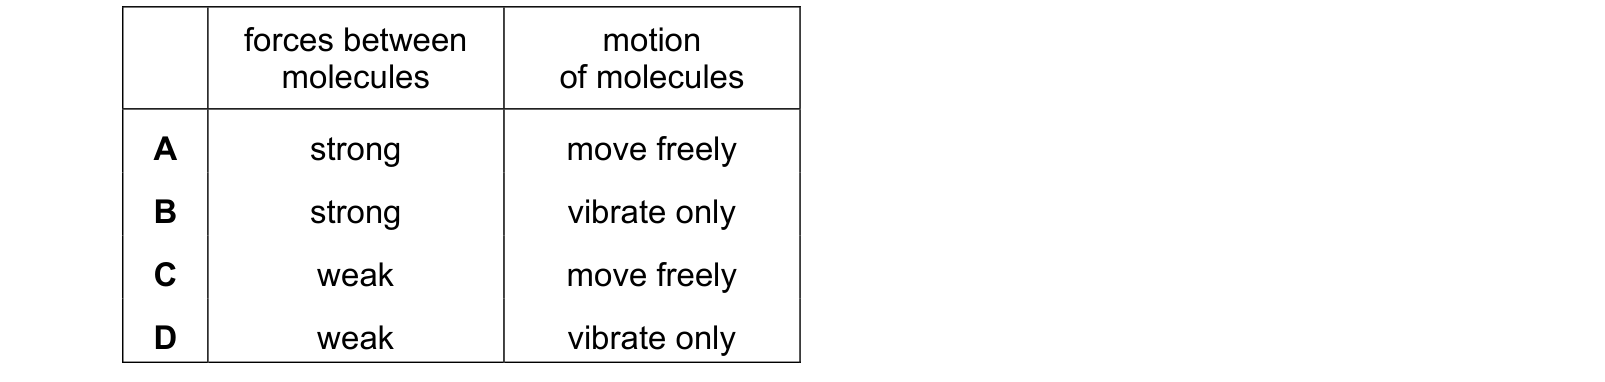
Which row describes the forces between the molecules and the motion of the molecules in a gas? Each answer gives, in order: forces between molecules; motion of molecules.
Answer: C.
In a gas the molecules are far apart, so the forces between them are weak enough to ignore and nothing holds any molecule in place. They therefore move freely in random directions at high speed, spreading out to fill whatever container they are in, which is row C. A and B call the forces strong, and strong forces would pull the gas together into a liquid or a solid with a fixed volume. B and D say the molecules only vibrate, which is the solid description where each particle is trapped in one spot. Weak forces plus free movement is exactly what lets a gas be compressed and lets it fill any space it is given.
Question 2
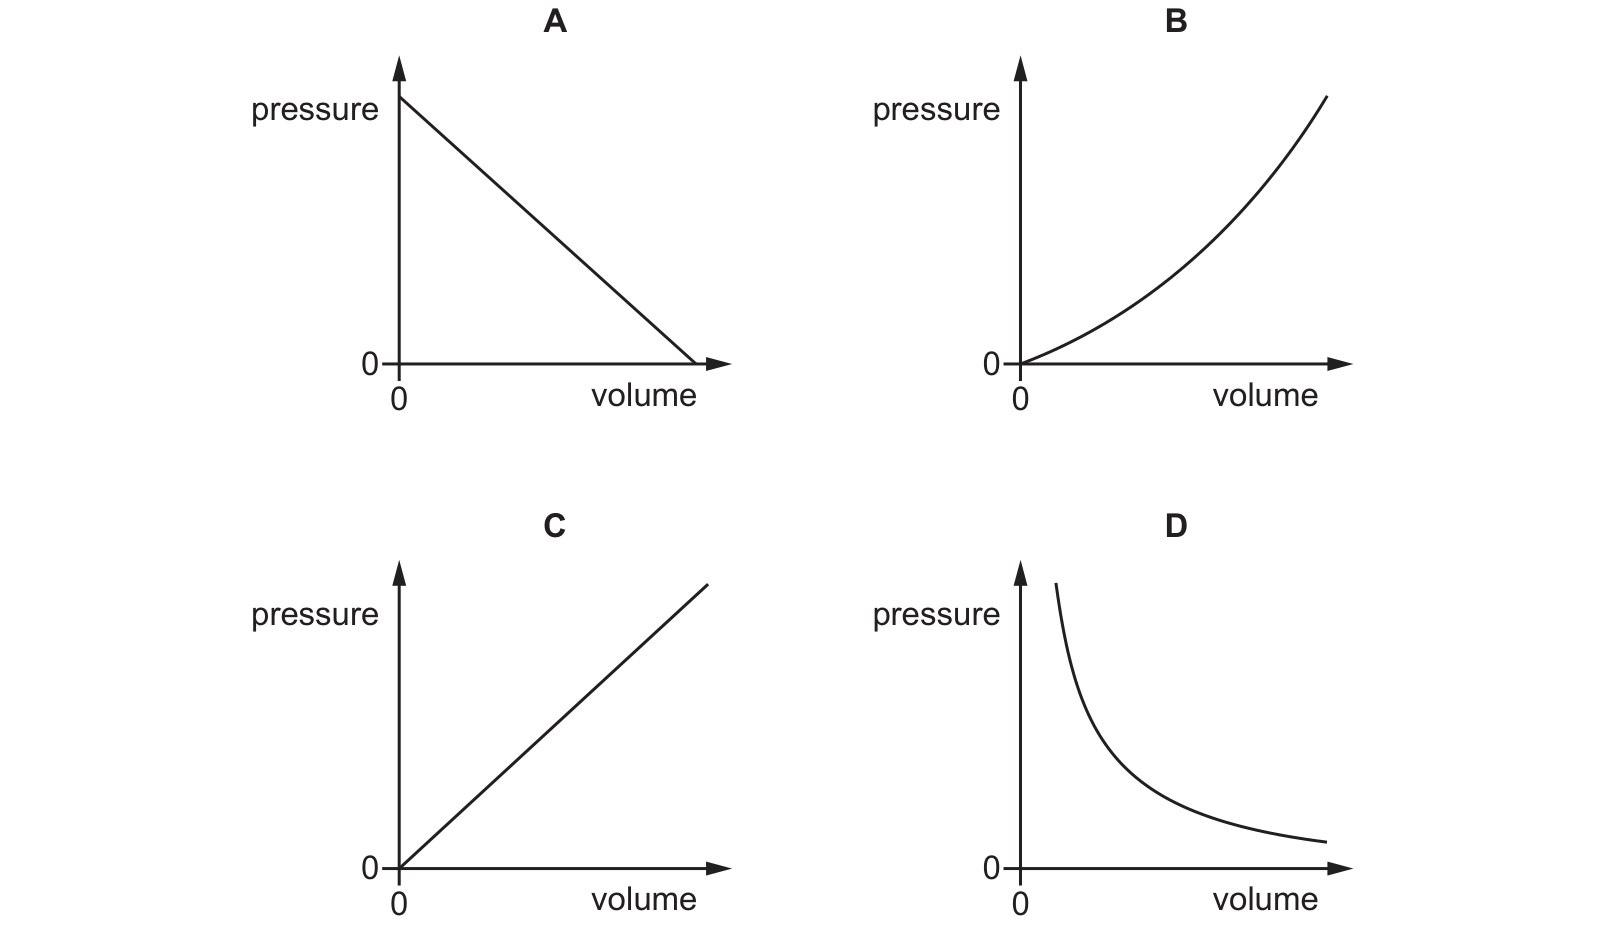
Which graph shows the relationship between the pressure and volume of a fixed mass of gas at constant temperature? Use the source image for S24 Paper 21, question 11.
Answer: D.
For a fixed mass of gas at constant temperature, Boyle's law gives pV = constant, so pressure and volume are inversely proportional and doubling the volume halves the pressure. Plotted as pressure against volume that inverse relation is a curve which falls steeply at first and then flattens out, never touching either axis, and that is graph D. C is a straight line through the origin, which would make pressure proportional to volume, so squeezing the gas would somehow reduce its pressure. B curves upward, the same error made worse. A slopes the right way but is straight and hits zero at a finite volume, whereas Boyle's law says the pressure keeps falling as the volume grows without ever reaching zero.
Question 3
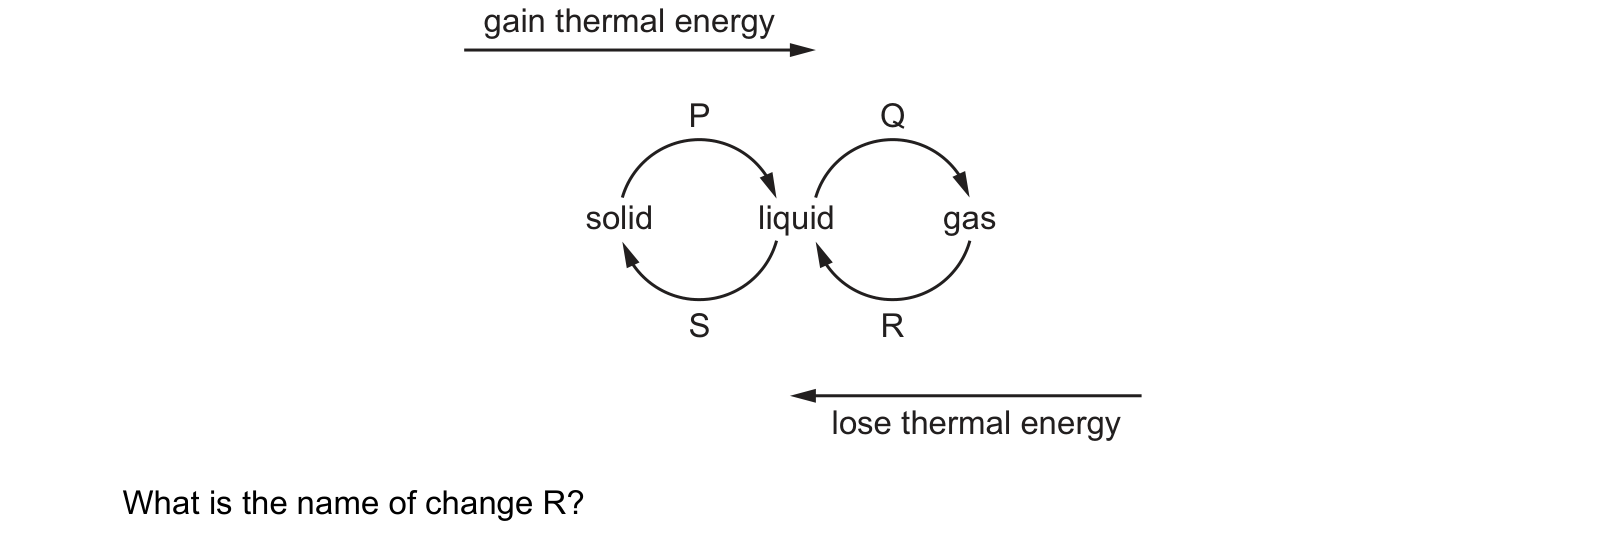
The diagram shows the changes of state P, Q, R and S that occur in solids, liquids and gases when they gain or lose thermal energy. What is the name of change R?
Answer: A.
In the diagram the upper arcs P and Q run left to right beneath the label gain thermal energy, and the lower arcs R and S run right to left beneath lose thermal energy. R is the lower arc between gas and liquid, so it points from gas back to liquid while energy is given out, and that change is condensation. Solidification is arrow S, the lower arc from liquid to solid, boiling is Q, the upper arc from liquid to gas, and melting is P, the upper arc from solid to liquid. Reading the arrowheads rather than guessing from where the letters sit is what settles this, since each pair of arcs joins the same two states but runs in opposite directions.
Question 4
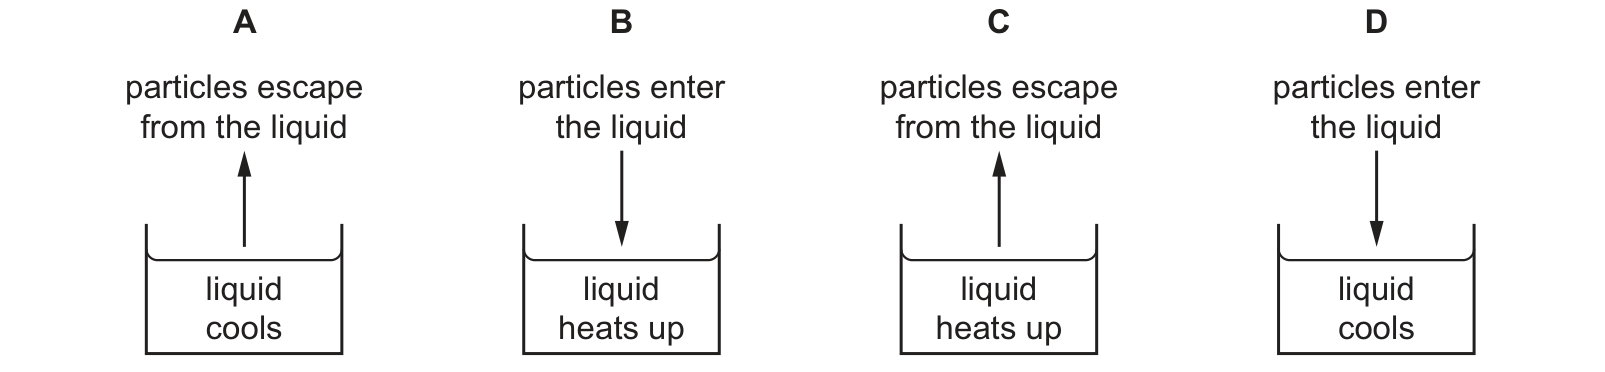
Which diagram shows the overall movement of particles and the temperature change when a liquid evaporates? Use the source image for W24 Paper 12, question 15.
Answer: A.
Each diagram pairs an arrow with a statement about the temperature. A shows the arrow pointing up out of the beaker, labelled particles escape from the liquid, with the liquid cooling. That is exactly what evaporation is: the fastest particles break away from the surface, leaving a slower average behind, and temperature measures that average, so the liquid gets colder. B and D both draw the arrow pointing down into the liquid, which is condensation rather than evaporation. C has the escape right but says the liquid heats up, which is backwards, since losing the fastest particles cannot raise the average energy of the ones that stay.
Question 5
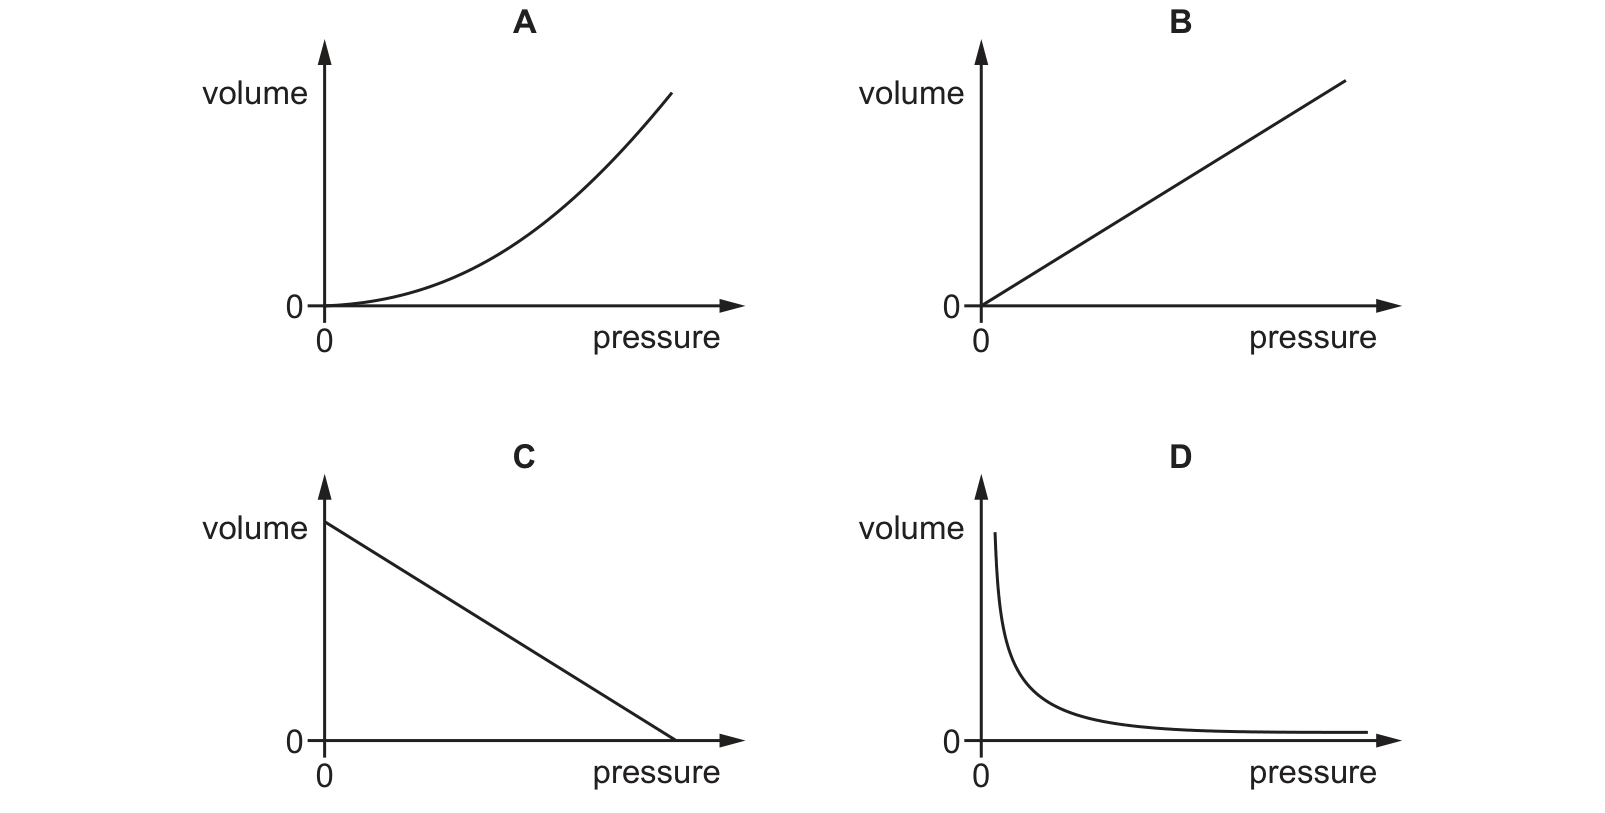
Which graph shows how the volume of a fixed mass of gas at constant temperature varies with its pressure? Use the source image for S24 Paper 22, question 11.
Answer: D.
Volume is on the vertical axis here and pressure on the horizontal, and Boyle's law for a fixed mass at constant temperature says pV = constant, so volume is inversely proportional to pressure. That plots as a curve dropping steeply at low pressure and then levelling off towards the axis without ever reaching it, which is graph D. B is a straight line through the origin, which would mean the harder you squeeze the more room the gas takes up. A curves upward, the same mistake exaggerated. C slopes downward so it has the right direction, but a straight line reaching zero volume at a finite pressure is not an inverse relation, since Boyle's law shrinks the volume without ever bringing it to zero.
These questions are drawn from past CIE 0625 Physics papers and filtered to kinetic particle model of matter. You answer, you find out immediately whether you were right, and you get the reasoning for the correct option and for each distractor. Wrong answers go to a mistakes locker so you can come back to exactly those.
Practice is free. You need an account only so your progress and your mistakes are still there next time.
These are the errors that cost marks on kinetic particle model of matter, taken from our own topic notes. Read them before you practise and you will recognise the traps in the questions.
Saying particles in a solid do not move; they vibrate about fixed positions.
Saying that cooling a sealed rigid container brings the particles closer together.
Saying the temperature rises while a substance is melting or boiling.
Confusing evaporation with boiling: evaporation happens at any temperature and only at the surface.
Explaining Brownian motion by saying the smoke particles collide with each other.
Saying the air molecules are visible under the microscope.
Forgetting to add 273 when converting to kelvin.
Explaining a pressure rise by saying the particles "expand"; particles do not change size.