Equity and Redistribution of Income and Wealth Exam Questions
46 past-paper questions on this unit. Five of them are below. Answer on the page: each one is marked the moment you pick, the correct option is shown whether or not you found it, and the full explanation opens either way.
CIE 9708Paper 3 MCQsFree account
Equity and Redistribution of Income and Wealth: five questions to try now
Real past-paper questions, the answer key from the mark scheme, and the explanation that goes with it. No account needed to answer them.
Question 1
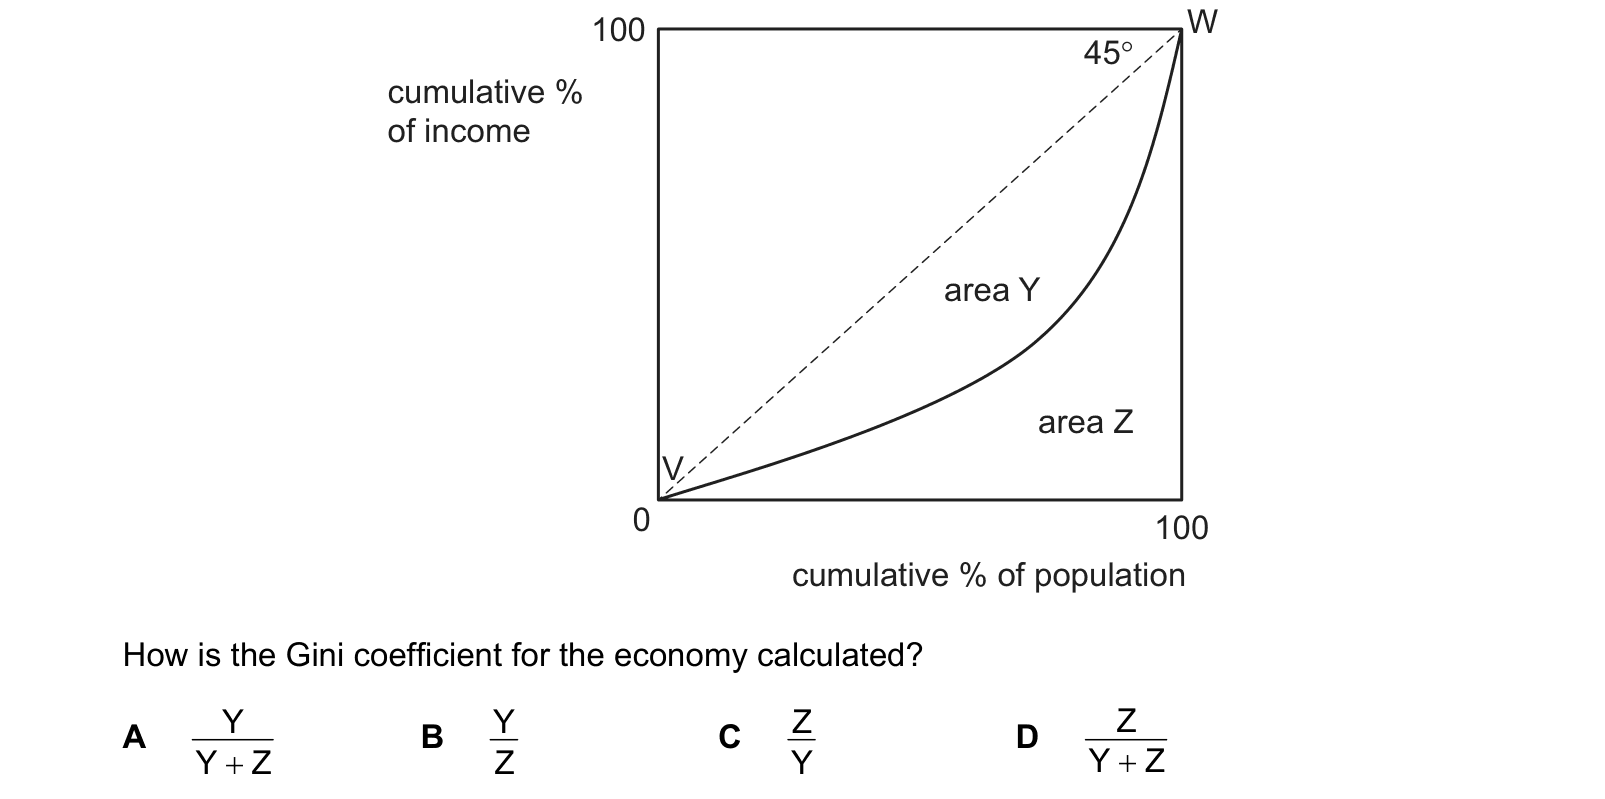
The diagram shows an economy’s Lorenz curve (VW). 0 100 100 W V area Y area Z cumulative % of population cumulative % of income 45° How is the Gini coefficient for the economy calculated?
Answer: A.
The Gini coefficient is a ratio of two areas on the Lorenz diagram, and the principle behind it is that inequality is measured as a fraction of the largest departure from equality that is possible. Area Y is the gap between the 45° line of perfect equality and the Lorenz curve, and area Z is everything lying beneath the curve, so Y plus Z is the whole triangle under the line of equality. Dividing the gap by that whole triangle, Y / (Y + Z), is what produces a figure of 0 when the Lorenz curve sits on the 45° line and one approaching 1 as the curve is pushed towards the corner. B divides the gap by area Z on its own, which has no upper bound: as inequality grows Z shrinks towards zero and the ratio runs away above 1, so it cannot be a coefficient scaled from 0 to 1. C is that same ratio inverted, and it moves the wrong way, falling as inequality rises. D measures the share of the triangle lying below the curve, which is one minus the Gini coefficient, so a perfectly equal economy would score 1 on it rather than 0. The published mark scheme for 9708/33 October/November 2018 gives A.
Question 2
The turning point on the Kuznets curve for income inequality has been estimated to be in the region of US$10 500. For a country that has a GDP per capita of $8000, what is most likely?
Answer: D.
The Kuznets curve is an inverted U: as GDP per capita grows from a low level, inequality first RISES, reaches a peak at the turning point, and only then begins to fall as the economy matures. This country is at $8000, which is below the estimated turning point of $10 500, so it is still on the upward-sloping part of the curve. Further growth in GDP per capita therefore takes it towards the peak and inequality is expected to widen, which is D. C is wrong because growth on this section of the curve has a clear predicted effect, not none. A and B both discuss a REDUCTION in GDP per capita, which is not the direction the curve is normally used to read; moving back down the rising section would be associated with less inequality rather than more, so B has the relationship inverted and A denies any relationship at all.
Question 3
To control the cost of living governments have sometimes imposed a maximum price on certain goods that is below the free market price. What is often an undesirable side effect of such policies?
Answer: D.
A maximum price set BELOW the free market price leaves quantity demanded higher than it was and quantity supplied lower, so the two no longer match and the gap is a shortage. That is the standard undesirable side effect, and it is why price ceilings are usually accompanied by queues, waiting lists or rationing. C describes what a price FLOOR does, since unsold stocks pile up when a price is held above the market level and supply exceeds demand. B has the profit effect backwards, because a lower price on each unit sold reduces producers' revenue and squeezes profit rather than lifting it above normal. A confuses one price with the general price level, as holding down the price of certain goods restrains a component of the index rather than accelerating inflation across the economy.
Question 4
Some workers in a low-paid job decide to work longer hours to increase their disposable income. However, this decision reduces state-provided benefits, leaving them worse off. What does this describe?
Answer: C.
The poverty trap is the situation where earning more brings little or nothing extra, because benefits are withdrawn as income rises and tax begins to be paid on the same earnings. Here the workers do more hours, lose state-provided benefits and end up worse off than before, which means the effective marginal tax rate on their extra earnings exceeds 100 per cent, and that is what makes it a trap rather than a disappointment. D is the closely related but distinct case, since the unemployment trap is about whether it is worth taking a job at all, and these workers already have one. A and B belong to different parts of the subject entirely: a debt trap is a household or country unable to escape its borrowing because interest absorbs its income, and a liquidity trap is a macroeconomic condition where interest rates are so low that monetary policy stops working.
Question 5
Some workers in a low-paid job decide to work longer hours to increase their disposable income. However, this decision reduces state-provided benefits, leaving them no better off. What does this describe?
Answer: C.
The poverty trap catches people who are already IN work: as they earn more, means-tested benefits are withdrawn and tax starts to be paid, so the extra earnings are clawed back almost pound for pound and the effective marginal tax rate approaches 100 per cent. That is exactly what happens here, with longer hours leaving these workers no better off than before. D is the neighbouring idea and worth keeping separate, because the unemployment trap concerns the decision to take a job at all, where someone out of work finds that wages would leave them little better off than benefits. A and B are from other topics: a debt trap is being unable to escape borrowing because interest consumes the income available, and a liquidity trap is a macroeconomic condition in which very low interest rates leave monetary policy without traction.
These questions are drawn from past CIE 9708 papers and filtered to equity and redistribution of income and wealth. You answer, you find out immediately whether you were right, and you get the reasoning for the correct option and for each distractor. Wrong answers go to a mistakes locker so you can come back to exactly those.
Practice is free. You need an account only so your progress and your mistakes are still there next time.
These are the errors that cost marks on equity and redistribution of income and wealth, taken from our own topic notes. Read them before you practise and you will recognise the traps in the questions.
Treating equity and equality as the same thing.
Confusing income with wealth, or a stock with a flow.
Reversing the Gini: saying a rising Gini means falling inequality.
Concluding from a rising Gini that the poor became absolutely poorer.
Classifying a tax as progressive from the amount paid rather than the average rate.
Asserting that a minimum wage always causes unemployment, with no reference to market structure.
Listing policies without analysing the mechanism or evaluating the trade-off.
Forgetting that relative poverty is unaffected by uniform growth.