Equity and Redistribution of Income and Wealth
Measuring Inequality and Evaluating Redistributive Policy
Contents: 10 sections
1. Why this topic matters
Topic 8.1 asked how a government corrects inefficiency. This topic asks a different question: even when a market allocates resources efficiently, is the resulting distribution acceptable?
The distinction is fundamental and it is the single most rewarded idea in this topic:
- Efficiency is about the size of the economic cake and whether it could be made larger.
- Equity is about how the cake is shared and whether that sharing is fair.
A perfectly competitive market can reach allocative efficiency while leaving some people with almost nothing, because a market allocates according to purchasing power rather than need. There is no contradiction. Efficiency is a positive concept that can be tested; equity is a normative concept that rests on a value judgement.
Examiners reward candidates who state that clearly, then analyse redistribution with the same rigour they would apply to a tax on pollution.
Keep three terms distinct:
- Equity means fairness. It is normative.
- Equality means sameness of outcome. It is measurable.
- Poverty means falling below a defined standard. It is measurable once the standard is chosen.
Equity does not require equality. Most people regard some inequality as fair if it reflects effort or risk. That sentence, properly developed, is worth marks in almost any essay on this topic.
2. Income and wealth
2.1 The difference
- Income is a flow. It is earnings received over a period: wages, rent, interest, profit, and transfer payments such as pensions or benefits.
- Wealth is a stock. It is the value of assets held at a point in time: property, shares, savings, pension entitlements, land.
Confusing the two is the most common error in this topic. A retired person may have low income and high wealth. A newly qualified professional may have high income and negative wealth because of student debt.
2.2 The relationship between them
The two reinforce each other. Wealth generates income through rent, interest and dividends, and income above consumption becomes saving, which accumulates into wealth.
This is why wealth is almost always distributed more unequally than income in any given country. A person with no assets earns no asset income, so the gap widens over time unless something interrupts it. That mechanism, rather than the bare observation, is what earns analysis marks.
3. Measuring inequality
3.1 The Lorenz curve
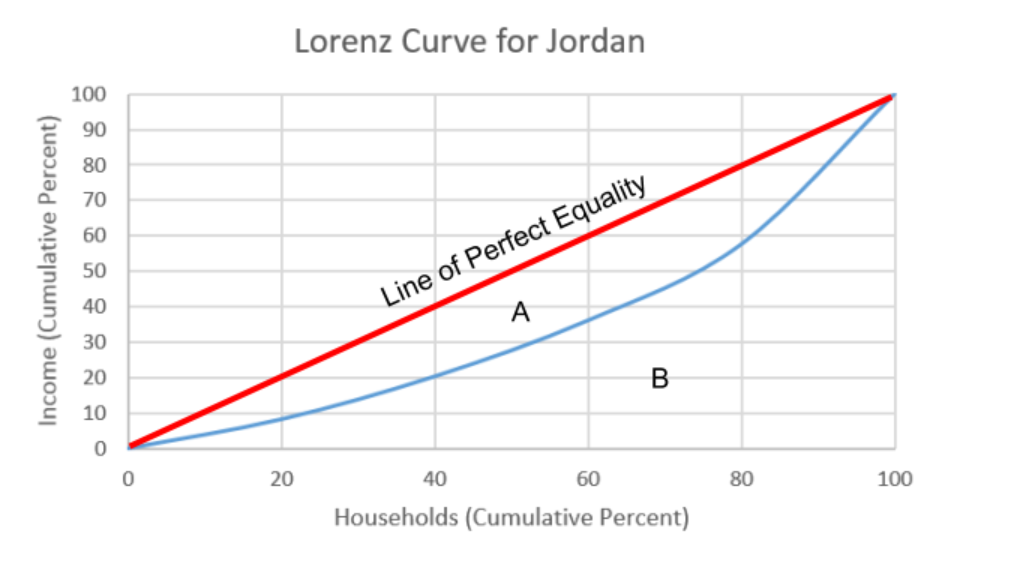
The Lorenz curve plots the cumulative percentage of total income received against the cumulative percentage of the population, ranked from poorest to richest.
- The horizontal axis runs from 0 to 100 per cent of households.
- The vertical axis runs from 0 to 100 per cent of income.
- The line of absolute equality is the 45 degree diagonal, where the poorest 20 per cent receive exactly 20 per cent of income.
The actual Lorenz curve lies below the diagonal. The further it sags away from the diagonal, the more unequal the distribution.
Reading it precisely matters. If the curve passes through the point (40, 15), the poorest 40 per cent of households receive 15 per cent of total income.
3.2 The Gini coefficient
The Gini coefficient converts the picture into one number.
Gini equals area A divided by the sum of areas A and B, where A is the area between the diagonal and the Lorenz curve, and B is the area beneath the Lorenz curve.
- A value of 0 means perfect equality: the curve lies on the diagonal, so A is zero.
- A value of 1 means perfect inequality: one household holds all income.
- Values are often quoted as a percentage, so 0.34 becomes 34.
A rising Gini means inequality is increasing. A falling Gini means it is decreasing. Students frequently reverse this, so state it explicitly when using data.
3.3 Worked interpretation
Suppose a country's Gini rises from 0.31 to 0.38 over a decade while real GDP per head also rises.
The correct reading is that average incomes grew but the gains were distributed less evenly than before. It is entirely possible for everyone to be better off in absolute terms while the Gini rises, because the Gini measures relative shares. Saying "the poor got poorer" is not supported by that data alone, and asserting it loses marks.
3.4 Limitations of these measures
- The Gini reduces a whole distribution to one number, so two very different distributions can share a Gini.
- It says nothing about where in the distribution the inequality sits: a Gini can rise because the top pulls away or because the bottom falls behind, and the appropriate policy differs.
- Figures are usually pre-tax and pre-benefit unless stated, so they may overstate inequality of living standards.
- They ignore the informal economy, which is large in many developing countries.
- Household measures ignore distribution within a household.
4. Measuring poverty
4.1 Absolute poverty
Absolute poverty exists where income is insufficient to afford the basic necessities of life: food, shelter, clothing, clean water, basic healthcare. It is measured against a fixed real standard, for example an international line expressed in purchasing power parity dollars per day.
Because the standard is fixed in real terms, absolute poverty can in principle be eliminated, and economic growth alone can reduce it.
4.2 Relative poverty
Relative poverty exists where income falls below a proportion of the national average or median, commonly 60 per cent of median income. It measures exclusion from the normal standard of living in that society.
Because the standard moves with the average, relative poverty cannot be eliminated by growth alone. If every income doubled, absolute poverty would fall sharply and relative poverty would be unchanged. That single sentence is a reliable evaluation point.
4.3 The poverty trap
The poverty trap occurs where a person on a low income gains little or nothing from increasing their earnings, because as earnings rise, means-tested benefits are withdrawn and income tax and social contributions begin.
The marginal deduction rate is the proportion of each extra unit of earnings lost to withdrawn benefits and additional tax.
Worked example. A worker earns an extra $100 per week.
- Income tax and contributions take $32.
- Means-tested benefit is withdrawn at 55 cents per dollar earned, removing $55.
- Net gain: $100 minus $32 minus $55 equals $13.
- Marginal deduction rate: 87 per cent.
At that rate the incentive to work additional hours is very weak. The trap is a genuine efficiency cost of redistribution, and naming the mechanism is far stronger than asserting that "benefits reduce incentives".
5. Causes of inequality
Analysis marks come from mechanisms, so learn the causes as chains rather than as a list.
- Differences in human capital. Education and training raise marginal revenue product, so they raise the demand for that worker's labour and therefore the wage.
- Differences in innate ability and talent. Where supply of a talent is very inelastic, high demand produces very high earnings, as in elite sport.
- Wealth ownership. Asset income accrues to those already holding assets, and inheritance transmits it across generations.
- Unemployment. Loss of earned income is the single largest cause of household poverty in many economies.
- Discrimination. Where groups face barriers, their labour supply is confined into fewer occupations, depressing wages there.
- Market power in the labour market. A monopsony employer can set a wage below the competitive level.
- Regressive taxation and the structure of benefits.
- Globalisation and technological change. Demand shifts towards skilled labour and away from routine work, widening the skill premium.
6. Policies to redistribute income and wealth
6.1 Progressive taxation
A tax is progressive where the average rate of tax rises as income rises, proportional where it stays constant, and regressive where it falls as income rises.
Note carefully: what matters is the average rate, not the marginal rate, and not the absolute amount paid.
Worked classification. A sales tax of 10 per cent is levied on all goods. A household earning $20,000 spends all of it and pays $2,000, an average rate of 10 per cent of income. A household earning $200,000 spends $120,000 and pays $12,000, an average rate of 6 per cent of income. The tax is therefore regressive with respect to income even though the rate is identical, because the propensity to consume falls as income rises.
That example is worth memorising, because indirect taxes are regressive by this reasoning almost every time they appear.
Evaluation of progressive income tax:
- reduces post-tax inequality directly and raises revenue for transfers;
- but high marginal rates may weaken work incentives, encourage avoidance and evasion, and prompt emigration of high earners;
- and the revenue effect is uncertain, which is the idea behind the Laffer curve: beyond some rate, higher rates reduce revenue.
6.2 Transfer payments
Transfers are payments made without any good or service in return: unemployment benefit. State pensions, child allowances, disability payments.
- Universal benefits go to everyone in a category. They are simple, carry no stigma and achieve high take-up, but they are expensive and pay people who do not need them.
- Means-tested benefits go only to those below an income threshold. They target resources efficiently, but they create the poverty trap, carry administrative cost and often suffer low take-up because of complexity or stigma.
That trade-off between targeting and incentives is the core evaluation of this section.
6.3 State provision of essential services
Free or subsidised healthcare, education and housing raise the real income of the poor even where money income is unchanged, because they remove costs the household would otherwise bear. Education also raises future earning capacity, so it addresses a cause rather than a symptom.
Evaluation: the effect on earnings is slow, quality may vary by area, and universal free provision benefits the middle and upper income groups too, which dilutes the redistributive effect.
6.4 Minimum wages
A national minimum wage is a price floor in the labour market, set above the equilibrium wage.
In a competitive labour market the standard analysis predicts that quantity of labour demanded falls and quantity supplied rises, creating excess supply, which is unemployment. Those who keep their jobs gain; those who lose them do not.
However, in a monopsony labour market, where a single dominant employer faces an upward sloping labour supply curve, a minimum wage can raise both the wage and employment, because it removes the employer's ability to restrict hiring in order to hold the wage down. Knowing that this result depends on market structure is exactly the sort of conditional judgement that separates high marks from middling ones.
6.5 Inheritance and wealth taxes
Taxes on inherited wealth and on property target the stock rather than the flow, and therefore address the mechanism by which inequality persists across generations.
Evaluation: wealth is easier to move or restructure than income, valuation of illiquid assets is contested, and such taxes often raise modest revenue relative to the political difficulty.
6.6 Policies to promote inclusive growth
Inclusive growth policies aim to raise the earning power of those at the bottom rather than transfer income to them: training schemes, apprenticeships, childcare provision that enables labour force participation, regional investment, and microfinance in developing economies.
These address causes and avoid the poverty trap, but they act slowly and their success depends on demand for labour existing in the first place.
7. The equity and efficiency trade-off
7.1 The standard argument
Redistribution may reduce efficiency because:
- high marginal tax rates reduce the incentive to work, save and take entrepreneurial risk;
- benefit withdrawal creates the poverty trap; and
- taxes create a deadweight loss by driving a wedge between the price paid and the price received.
7.2 The counter-argument
Redistribution may raise efficiency because:
- the poor have a higher marginal propensity to consume, so transfers raise aggregate demand more than the same sum left with high earners;
- credit constraints stop poor households investing in education, so redistribution corrects a capital market failure and raises human capital;
- extreme inequality is associated with social and political instability, which deters investment; and
- healthier, better educated workers are more productive.
A good essay presents both and reaches a judgement conditional on the level of inequality, the design of the policy and the stage of development. The trade-off is real but not fixed, and its severity depends on how the policy is constructed rather than on redistribution as such.
8. Integrated analysis and common traps
8.1 A complete chain
Suppose a government replaces a universal child benefit with a means-tested one at a 55 per cent withdrawal rate. Targeting improves, so for a given budget more resource reaches the poorest, and measured poverty falls. But the marginal deduction rate for low earners rises, weakening the incentive to increase hours, and take-up falls because of complexity. The net effect on poverty therefore depends on whether the targeting gain exceeds the participation loss, which depends on the withdrawal rate chosen and on how responsive labour supply is.
That is what an evaluated answer looks like: mechanism, counter-mechanism, and a judgement resting on a stated condition.
8.2 Common examination errors
- Treating equity and equality as the same thing.
- Confusing income with wealth, or a stock with a flow.
- Reversing the Gini: saying a rising Gini means falling inequality.
- Concluding from a rising Gini that the poor became absolutely poorer.
- Classifying a tax as progressive from the amount paid rather than the average rate.
- Asserting that a minimum wage always causes unemployment, with no reference to market structure.
- Listing policies without analysing the mechanism or evaluating the trade-off.
- Forgetting that relative poverty is unaffected by uniform growth.
9. Paper 3 and Paper 4 mastery
Paper 3 regularly tests: reading a point off a Lorenz curve, the direction of a Gini change, classifying a tax as progressive or regressive from average rates, and calculating a marginal deduction rate.
Paper 4 essays almost always require the equity and efficiency trade-off. Structure them by policy, giving each policy a mechanism, an effect on inequality, and a cost, then conclude by comparing rather than summarising.
Where data is supplied, use it. Quote the Gini or the share of the bottom quintile and interpret it, rather than describing the trend in words alone.
Check you have it
Question 1
A government is committed to reducing the Gini coefficient. Which policy is most likely to fail to achieve that policy objective?
Answer: B.
Question 2
What would help to explain why there was a reduction in wage inequality in a country during the post-2008 economic recession?
Answer: C.
Question 3
Which government policy is not aimed at correcting inefficiency in resource allocation?
Answer: C.
10. Final checklist
A fully prepared learner can:
- distinguish equity from equality and explain why equity is a normative concept;
- distinguish income from wealth as a flow and a stock, and explain why wealth is more unequally held;
- draw and read a Lorenz curve, including interpreting a specific coordinate;
- define the Gini coefficient in terms of areas and state the direction of change correctly;
- state at least four limitations of these measures;
- distinguish absolute from relative poverty and explain why growth alone cannot remove relative poverty;
- define the poverty trap and calculate a marginal deduction rate;
- explain at least six causes of inequality as mechanisms rather than as a list;
- classify a tax as progressive, proportional or regressive using average rates, including the sales tax case;
- compare universal and means-tested benefits on targeting, incentives and take-up;
- explain why a minimum wage may raise employment under monopsony; and
- argue both directions of the equity and efficiency trade-off and reach a conditional judgement.

Related CIE 9708 topics
Not the topic you were looking for? Describe what you are stuck on in your own words and we will take you to the notes that answer it.