Different Market Structures
Different Market Structures
Contents: 20 sections
1. Why this topic matters
Market structure influences how much control a firm has over price, how easily rivals can enter, what demand curve the firm faces, whether supernormal profit can persist and how efficiently resources are used. The models are not boxes into which every real industry fits perfectly. They are analytical benchmarks.
The core discipline is to separate three stages:
- Structure: the conditions in the market: number and size of firms, product differentiation, entry and exit, and information.
- Conduct: how firms behave: output choice, pricing, advertising, innovation, collusion and strategic responses.
- Performance: the resulting price, output, profit, efficiency, quality and consumer welfare.
A market with one large firm is not automatically uncompetitive. A market with many firms is not automatically competitive. Potential entry, sunk costs, product differentiation, buyer power, regulation and access to information can all alter behaviour.
2. The market-structure spectrum
2.1 Market structure
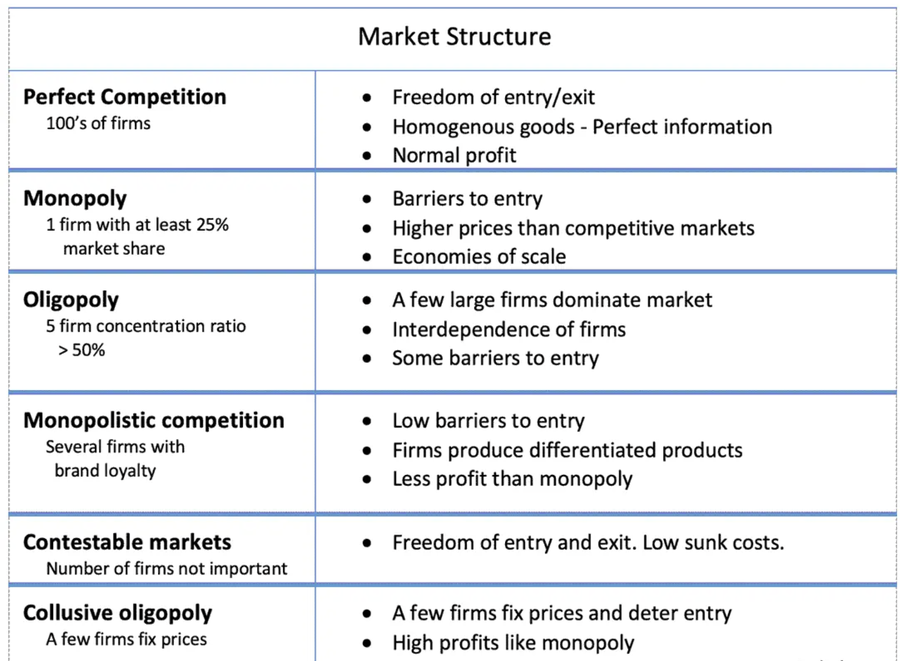
A market structure describes the competitive conditions in a market. Cambridge requires comparison using:
- the number of buyers and sellers;
- product differentiation;
- the degree of freedom of entry and exit; and
- the availability of information.
Additional useful indicators include market concentration, economies of scale, sunk costs and the extent of strategic interdependence.
2.2 Perfect and imperfect competition
Perfect competition is the benchmark model with many buyers and sellers, a homogeneous product, free entry and exit, and complete information. Each firm is a price taker.
Imperfect competition covers markets in which at least one condition of perfect competition is absent. Cambridge names:
- monopoly;
- monopolistic competition;
- oligopoly; and
- natural monopoly.
Imperfect competition normally gives firms some market power, but the degree varies. A monopolistically competitive firm may have only limited power because many close substitutes exist. A monopoly may have substantial power if barriers are high and demand is inelastic.
2.3 Structure comparison
| Feature | Perfect competition | Monopolistic competition | Oligopoly | Monopoly |
|---|---|---|---|---|
| Sellers | Very many | Many | Few dominant firms | One firm in the theoretical model |
| Product | Homogeneous | Differentiated | Homogeneous or differentiated | No close substitute in the defined market |
| Entry/exit | Free | Relatively free | Significant barriers | High barriers |
| Information | Complete in the model | Imperfect but often widely available | Often imperfect and strategic | May be imperfect |
| Firm demand | Perfectly elastic at market price | Downward sloping, relatively elastic | Downward sloping but rival-dependent | Market demand, downward sloping |
| Strategic interdependence | Negligible | Limited | Central | No direct rival inside the market definition |
These are model predictions, not descriptions that must hold exactly in every observed market.
3. Revenue curves and the profit-maximising rule
3.1 Demand and average revenue
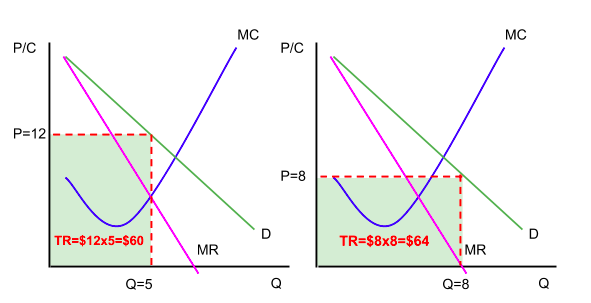
For a firm, the demand curve is also its average revenue (AR) curve because:
AR = TR / Q = P
Total revenue is the price multiplied by the quantity, which is the rectangle under the demand curve at the chosen output. Moving along a downward-sloping demand curve changes both, so total revenue can rise or fall depending on which effect is larger.
3.2 Perfect competition
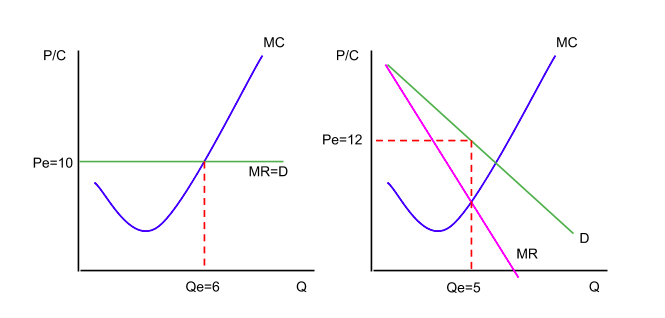
A perfectly competitive firm can sell any feasible quantity at the market price but nothing at a higher price. Its firm-level demand curve is horizontal:
P = AR = MR
The market demand curve is still downward sloping. Do not confuse the horizontal demand curve facing one firm with the demand curve for the whole industry.
3.3 Imperfect competition
A price-making firm faces a downward-sloping AR curve. To sell more, it normally has to reduce price. For a single-price firm, the price cut applies to previous units as well as the extra unit, so:
MR lies below AR
The firm chooses the profit-maximising output where MC = MR, provided MC is rising through MR. It then reads the price from the AR curve at that output.
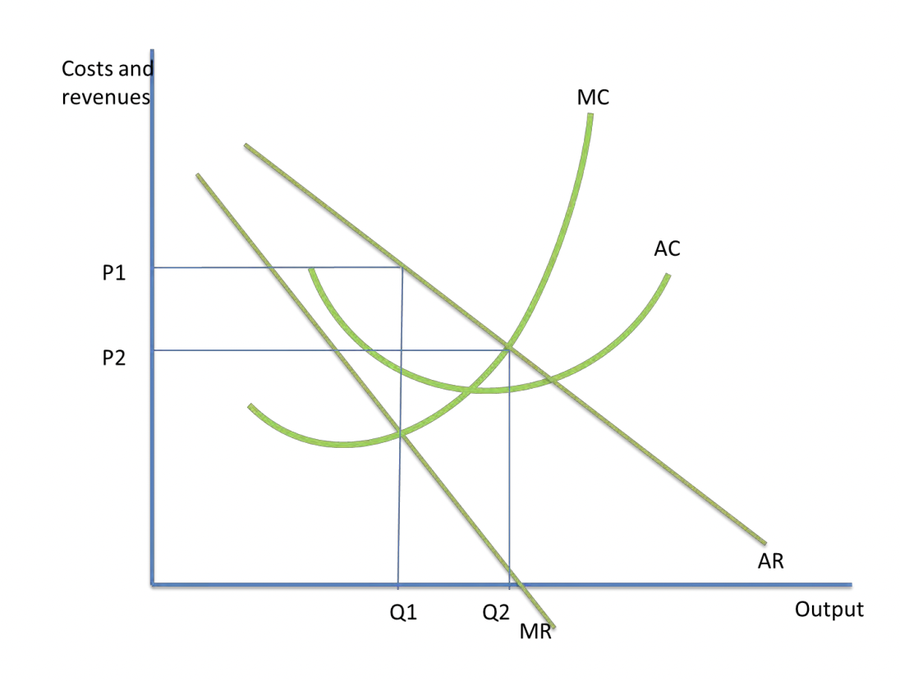
MC = MR identifies the output, not the price. Using the MR intersection as the selling price is a common exam error.
4. Perfect competition
4.1 Assumptions
Perfect competition assumes:
- many small firms and buyers;
- a homogeneous product;
- complete information;
- free entry and exit;
- no individual firm able to influence market price; and
- firms seeking to maximise profit.
The model is valuable mainly as a benchmark. Real markets may approach some conditions without satisfying all of them.
4.2 Firm and industry
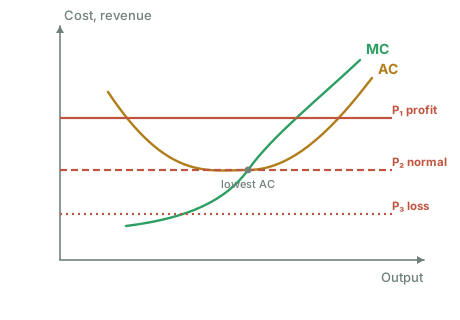
The industry determines the market price through market demand and market supply. Each individual firm takes that price as given. The firm produces where:
MC = MR = P, subject to the shutdown rule.
4.3 Short-run profit positions
In the short run, a competitive firm can make:
- supernormal profit if P > ATC at the profit-maximising output. Cambridge also calls this abnormal profit, and papers use the two names interchangeably, so treat them as the same thing;
- normal profit if P = ATC;
- subnormal profit if AVC ≤ P < ATC; or
- shut down if P < AVC at every positive output.
A firm making a short-run loss may continue because revenue covers all variable costs and contributes something towards fixed costs.
4.4 Long-run adjustment
If firms earn supernormal profit, entry increases market supply and pushes market price down. If firms make persistent losses, exit reduces market supply and pushes price up. Under the standard assumptions, long-run equilibrium occurs where the representative firm earns normal profit.
For identical firms in long-run competitive equilibrium:
P = MR = MC = minimum ATC
This gives:
- allocative efficiency because P = MC; and
- productive efficiency because output is produced at minimum ATC.
The conclusion depends on the model assumptions. Externalities, imperfect information or heterogeneous costs can prevent the private-market outcome from being socially efficient.
5. Shutdown, exit and the competitive firm’s supply curve
5.1 Short-run shutdown
The firm compares revenue with avoidable variable cost.
- If P > AVC, production contributes towards fixed cost.
- If P = minimum AVC, the firm is at the short-run shutdown price and is indifferent between producing at the relevant output and shutting down.
- If P < minimum AVC, the firm should shut down in the short run because producing adds more to variable cost than to revenue.
Shutting down means producing zero temporarily. It does not necessarily mean leaving the industry permanently.
5.2 Long-run exit
In the long run all costs are avoidable. The firm must cover total economic cost, including normal profit.
- The long-run break-even or exit threshold is minimum ATC in the standard model.
- If expected price remains below minimum ATC, the firm exits.
- If price equals minimum ATC, it earns normal profit and can remain.
It is clearer to call minimum AVC the short-run shutdown price and minimum ATC the long-run break-even/exit price.
5.3 Deriving supply
For each possible market price, a competitive firm chooses the output where P = MC, provided price is at least minimum AVC. Therefore:
- the firm's short-run supply curve is the rising part of MC above minimum AVC;
- the firm's long-run supply response is associated with MC above the long-run break-even condition, while industry entry and exit also change the number of firms.
The whole MC curve is not the short-run supply curve because the segment below minimum AVC would tell the firm to produce when shutdown is cheaper.
6. Monopolistic competition
6.1 Structure
Monopolistic competition combines:
- many firms;
- product differentiation;
- relatively low barriers to entry and exit; and
- some information imperfections.
Examples may include local restaurants, salons or specialised retailers, but the classification depends on the market definition.
6.2 Firm demand
Each firm faces a downward-sloping demand/AR curve because its product is differentiated. Demand is often relatively elastic because many substitutes exist. Successful branding may shift demand right or reduce its elasticity.
6.3 Short run
The firm chooses MC = MR and can earn supernormal, normal or subnormal profit. Product differentiation does not guarantee profit.
6.4 Long run
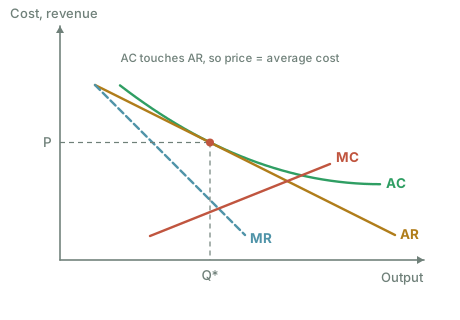
Supernormal profit attracts entry. New substitutes reduce the demand facing each incumbent firm until normal profit remains in the standard long-run model. The long-run AR curve is tangent to ATC at the output where MC = MR.
Long-run monopolistic competition is normally:
- not productively efficient, because output is below the output at minimum ATC, creating excess capacity;
- not allocatively efficient, because P > MC; but
- potentially beneficial through variety, convenience, service and innovation.
Product differentiation may raise costs, but consumers may value the extra choice. Efficiency evaluation should not treat all differentiation or advertising as waste.
7. Monopoly
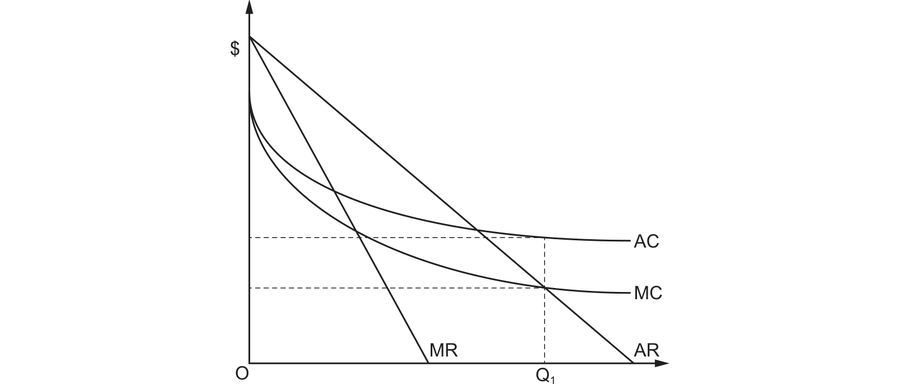
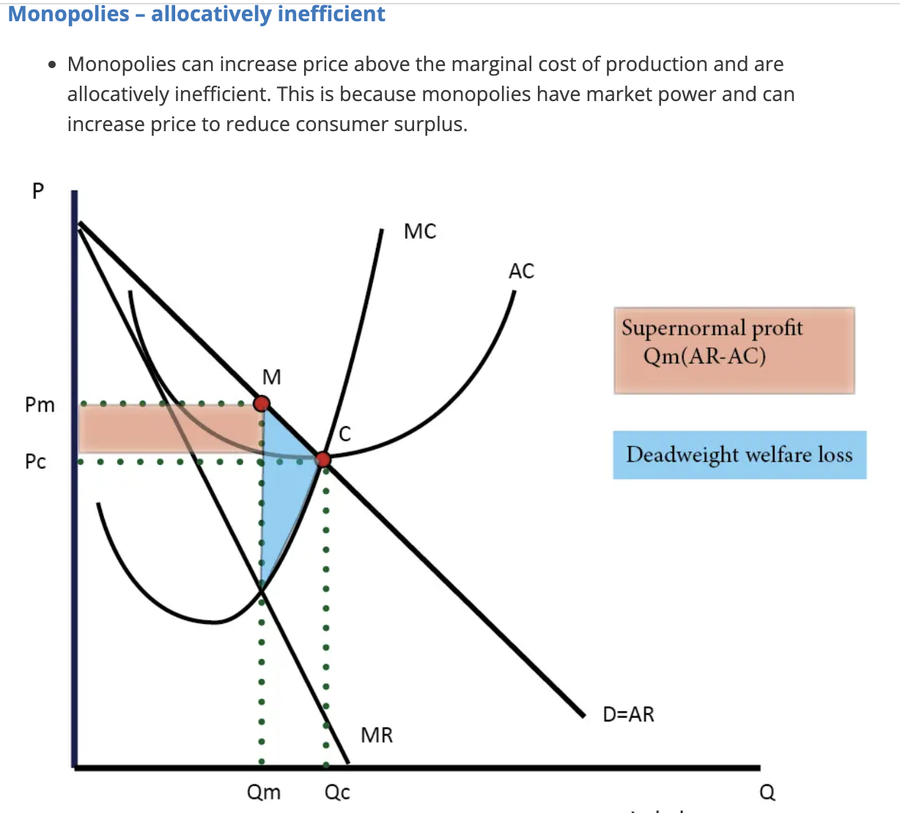
Two things about this figure are worth pausing on, because both differ from the textbook monopoly diagram.
Costs fall throughout. There is no U shape and no minimum for marginal cost to cut, which is what a natural monopoly looks like: average cost is still falling at every output the market could absorb, so one firm supplies it more cheaply than several could.
And Q1 is not the profit-maximising output. It is marked where price meets marginal cost, which is the allocatively efficient quantity. The profit-maximising output sits well to the left, where marginal revenue meets marginal cost. The gap between the two is the whole case against monopoly, and reading Q1 as the firm's chosen output reverses it.
7.1 Structure
A pure monopoly has one seller in the relevant market, no close substitute and high barriers to entry. The firm and industry are the same.
Real-world legal definitions of monopoly vary by country and purpose. For syllabus analysis, focus on market power and barriers rather than memorising a particular statutory market-share threshold.
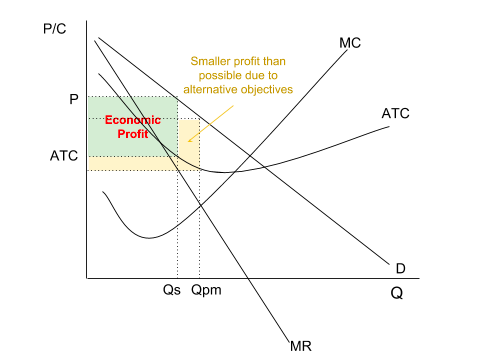
7.2 Output, price and profit
The monopolist faces the market demand curve, so AR slopes downward and MR lies below AR. A profit-maximising monopolist:
- chooses output where MC = MR;
- charges the price shown on AR at that output; and
- compares AR with ATC to determine profit or loss.
Monopoly does not guarantee supernormal profit. Weak demand or high cost can produce normal profit or loss. Strong barriers merely allow supernormal profit to persist if it exists.
7.3 Performance
Compared with a perfectly competitive benchmark using the same cost conditions, a profit-maximising monopoly commonly has:
- higher price;
- lower output;
- P > MC and allocative inefficiency;
- possible productive inefficiency;
- possible supernormal profit; and
- a deadweight welfare loss.
However, the comparison is conditional. A monopolist may achieve economies of scale, finance research and development, provide network infrastructure or innovate. Market power may also reduce pressure to control cost and create X-inefficiency.
7.4 Monopoly and dynamic efficiency
Supernormal profit can fund innovation, but it does not ensure innovation. The incentive depends on contestability, the threat of technological replacement, patent protection, management objectives and the ability to appropriate returns.
8. Natural monopoly
8.1 Meaning
A natural monopoly exists where one firm can supply the relevant market demand at a lower average cost than two or more firms. It normally arises when:
- fixed and sunk infrastructure costs are very high;
- marginal costs are relatively low; and
- LRAC continues to fall across the relevant range of market demand.
Duplicating networks such as pipes, rails or local distribution infrastructure may therefore raise total cost.
Natural monopoly is a cost condition, not simply a firm protected by law and not simply any very large firm.
8.2 Pricing problem
If LRAC is falling, MC may lie below AC.
- Marginal-cost pricing sets P = MC and can achieve allocative efficiency, but the firm may make a loss because P < AC.
- Average-cost pricing sets P = AC, allowing normal profit, but gives a higher price and lower output than marginal-cost pricing.
- Unregulated profit maximisation sets MC = MR and may produce an even higher price and lower output.
The detailed evaluation of regulation belongs mainly to Topic 8.1, but this cost-price tension is essential to understanding natural monopoly.
9. Oligopoly
9.1 Structure
An oligopoly is dominated by a few large firms. Products may be homogeneous or differentiated. Barriers are usually significant and concentration is high.
9.2 Interdependence
Interdependence is the defining behavioural feature. A firm's profit depends not only on its own decision but also on rivals' reactions. A price cut may win market share, trigger matching cuts or start a price war. An advertising campaign may provoke rival spending.
There is no single universal oligopoly equilibrium model. Outcomes range from aggressive rivalry to tacit coordination or explicit collusion.
9.3 Price rigidity
Prices may be relatively stable when firms fear rivals will match price cuts but not price rises. This is represented by the kinked demand curve, which is syllabus point 7.8.5 and is set out in full in [Topic 7.8](/cie-9708/a-level/7-8-differing-objectives-and-policies-of-firms). What matters here is the consequence: interdependence can produce price rigidity, which is why oligopolists compete so heavily on non-price terms.
9.4 Oligopoly performance
Oligopolies may:
- achieve economies of scale;
- invest heavily in research, design and advertising;
- provide wide product choice;
- earn persistent supernormal profit;
- create barriers strategically;
- charge prices above marginal cost; or
- suffer X-inefficiency.
The outcome depends on rivalry, entry conditions and regulation.
10. Barriers to entry and exit
Cambridge groups barriers as legal, market, cost and physical barriers. One barrier may fit more than one category, so explain the mechanism rather than merely naming a label.
10.1 Legal barriers
Examples include:
- patents and copyright;
- exclusive licences;
- statutory monopoly rights;
- planning restrictions; and
- regulatory approval requirements.
Legal rules may protect innovation or safety, but they can also restrict entry.
10.2 Market barriers
Examples include:
- strong brand loyalty;
- control of distribution channels;
- network effects;
- customer switching costs;
- exclusive contracts; and
- strategic product proliferation.
The barrier arises from access to customers or demand rather than purely from production cost.
10.3 Cost barriers
Examples include:
- economies of scale enjoyed by incumbents;
- large research and development spending;
- expensive advertising needed to establish a brand;
- lower finance costs for established firms; and
- sunk setup expenditure.
A new entrant may have to enter at large scale to match incumbent unit costs, increasing the loss if entry fails.
10.4 Physical barriers
Examples include:
- control of scarce land, raw materials or infrastructure;
- limited airport slots, spectrum or retail sites;
- geographical isolation; and
- technically indivisible networks.
10.5 Barriers to exit
Barriers to exit can include:
- sunk costs;
- long contracts;
- redundancy liabilities;
- environmental cleanup obligations;
- specialised assets with little resale value; and
- reputational or strategic costs.
High exit barriers can deter entry because firms anticipate difficulty recovering resources if the venture fails.
11. Short-run and long-run performance across structures
| Market | Short-run profit | Long-run profit in standard model | Long-run output and efficiency |
|---|---|---|---|
| Perfect competition | Supernormal, normal or subnormal | Normal profit after entry/exit | P = MC = minimum ATC for identical firms |
| Monopolistic competition | Supernormal, normal or subnormal | Normal profit after entry/exit | P > MC; output below minimum ATC |
| Oligopoly | Any profit position | Supernormal can persist if barriers remain | Depends on rivalry, collusion and cost conditions |
| Monopoly | Any profit position | Supernormal can persist, but is not guaranteed | MC = MR; normally P > MC |
| Natural monopoly | Any profit position | Depends on pricing/regulation | One producer may minimise industry cost; allocative pricing can conflict with cost recovery |
The short run and long run still matter in monopoly and oligopoly because costs and capacity can change over time. Barriers mean entry does not automatically remove supernormal profit; they do not abolish the distinction between time periods.
12. Efficiency and X-inefficiency
12.1 Productive efficiency
A firm is productively efficient when it produces at the minimum attainable average cost for the relevant output and technology. In the standard long-run perfect-competition model, firms operate at minimum ATC.
Monopolistic competition usually has excess capacity. Monopoly and oligopoly may or may not operate at minimum ATC.
12.2 Allocative efficiency
Allocative efficiency requires P = MC where price and marginal cost correctly represent marginal social benefit and marginal social cost. Perfect competition reaches P = MC in the model. Imperfectly competitive firms normally charge P > MC.
12.3 Dynamic efficiency
Market power can generate resources for innovation, while rivalry can generate pressure to innovate. Dynamic efficiency cannot be inferred simply from the current profit level or number of firms.
12.4 X-inefficiency
X-inefficiency occurs when a firm operates above the minimum cost achievable for its chosen output because internal slack, weak incentives, poor management or organisational problems raise cost.
It is not the same as:
- allocative inefficiency;
- diseconomies of scale; or
- producing at an output different from minimum ATC because demand is limited.
Competitive pressure may reduce X-inefficiency, but even a monopolist can control costs if regulation, management incentives or potential entry are strong.
13. Contestable markets
13.1 Meaning
A contestable market is one in which entry and exit are sufficiently easy that potential competition constrains incumbent firms. Perfect contestability assumes:
- no or very low barriers to entry and exit;
- no significant sunk costs;
- entrants can access the same technology and input prices as incumbents; and
- entry can occur rapidly before incumbents can retaliate successfully.
13.2 Hit-and-run entry
If incumbents charge a price that yields supernormal profit, an entrant may enter, serve the market and leave without unrecoverable cost. The threat can push even a single incumbent towards lower prices and efficient costs.
13.3 Implications
Contestability suggests that the threat of entry may matter more than the current number of firms. A concentrated market can behave competitively if entry is credible. Conversely, a market with several firms may be weakly contestable if sunk costs and customer lock-in are high.
It also explains why a dominant position is not permanent. Nokia held roughly two fifths of the world mobile phone market in the late 2000s and Kodak dominated photographic film for decades, and both lost that position within a few years once technology changed what customers wanted. Neither was displaced by a price war. A high market share measured today says nothing about how long it will last, which is why an answer that infers monopoly power from a concentration ratio alone is incomplete.
13.4 Limits
Real markets are rarely perfectly contestable. Incumbents may have brand loyalty, capacity advantages, data, network effects, long-term contracts or the ability to retaliate before entry costs are recovered.
Contestability is a set of conditions, not a separate market structure in the same sense as monopoly or oligopoly.
14. Price and non-price competition
14.1 Price competition
Price competition includes:
- direct price cuts;
- temporary promotions;
- discounts;
- lower subscription fees; and
- more favourable credit terms.
It may raise consumer surplus and market share but can reduce margins or trigger a price war.
14.2 Non-price competition
Non-price competition includes:
- product quality and design;
- branding and advertising;
- customer service;
- location and convenience;
- delivery speed;
- warranties;
- loyalty programmes; and
- innovation.
It is especially important where products are differentiated and firms fear that price cuts will be copied.
14.3 Evaluation
Non-price competition can provide valued quality and information, but persuasive advertising or artificial differentiation may raise cost and barriers. Price competition can benefit consumers, but predatory conduct and unsustainable price wars can reduce future competition. Pricing policies such as limit pricing, predatory pricing and price leadership are treated in Topic 7.8.
15. Collusion and the Prisoner's Dilemma
15.1 Collusion
Collusion occurs when firms coordinate rather than compete independently. It may be:
- explicit/formal; or
- tacit, based on mutual understanding without a written agreement.
Coordination may concern price, output, market sharing or bidding. Collusion tends to raise joint profit by restricting competition, but it can harm consumers through higher prices and lower output.
The formal case is a cartel, where producers agree output quotas or prices so the group behaves like a single monopolist. Cambridge examines cartels under [Topic 7.7](/cie-9708/a-level/7-7-growth-and-survival-of-firms), and the tacit case of price leadership under [Topic 7.8](/cie-9708/a-level/7-8-differing-objectives-and-policies-of-firms).
15.2 Why collusion is unstable
Each member may have an incentive to cheat by cutting price or expanding output while others continue to cooperate. Collusion is more stable when:
- there are few firms;
- products and costs are similar;
- demand is stable;
- behaviour is easy to observe;
- interaction is repeated; and
- entry barriers are high.
15.3 A two-player payoff matrix
Suppose two firms choose High price or Low price. Payoffs are profits:
| Firm B: High | Firm B: Low | |
|---|---|---|
| Firm A: High | 8, 8 | 2, 11 |
| Firm A: Low | 11, 2 | 4, 4 |
For each firm, Low gives a higher payoff whatever the rival chooses:
- if the rival chooses High, Low gives 11 rather than 8;
- if the rival chooses Low, Low gives 4 rather than 2.
Therefore Low is each firm's dominant strategy and the non-cooperative outcome is Low, Low with payoffs 4,4. Both would be better off jointly at High, High with 8,8, but each has an individual incentive to undercut.
This is the Prisoner's Dilemma: individually rational actions can produce a jointly inferior outcome.
15.4 Reading payoff matrices
Always:
- identify whose payoff is written first;
- compare one player's payoffs while holding the rival's action fixed;
- identify dominant strategies if they exist;
- locate the outcome produced by those strategies; and
- compare it with the joint-profit maximum.
Do not add the two payoffs until individual incentives have been analysed.
16. Concentration ratios
16.1 Definition
An n-firm concentration ratio is the combined market share of the largest n firms:
n-firm concentration ratio = sum of market shares of the largest n firms
If the four largest firms have shares of 28%, 22%, 14% and 10%:
CR4 = 28 + 22 + 14 + 10 = 74%
16.2 Interpretation
A higher concentration ratio suggests that a larger share of the market is controlled by leading firms. It may indicate oligopoly or monopoly power, but concentration is not identical to competitiveness.
16.3 Limitations
A concentration ratio can mislead because it depends on:
- how the product market is defined;
- whether the market is local, national or global;
- whether imports are included;
- whether shares are measured by units, revenue or capacity;
- the distribution of shares within the top n firms;
- buyer power;
- entry conditions; and
- changes over time.
A CR4 of 80% could describe four firms with 20% each or one firm with 70% and three with small shares. The strategic implications may differ.
17. Integrated comparison and evaluation
A strong Paper 4 answer does not rank market structures mechanically. It asks:
- How strong are entry and exit barriers?
- Are economies of scale substantial?
- Is demand price elastic?
- Are products differentiated?
- Is the market contestable?
- Is innovation important?
- Are there externalities or information failures?
- Do firms compete or collude?
- How is the market defined?
- What happens in the short run compared with the long run?
17.1 Competition versus scale
More firms may increase competitive pressure but prevent the exploitation of scale economies. A natural monopoly may minimise production cost with one network, yet require regulation to protect consumers.
17.2 Static versus dynamic efficiency
Perfect competition performs strongly in the standard static model. Markets with some power may finance innovation, but protected profits can also reduce effort. The best judgement depends on evidence about actual innovation incentives and contestability.
17.3 Profit versus welfare
Supernormal profit is not itself proof of exploitation. It may reflect innovation, superior efficiency or temporary success. Persistent profit combined with high barriers, P well above MC, weak quality and little innovation provides stronger evidence of market power harming welfare.
18. Where the rest of firm behaviour is covered
Two areas that students often expect here have their own syllabus topics:
- Growth and survival of firms, including internal and external growth, horizontal, vertical and conglomerate integration, and cartels, is [Topic 7.7](/cie-9708/a-level/7-7-growth-and-survival-of-firms).
- Differing objectives and policies of firms, including satisficing, revenue and sales maximisation, the principal-agent problem, price discrimination, limit and predatory pricing, price leadership and the kinked demand curve, is [Topic 7.8](/cie-9708/a-level/7-8-differing-objectives-and-policies-of-firms).
19. Exam traps
- Using MC = MR to find price. It finds output; price is read from AR.
- Treating monopoly profit as guaranteed. Barriers allow persistence, but demand and cost determine whether profit exists.
- Calling the whole MC curve a competitive supply curve. The short-run supply segment is MC above minimum AVC.
- Confusing shutdown with exit. Shutdown is a short-run zero-output decision; exit is long-run departure.
- Saying monopolistic competition is productively efficient in the long run because it earns normal profit. Normal profit does not imply minimum ATC.
- Equating concentration with collusion. High concentration can facilitate coordination but does not prove it.
- Treating a natural monopoly as any legally protected monopoly. Natural monopoly is a cost condition.
- Assuming many firms means contestability. Contestability concerns entry, exit and sunk cost.
- Adding payoff-matrix profits before checking individual incentives. Analyse each player first.
- Assuming advertising is always wasteful. It can inform, differentiate and intensify competition, though it may also create barriers.
Check you have it
Question 1
The table provides some details of the soft drinks industry in a country. number of firms 250 number of brands 1000 5 firm concentration ratio 65% Which market structure best describes the country’s soft drinks industry?

Answer: C.
The other structures are ruled out by the same figure. A monopoly (A) needs one firm. Perfect competition (D) needs no firm big enough to matter, so five of them could never reach 65%. Monopolistic competition (B) has many firms of broadly similar size, which that ratio contradicts.
Question 2
A firm has set a low price in the short run to act as a barrier to entry for new firms entering the market.
This is an example of which pricing strategy?
Answer: A.
Limit pricing means setting price low enough that a potential entrant cannot expect to cover its costs, so entry is deterred before it happens. The incumbent sacrifices some short-run profit in exchange for keeping the market to itself, and the strategy works because the incumbent's costs are lower, through economies of scale or accumulated experience, so a price that is merely thin for the incumbent is loss-making for a newcomer. It is a barrier to entry created by conduct rather than by technology or law, which is exactly how the question frames it.
Why the other options are wrong:
- B, predatory pricing, is the closest distractor. It also involves a low price, but it is aimed at driving out a rival already in the market, typically by pricing below cost until the competitor fails, after which price is raised again. The question specifies preventing new firms from entering, which is deterrence rather than elimination.
- C, price discrimination, charges different prices to different consumers for the same good according to their willingness to pay. It is a way of extracting more revenue, not of deterring entry.
- D, price leadership, is a form of tacit collusion in oligopoly where a dominant firm sets the price and rivals follow. It coordinates existing competitors rather than excluding new ones.
Question 3
In a perfectly contestable market, entries and exits are cost-free.
In reality, why is this not the case with some firms in contestable markets?
Answer: A.
Perfect contestability requires zero sunk costs: costs that cannot be recovered on exit. In reality much investment is at least partly sunk: specialised machinery has little resale value, advertising and brand-building spending is gone once spent, and staff training walks out of the door with the staff. A potential entrant knows that if things go badly it will lose that money permanently, so the hit-and-run entry that disciplines a contestable market becomes far less attractive. Incumbents can therefore sustain some abnormal profit without attracting entry.
Why the other options are wrong:
- B, all firms operating at the equilibrium level of output, describes a state of the market rather than a cost of entering or leaving it. It says nothing about recoverability.
- C claims large firms do not have to increase capital to grow. This is false in general, and in any case it concerns expansion by incumbents rather than the cost of entry or exit.
- D claims multinationals always benefit from economies of scale. "Always" is too strong, and scale economies are a barrier to entry in the conventional sense rather than a departure from cost-free exit, a different mechanism.
20. Summary
- Market structure is analysed through sellers/buyers, differentiation, entry/exit and information.
- Perfect competition gives a horizontal firm demand curve and long-run normal profit under free entry and exit.
- Monopolistic competition combines many firms with differentiated products and long-run excess capacity.
- Monopoly and oligopoly can sustain market power when barriers are high, but profit and innovation outcomes are not automatic.
- Natural monopoly is defined by cost conditions over the relevant market demand.
- Short-run shutdown depends on AVC; long-run exit depends on total cost.
- The competitive firm's short-run supply curve is rising MC above minimum AVC.
- Contestability emphasises potential entry and low sunk cost.
- Oligopoly requires strategic analysis, including price/non-price competition, collusion and the Prisoner's Dilemma.
- Concentration ratios are useful indicators but require careful market definition and interpretation.

Related CIE 9708 topics
Not the topic you were looking for? Describe what you are stuck on in your own words and we will take you to the notes that answer it.