Links Between Macroeconomic Problems
Why Fixing One Objective Tends to Damage Another
Contents: 9 sections
1. Why this topic matters
Topic 10.1 listed the macroeconomic objectives. This topic explains why a government cannot simply pursue all of them at once, and it is the analytical heart of Paper 4.
Every conflict here has the same shape. A policy acts on aggregate demand or on the exchange rate, and because the objectives are all functions of the same few variables, moving one moves the others. A candidate who can trace those chains is doing exactly what the top mark bands ask for, and a candidate who lists objectives separately is not.
The five links Cambridge sets are: the internal and external value of money, the balance of payments and inflation, growth and inflation, growth and the balance of payments, and inflation and unemployment.
2. The internal and external value of money
Internal value is the purchasing power of the currency at home, which is the inverse of the domestic price level. When inflation rises, the internal value of money falls.
External value is the exchange rate, what the currency buys in foreign currency.
2.1 The link
Sustained domestic inflation above that of trading partners erodes both.
- Domestic prices rise faster than foreign prices.
- Exports become less competitive, so foreign demand for them falls, and with it demand for the currency.
- Imports become relatively cheaper, so import volumes rise, and with them the supply of the currency on the foreign exchange market.
- Under a floating rate, lower demand and higher supply cause the currency to depreciate.
So a falling internal value tends to produce a falling external value. This is the intuition behind purchasing power parity, which holds that the exchange rate adjusts so that a basket of goods costs the same in both currencies.
2.2 Why the two can diverge
In practice they separate, often for years, and saying why is what distinguishes a strong answer.
- Capital flows dominate trade flows in the short and medium run. A country with high inflation but high interest rates can attract enough financial inflows to hold its currency up.
- Speculation and confidence move the rate on expectations rather than on current prices.
- Intervention under a fixed or managed system holds the external value at a chosen level regardless of the internal one, which is precisely what eventually breaks such systems.
- Commodity exporters see their currency track the world price of their export rather than their own price level.
The evaluation point is that a currency held up by capital inflows while domestic inflation runs high is storing up an adjustment, because the competitiveness loss is real even when the exchange rate has not yet reflected it.
3. The balance of payments and inflation
3.1 Inflation worsens the current account
Higher domestic inflation than competitors makes exports dearer and imports relatively cheaper, so export volumes fall and import volumes rise. The current account moves towards deficit. Whether the value effect follows the volume effect depends on elasticities, which is the Marshall-Lerner condition in 11.2.
3.2 A depreciation causes inflation
The chain runs back the other way, which is why this is a link rather than a one-way effect.
- The currency depreciates, from a deficit or from any other cause.
- Imported inflation: imported finished goods cost more in domestic currency.
- Cost-push inflation: imported raw materials, components and energy cost more, so firms' costs rise and short-run aggregate supply shifts left.
- Demand-pull inflation: exports become more competitive and imports dearer, so net exports rise, shifting aggregate demand right.
All three push the price level up. An economy that depends heavily on imported food and fuel is most exposed, which is why depreciation is far more inflationary for a low-income importer than for a large diversified economy.
3.3 The circularity
Note what these two sections together describe: inflation causes a deficit, the deficit causes depreciation, and depreciation causes inflation. That loop is why a country can find both problems worsening together, and why treating either in isolation fails.
4. Growth and inflation
4.1 The conflict
Demand-led growth raises the price level, and the closer the economy is to capacity the more of any demand increase appears as price rather than output.
- With a large negative output gap, spare capacity means aggregate supply is relatively elastic, so rising aggregate demand raises output with little inflation.
- Near or beyond full capacity, aggregate supply is inelastic, so rising aggregate demand mostly raises prices. This is the positive output gap of 9.2.
The strength of the conflict therefore depends on where the economy is, and an answer that states this is worth more than one asserting that growth always causes inflation.
4.2 Where there is no conflict
Supply-side growth resolves it. Growth from rising productive capacity shifts long-run aggregate supply right, which raises output and lowers the price level. This is the central argument for supply-side policy and the reason 9.2 separates actual from potential growth so carefully.
Note also the reverse direction: high and unstable inflation harms growth, by making investment appraisal unreliable, distorting relative price signals, and diverting effort into protecting against price changes. So low inflation is a condition for sustained growth rather than only a competitor with it.
5. Growth and the balance of payments
5.1 The conflict
Rising national income raises imports, because the marginal propensity to import is positive. Faster growth therefore worsens the current account, other things equal, and the effect is larger the more import-dependent the economy is and the higher its marginal propensity to import.
A country growing faster than its trading partners will see its imports rise faster than their demand for its exports, which is a structural reason for deficits in fast-growing economies.
5.2 Where there is no conflict
Export-led growth avoids the conflict entirely, because the growth itself comes from rising net exports, which improves the current account rather than worsening it.
Investment-led growth may worsen the current account in the short run, since capital equipment is often imported, while improving it later as the new capacity produces exportable output. That timing distinction is a strong evaluation point: the same policy has opposite signs at different horizons.
6. Inflation and unemployment: the Phillips curve
This is syllabus point 10.2.5 and the most heavily examined link in the topic.
6.1 The original Phillips curve
The relationship, drawn from data on wage inflation and unemployment, shows an inverse relationship: lower unemployment is associated with higher inflation.
The mechanism is that as unemployment falls, labour becomes scarce, so workers bargain more successfully for higher wages, and firms pass those costs on. Equivalently, low unemployment reflects high aggregate demand, which pulls prices up.
Drawn as a downward-sloping curve with the unemployment rate on the horizontal axis and the inflation rate on the vertical, it appears to offer governments a menu: choose a point on the curve, accepting more inflation for less unemployment or the reverse.
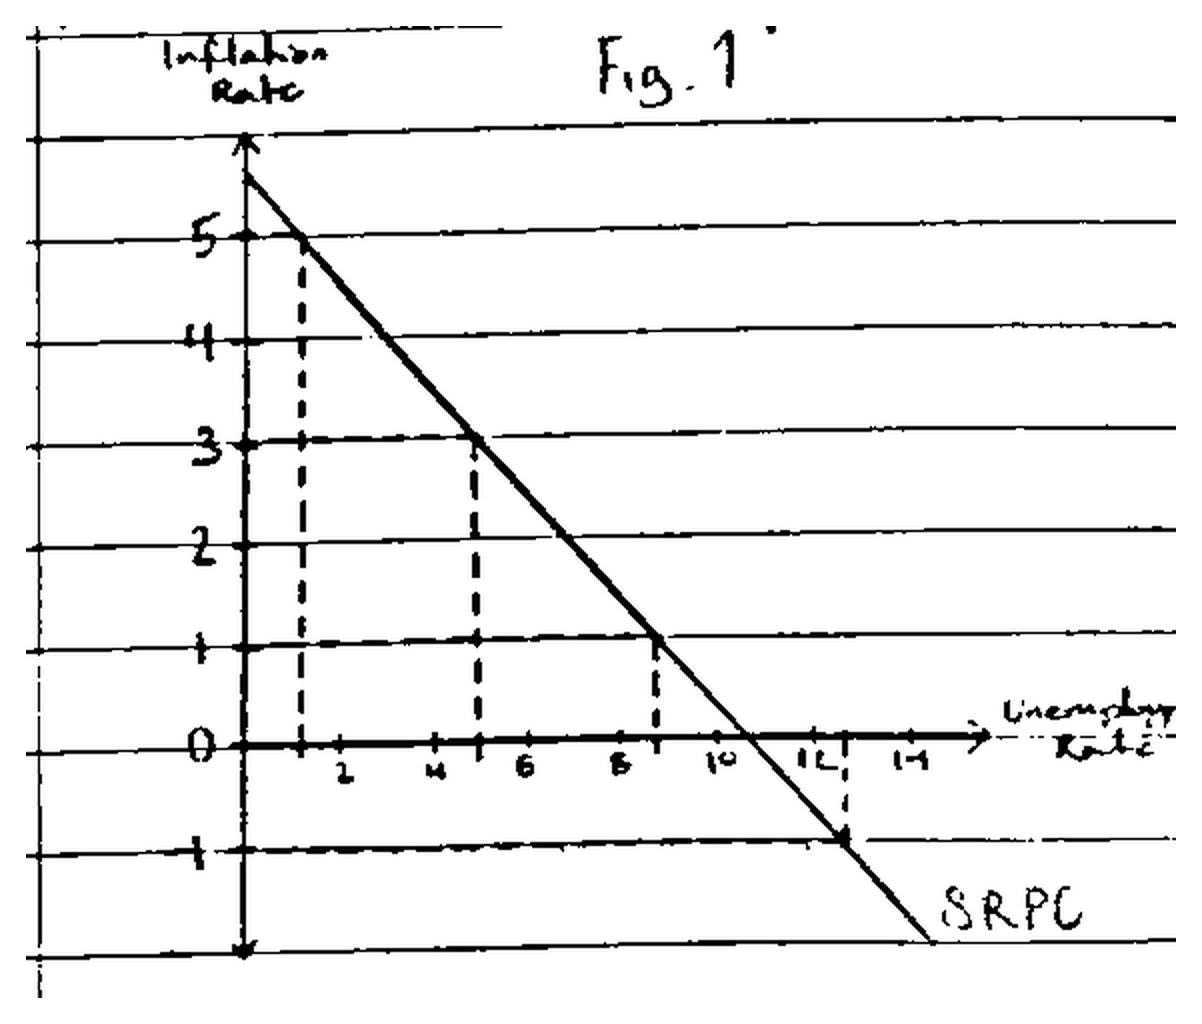
Note where the curve continues below the horizontal axis. Inflation is not floored at zero, and the curve says that pushing unemployment high enough delivers deflation rather than merely low inflation. Most printed versions stop the axis at zero and lose that.
6.2 The breakdown
The 1970s produced stagflation, high inflation and high unemployment at the same time, which the single curve cannot represent. Points appeared far outside it.
The explanation is that the original curve holds inflation expectations constant, and once expectations adjust the relationship shifts.
6.3 The expectations-augmented Phillips curve
Workers bargain over real wages, so what matters is the wage rise relative to expected inflation.
- The government expands demand to cut unemployment below the natural rate.
- Prices rise. Because workers expected the old, lower inflation rate, their real wages have fallen without their agreeing to it, so firms find labour cheap and employment rises. Unemployment falls below the natural rate.
- Workers observe the higher inflation and revise expectations upward. They bargain for higher money wages to restore their real wage.
- Real wages return to their previous level, so firms cut employment back. Unemployment returns to the natural rate, but now at a higher inflation rate.
The economy has moved to a higher short-run Phillips curve. Each short-run curve is drawn for a given expected inflation rate, and higher expected inflation shifts it outward.
6.4 The vertical long-run Phillips curve
Because unemployment returns to the natural rate whatever the inflation rate, the long-run Phillips curve is vertical at the natural rate of unemployment.
The policy implication is decisive: there is no long-run trade-off. Demand management can buy lower unemployment only temporarily, and only by accelerating inflation. Sustained attempts require ever-faster inflation to keep surprising expectations, which is the accelerationist result.
6.5 Worked reasoning
The natural rate is 5 per cent, inflation is stable at 2 per cent, and the government expands demand to reach 3 per cent unemployment.
Short run: inflation rises to. Say, 5 per cent. Real wages fall unexpectedly, employment rises, unemployment reaches 3 per cent. The economy moves up the short-run curve drawn for 2 per cent expected inflation.
Adjustment: expectations rise towards 5 per cent. Money wage claims rise. Firms shed labour.
Long run: unemployment returns to 5 per cent with inflation now at 5 per cent. The economy sits on a new short-run curve drawn for 5 per cent expected inflation, vertically above its starting point on the long-run curve.
Judgement: the government has bought a temporary fall in unemployment at the cost of a permanently higher inflation rate, and to repeat the trick it must accelerate inflation again.
6.6 Policy implications and qualifications
- Reducing unemployment sustainably requires supply-side policy, because only that lowers the natural rate itself, shifting the long-run curve left. The determinants are in 9.3.
- Reducing inflation requires reducing expected inflation, which is why central bank independence and credible targets matter: a credible target lowers expectations directly and so lowers the cost of disinflation.
- Disinflation has a real cost. Bringing inflation down means running unemployment above the natural rate while expectations adjust, and the size of that cost is the sacrifice ratio.
- Hysteresis is the Keynesian qualification. Long spells of high unemployment can raise the natural rate itself, as skills and work habits erode, so a deep recession leaves lasting damage. If that holds, demand management has long-run effects after all, and the vertical curve is less firmly anchored than the model suggests.
7. Integrated analysis and common traps
7.1 A complete chain
An economy at full capacity runs an expansionary fiscal policy to raise growth.
Growth and inflation: with a positive output gap and inelastic aggregate supply, most of the demand increase raises prices rather than output, so inflation accelerates.
Growth and the balance of payments: higher income raises imports through the marginal propensity to import, and higher domestic prices reduce export competitiveness, so the current account deteriorates on both counts.
Internal and external value: the deficit and the inflation both weaken the currency, and the depreciation feeds back as imported and cost-push inflation.
Inflation and unemployment: unemployment falls below the natural rate temporarily, then returns as expectations adjust, leaving higher inflation and no lasting employment gain.
Judgement: at full capacity the policy fails on every objective except the momentary one. The same policy applied with a large negative output gap would raise output with modest inflation and a smaller import leakage, which is why the starting position, not the policy, determines the verdict.
7.2 Common examination errors
- Treating the internal and external value of money as always moving together, ignoring capital flows.
- Explaining that depreciation causes inflation without naming the channel: imported, cost-push or demand-pull.
- Asserting that growth always causes inflation, without reference to the output gap.
- Forgetting that supply-side growth relieves the growth and inflation conflict rather than intensifying it.
- Treating the Phillips curve as a stable menu, which is the error the 1970s disproved.
- Drawing the expectations-augmented model without distinguishing the short-run curves from the vertical long-run curve.
- Saying the long-run curve is vertical without explaining why: unemployment returns to the natural rate once expectations catch up.
- Claiming supply-side policy shifts the short-run Phillips curve, when what it does is move the long-run curve by lowering the natural rate.
- Presenting conflicts as absolute, when export-led and supply-side growth resolve two of them.
8. Paper 3 and Paper 4 mastery
Paper 3 tests: identifying which objective a policy damages, reading a shift between short-run Phillips curves, identifying the long-run effect of demand expansion on unemployment, and tracing a depreciation to its inflationary consequence.
Paper 4 asks whether a government can achieve all its macroeconomic objectives simultaneously, or to evaluate a policy against several objectives at once. The structure that works is to take each conflict as a separate chain with a mechanism, then to identify the two cases where the conflict dissolves, supply-side growth and export-led growth, and to conclude on the economy's starting position. Almost every question here turns on whether there is spare capacity.
9. Final checklist
A fully prepared learner can:
- distinguish the internal from the external value of money and explain the link and why the two diverge;
- trace inflation to a current account deficit and a depreciation back to inflation, naming all three inflationary channels;
- explain the circular relationship between inflation, the deficit and depreciation;
- relate the growth and inflation conflict to the output gap, and explain why supply-side growth avoids it;
- explain why growth worsens the current account through the marginal propensity to import, and why export-led growth does not;
- state the original Phillips relationship, its mechanism and why it broke down;
- derive the expectations-augmented model step by step, and explain why the long-run curve is vertical at the natural rate;
- state the policy implications, including why lowering unemployment sustainably requires supply-side measures; and
- give hysteresis as a qualification to the vertical long-run curve.

Related CIE 9708 topics
Not the topic you were looking for? Describe what you are stuck on in your own words and we will take you to the notes that answer it.