Addressing Income and Wealth Inequality
Contents: 25 sections
The topic in one idea
Income is received over time; wealth is owned at a point in time. Market economies distribute both unequally, and governments may use wages, taxes, transfers and public services to change the distribution.
Redistribution does not necessarily produce complete equality. Its purpose may instead be to reduce extreme inequality, protect minimum living standards or improve equality of opportunity.
1. Income as a flow concept
Definition
Income is a flow of money or economic resources received over a period of time.
It is measured per:
- week;
- month;
- year;
- another stated time period.
Sources of income
Households may receive:
- wages and salaries;
- profit from self-employment or business ownership;
- rent from land or property;
- interest;
- dividends;
- transfer payments;
- pensions.
Gross and disposable income
Gross income
Income before direct taxes are deducted and before benefits are added, depending on the statistical convention used.
Disposable income
Income available after direct taxes and after relevant transfer payments.
For living-standard analysis, disposable income is often more informative than gross market income because it reflects part of the government's redistributive impact.
2. Wealth as a stock concept
Definition
Wealth is the stock of assets owned at a particular point in time, minus liabilities where net wealth is being measured.
A balance-sheet date is required, for example:
household wealth on 31 December.
Examples of assets
- housing and land;
- savings deposits;
- shares and bonds;
- pension assets;
- businesses;
- valuable physical property.
Liabilities
- mortgages;
- personal loans;
- credit-card debt;
- business debt.
Net wealth
A household can own valuable assets but have much lower net wealth because of debt.
3. Income and wealth are connected but different
Income can be used to build wealth through saving and investment.
Wealth can generate income through:
- rent;
- interest;
- dividends;
- business profit.
This creates a reinforcing relationship:
- higher income
- greater capacity to save
- more wealth
- more property income
- still higher income.
However, high income does not automatically mean high wealth.
Examples:
- a young professional may have high earnings but large student or housing debt;
- a retired household may have low current income but own a valuable home and substantial savings.
Examination distinction
Income must include a time period. Wealth must refer to a point in time.
4. Inequality, equality and equity
Income inequality
The unequal distribution of income between individuals or households.
Wealth inequality
The unequal distribution of net assets between individuals or households.
Equality
A condition in which outcomes are the same or more evenly distributed.
Equity
A normative idea concerned with fairness.
Perfect equality is not the only possible definition of fairness. Some people may regard differences caused by effort, skill, risk or responsibility as fair, while disagreeing over how large those differences should be.
Inequality is not identical to poverty
A country may have:
- high inequality but few people below an absolute poverty threshold;
- lower inequality but widespread low income;
- both poverty and high inequality.
Redistribution policy may target poverty, inequality or both.
5. The Gini coefficient
Purpose
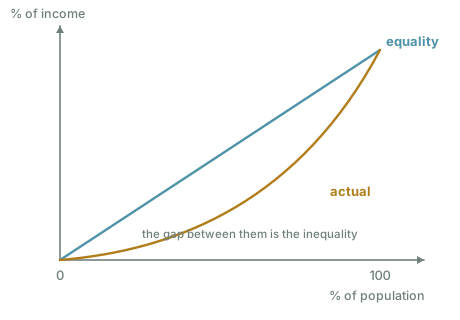
The Gini coefficient summarises the degree of inequality in a distribution.
For this syllabus, calculation is not required.
Interpretation
The coefficient is normally expressed from:
- 0 to 1, or
- 0 to 100 when multiplied by 100.
Gini = 0
Perfect equality: everyone receives or owns the same amount.
Gini = 1
Perfect inequality in the theoretical extreme: one unit receives everything and all others receive nothing.
Between 0 and 1
A higher coefficient indicates a more unequal distribution.
Example:
- Economy A: income Gini = 0.27;
- Economy B: income Gini = 0.48.
Economy B has greater measured income inequality.
Income and wealth Gini coefficients
These are separate measures.
A country may have:
- moderate income inequality;
- much higher wealth inequality.
Never describe an income Gini as if it measured wealth inequality.
6. Limitations of the Gini coefficient
6.1 It compresses the distribution into one number
Two countries can have the same coefficient but different patterns of inequality.
Example:
- one may have a very poor bottom group;
- another may have an extremely rich top group.
6.2 Data quality
Measures may be distorted by:
- undeclared income;
- informal economic activity;
- inaccurate asset values;
- offshore wealth;
- survey non-response.
6.3 Household differences
Household size, composition and shared resources affect living standards.
6.4 Before-tax versus after-tax measurement
A pre-tax income Gini and a post-tax-and-transfer Gini answer different questions.
6.5 Income versus wealth
A low income Gini does not prove wealth is evenly distributed.
6.6 It does not directly show absolute living standards
Two economies can have the same Gini coefficient but very different average incomes.
Exam judgement
The Gini coefficient is useful for summarising and comparing inequality, but it should be combined with information about living standards, poverty and the position of different groups.
7. Economic reasons for income inequality
7.1 Differences in human capital
Education, training, skills and experience can raise productivity and earning power.
Workers with scarce skills may receive higher wages.
7.2 Differences in occupation
Wages vary because jobs differ in:
- responsibility;
- risk;
- working conditions;
- required qualifications;
- scarcity of workers;
- demand for the final product.
7.3 Hours worked and employment status
A full-time worker usually earns more than an otherwise similar part-time worker.
Unemployment, underemployment or inactivity can cause very low market income.
7.4 Labour demand and supply
High demand combined with restricted supply raises wages.
Example:
A specialised surgeon may be highly paid because training is lengthy and the supply of qualified workers is limited.
7.5 Ownership of property and businesses
Households with assets may receive:
- rent;
- dividends;
- interest;
- profit.
7.6 Entrepreneurship and risk
Successful entrepreneurs may receive high profit, while unsuccessful ventures may generate losses.
7.7 Discrimination and unequal opportunity
Income differences may reflect unequal access or treatment based on personal characteristics rather than productivity.
7.8 Geographical differences
Wages and employment opportunities differ between regions because of:
- industrial structure;
- cost of living;
- infrastructure;
- labour demand;
- mobility barriers.
7.9 Government policy
Tax rates, benefits, minimum wages and public services affect disposable income.
8. Economic reasons for wealth inequality
8.1 Inheritance
Some households receive property, businesses or financial assets from previous generations.
8.2 Unequal saving capacity
High-income households can usually save a larger amount and may save a larger proportion of income.
Low-income households may use nearly all income for current necessities.
8.3 Asset-price changes
Owners benefit when the price of an asset they already hold rises. The assets that matter most here are:
- housing;
- shares;
- land;
- businesses.
Non-owners do not receive the same capital gain and may find entry more difficult.
8.4 Compound returns
Investment returns can themselves be reinvested, allowing wealth to grow over time.
8.5 Business ownership
Ownership of successful firms can create substantial wealth.
8.6 Debt
Two households with identical assets can have very different net wealth if one has much larger liabilities.
8.7 Age and life cycle
Older households have generally had more time to save and repay debt, though this is not true in every case.
8.8 Unequal income
Persistent income differences feed into wealth differences through saving and investment.
Core insight
Wealth inequality may persist more strongly than income inequality because wealth can be inherited, generate returns and appreciate in value.
9. Why governments redistribute
Possible objectives include:
- reduce poverty;
- reduce extreme inequality;
- protect a minimum standard of living;
- improve equality of opportunity;
- improve access to essential services;
- support social cohesion;
- correct unequal starting positions.
Redistribution can occur through:
- cash income;
- the tax system;
- wages;
- services provided in kind.
10. Minimum wage
Definition
A minimum wage is a legal minimum hourly or periodic wage.
In Topic 3.2 it is analysed as a minimum price. In Topic 3.3 the focus is its redistributive role.
Intended effect
Raise the earnings of low-paid workers.
Potential benefits
- higher income for workers who retain their jobs and hours;
- lower in-work poverty;
- narrower wage inequality;
- stronger incentive to enter employment;
- possibly higher productivity through motivation and lower staff turnover.
Potential limitations
- reduced employment if labour demand falls;
- fewer hours or benefits;
- higher business costs and prices;
- non-compliance or informal employment;
- limited help for households without anyone in paid employment;
- some minimum-wage workers belong to relatively high-income households.
Key conditions
Effectiveness depends on:
- how high the wage is set;
- elasticity of demand for labour;
- ability of firms to raise productivity;
- enforcement;
- coverage;
- wider labour-market conditions.
Judgement
A moderate, enforced minimum wage can raise low pay with limited job loss, but it is not a complete policy for households outside employment.
11. Transfer payments
Definition
Transfer payments are payments made without a current good or service being provided in return.
Examples:
- unemployment benefits;
- disability support;
- pensions;
- child-related benefits;
- housing support.
Intended effects
- raise disposable income of selected groups;
- protect income during unemployment, illness or retirement;
- reduce poverty and income inequality;
- stabilise consumption.
Potential benefits
- can be targeted at households with greatest need;
- immediate income support;
- may improve access to food, housing and education;
- can support equality of opportunity.
Potential limitations
- fiscal cost;
- administrative cost;
- inaccurate targeting;
- fraud or non-take-up;
- possible reduced incentive to work or save;
- a poverty trap if benefits are withdrawn rapidly as earnings rise.
Evaluation
Design matters. Gradual withdrawal and support for employment can reduce disincentive effects.
12. Progressive income taxation
Definition
A progressive income tax takes a larger proportion of income as income rises.
A system is not progressive merely because a high-income person pays more money in tax. The average tax rate must rise with income.
Intended effects
- reduce post-tax income inequality;
- finance transfer payments and public services;
- place a larger burden on those with greater ability to pay.
Potential benefits
- direct reduction in disposable-income inequality;
- substantial revenue potential;
- automatic response as incomes change;
- can be combined with tax-free allowances.
Potential limitations
- weaker incentives to work additional hours, train or take risk;
- tax avoidance or evasion;
- migration of highly mobile workers or capital;
- complex administration;
- high marginal rates may not maximise revenue.
Strong analysis
The effect depends on effective tax rates, thresholds, enforcement and how the revenue is used, not simply the announced top rate.
13. Inheritance and capital taxes
Inheritance tax
A tax on wealth transferred at death, according to the design of the national system.
Rationale
- reduce transmission of wealth inequality between generations;
- raise revenue;
- promote greater equality of opportunity.
Limitations
- avoidance through legal planning;
- valuation difficulties;
- liquidity problems for asset-rich but cash-poor estates;
- possible effects on saving or family businesses;
- politically contested fairness.
Capital taxes
Taxes may apply to:
- ownership of wealth;
- gains in asset values;
- transfers of assets;
- particular forms of property or capital.
Rationale
- tax income or gains arising from asset ownership;
- reduce wealth concentration;
- broaden the tax base.
Limitations
- asset valuation;
- capital mobility;
- avoidance;
- discouragement of saving or investment;
- volatile revenue where asset prices fluctuate.
Evaluation
These taxes can target wealth more directly than income tax, but their success depends heavily on coverage, valuation and enforcement.
14, state provision of essential goods and services
Meaning
Government provides or finances services such as:
- education;
- healthcare;
- basic housing support;
- sanitation;
- essential transport;
- social care.
Redistribution in kind
A household may receive no cash payment but gain access to a service that would otherwise be unaffordable.
This increases real living standards and can reduce inequality in access.
Potential benefits
- ensures minimum access;
- supports equality of opportunity;
- can break the link between parental income and children's education or health;
- may address merit-good under-consumption;
- directly benefits households that need the service.
Potential limitations
- fiscal and opportunity cost;
- queues or rationing;
- variable quality;
- services may not match preferences;
- universal provision may benefit high-income households too;
- government may misjudge demand or location.
Evaluation
State provision may be particularly effective where access matters more than cash income, but quality, capacity and targeting are crucial.
15. Comparing redistribution policies
| Policy | Main channel | Likely strength | Key limitation |
|---|---|---|---|
| Minimum wage | Raises earnings from work | Direct help for low-paid employees | Does not reach non-workers; possible employment effects |
| Transfer payments | Raises disposable cash income | Can target immediate need | Fiscal cost and possible disincentives |
| Progressive income tax | Reduces high post-tax incomes and raises revenue | Broad redistributive capacity | Avoidance and incentive effects |
| Inheritance/capital taxes | Targets wealth and asset gains | Addresses intergenerational concentration | Valuation, avoidance and mobility |
| State provision | Redistributes services in kind | Improves access and opportunity | Cost, capacity and quality problems |
Policy mix
No single policy addresses every cause.
A coherent package may combine:
- minimum wage for low-paid workers;
- transfers for those unable to work;
- progressive taxes to finance redistribution;
- wealth-related taxes to address asset concentration;
- public services to improve opportunity.
16. Efficiency–equity trade-offs
Redistribution may improve equity but affect efficiency.
Possible efficiency costs:
- weaker work or saving incentives;
- administrative resources;
- tax avoidance;
- reduced investment;
- poorly targeted spending.
Possible efficiency benefits:
- healthier and better-educated workers;
- greater labour-force participation;
- improved social stability;
- better use of underdeveloped talent;
- reduced costs associated with severe poverty.
Strong evaluation
The relationship is not automatically a simple trade-off. Well-designed education, healthcare and work-support policies may improve both equity and productive potential.
17. Worked numerical interpretation
Example 1: flow versus stock
A household receives annual income of £42,000. It owns assets worth £310,000 and has debts of £190,000.
- income = £42,000 per year;
- net wealth = £120,000 at the stated date.
Do not add annual income directly to wealth without specifying saving and the measurement date.
Example 2: Gini interpretation
Country X income Gini: 0.31. Country Y income Gini: 0.46.
Country Y has greater measured income inequality.
This does not prove:
- that Country Y has lower average income;
- that Country Y has more absolute poverty;
- that wealth inequality follows the same ranking.
Example 3: tax progressivity
Household A earns £20,000 and pays £2,000 income tax. Household B earns £80,000 and pays £20,000.
- A average tax rate = 10%;
- B average tax rate = 25%.
The tax pattern is progressive because the proportion paid rises with income.
18. Common examination traps
- Income is not a stock; it must have a time period.
- Wealth is not simply high income.
- Wealth should normally be measured net of liabilities when net wealth is requested.
- A higher Gini means greater inequality, not greater equality.
- The syllabus does not require calculation of the Gini coefficient.
- An income Gini does not measure wealth inequality.
- Inequality is not identical to poverty.
- A minimum wage helps only workers whose employment and hours are maintained.
- Transfer payments are not payments for current production.
- Paying more tax in cash does not automatically make a system progressive.
- State provision redistributes services even when no cash changes hands.
- Complete equality is not the only possible concept of equity.
- Progressive tax necessarily has no incentive effect, false.
- Inheritance tax necessarily eliminates inherited advantage, false.
- Redistribution necessarily reduces efficiency, too simplistic.
19. Paper 1 technique
Common tasks:
- distinguish flow from stock;
- interpret Gini coefficients;
- classify causes of income or wealth inequality;
- identify the correct redistributive policy;
- distinguish progressive from proportional taxation;
- identify a policy limitation.
Quick method
- Look for a time period: probably income.
- Look for ownership at a date: probably wealth.
- For Gini, compare size only; do not calculate.
- Ask whether the policy affects wages, cash income, tax liability, wealth or access to services.
- Check who is excluded from the policy.
20. Paper 2 technique
Four marks: income versus wealth
Income is a flow received over a period of time, such as wages per month or rent per year. Wealth is a stock of assets owned at a point in time, usually measured net of liabilities. Wealth can generate income, while saving from income can build wealth.
Six marks: reasons for wealth inequality
Develop three linked reasons:
- inheritance creates unequal starting assets;
- high-income households can save and invest more;
- asset appreciation and compound returns widen existing differences.
Eight marks: progressive taxation
Explain:
- average tax rate rises with income;
- post-tax inequality falls;
- revenue can fund transfers/services;
- possible incentive, avoidance and migration effects;
- effectiveness depends on thresholds, rates and enforcement.
Twelve marks: best policy
Question:
Discuss whether transfer payments are the most effective way to reduce income inequality.
For:
- direct and immediate support;
- target low-income groups;
- protect people outside work;
- raise disposable income.
Against:
- fiscal cost;
- targeting errors;
- non-take-up;
- work-disincentive and poverty-trap risks;
- do not directly address unequal wages or wealth.
Judgement:
Transfer payments are especially effective for immediate poverty relief, but a policy mix is more likely to reduce persistent inequality because minimum wages, progressive taxation and essential public services address different causes and groups.
21. Active recall
- Why is income a flow?
- Why is wealth a stock?
- State four sources of income.
- Calculate net wealth from assets and liabilities.
- What does a Gini coefficient of 0 represent?
- What does a rise in the Gini coefficient indicate?
- Give two limitations of the Gini coefficient.
- Give four causes of income inequality.
- Give four causes of wealth inequality.
- Why can wealth inequality reinforce income inequality?
- How can a minimum wage redistribute income?
- Why may a minimum wage fail to reduce household inequality?
- Define a transfer payment.
- Explain a poverty-trap risk.
- What makes an income tax progressive?
- Why might inheritance tax reduce inequality of opportunity?
- Why are capital taxes difficult to administer?
- How does state provision redistribute in kind?
- Give one efficiency cost of redistribution.
- Give one way redistribution might improve efficiency.
22. One-minute revision
Income
A flow received over time.
Wealth
A stock of net assets owned at a point in time.
Gini coefficient
- 0 = perfect equality;
- 1 = perfect inequality;
- higher value = greater measured inequality;
- calculation not required.
Main causes
Income inequality:
- skills and qualifications;
- occupation and labour-market forces;
- hours and employment status;
- property income;
- discrimination and geography.
Wealth inequality:
- inheritance;
- unequal saving;
- asset ownership and capital gains;
- compound returns;
- debt and age.
Main policies
- minimum wage;
- transfer payments;
- progressive income tax;
- inheritance and capital taxes;
- state provision of essentials.
Check you have it
Question 1
Inequality in an economy can be categorised as either income inequality or wealth inequality.
What is most likely to cause greater wealth inequality than income inequality?
Answer: B.
Wealth is a stock of assets; income is a flow of earnings. Property is a major component of wealth and its ownership is far more concentrated than earnings are. When property values rise, the gains accrue entirely to those who already own property, and non-owners gain nothing, the wealth gap widens sharply. Their current incomes, meanwhile, are largely unchanged, because a higher house price does not itself pay a salary. So the effect on wealth inequality far exceeds the effect on income inequality.
Why the other options are wrong:
- A, an increase in indirect taxation, is regressive and so worsens inequality of real income: those on low incomes spend a larger share of income on taxed goods. It does not directly change asset holdings.
- C, a lower minimum wage, cuts the earnings of the lowest-paid. That is squarely an income effect.
- D, lower interest on savings, reduces investment income. Note the trap: savings are wealth, so this option looks wealth-related, but what falls is the return flowing from the asset, not the value of the asset itself, the balance in the account is unchanged.
Best evaluation insight
Different policies reach different groups, so a balanced policy mix is usually stronger than relying on one instrument.
What the syllabus asks for on this topicOfficial syllabus coverage · Product mastery map
Official syllabus coverage
Students must understand:
- 3.3.1 the difference between income as a flow concept and wealth as a stock concept;
- 3.3.2 the measurement of income and wealth inequality using the Gini coefficient, with no calculation required;
- 3.3.3 economic reasons for inequality of income and wealth;
- 3.3.4 policies to redistribute income and wealth:
- minimum wage;
- transfer payments;
- progressive income taxes, inheritance taxes and capital taxes;
- state provision of essential goods and services.
Product mastery map
This topic is divided into nine measurable skills:
- distinguish income from wealth;
- interpret the Gini coefficient;
- explain causes of income inequality;
- explain causes of wealth inequality;
- analyse a minimum wage as a redistributive policy;
- analyse transfer payments;
- analyse progressive income taxation;
- analyse inheritance taxes, capital taxes and state provision;
- compare policies and make a reasoned judgement.

Related CIE 9708 topics
Not the topic you were looking for? Describe what you are stuck on in your own words and we will take you to the notes that answer it.