Exchange Rates
Fixed, Floating and Managed Rates, Purchasing Power Parity and Trade Terms
Contents: 7 sections
1. Why this topic matters
AS Level covered how an exchange rate is determined and what a depreciation does. A2 asks which system a country should adopt, what determines the rate in the long run, and how to measure whether trade conditions are improving.
Two A2 additions carry most of the marks: purchasing power parity as a theory of the long run equilibrium rate, and the terms of trade as a measure whose movements are easy to calculate and easy to misinterpret.
2. Exchange rate systems
2.1 Floating
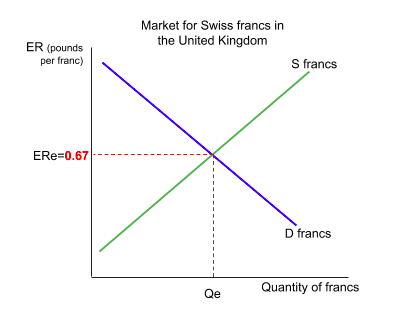
The rate is determined by demand for and supply of the currency in the foreign exchange market, with no official intervention.
Advantages:
- Automatic adjustment of the balance of payments. A deficit means supply of the currency exceeds demand, so it depreciates, making exports cheaper and imports dearer, which corrects the deficit without policy action.
- Monetary policy independence. The central bank can set interest rates for domestic objectives, because it has no exchange rate to defend.
- No need to hold large reserves, since there is no commitment to defend a rate.
- Insulation from some external shocks, since the rate absorbs part of the adjustment.
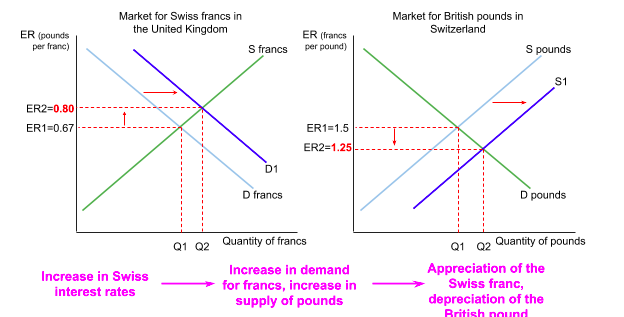
Every exchange rate is a price in two markets at once, and the two tell the same story from opposite sides. A currency that appreciates in its own market is depreciating in the other, so an answer written from either market is complete provided it is consistent.
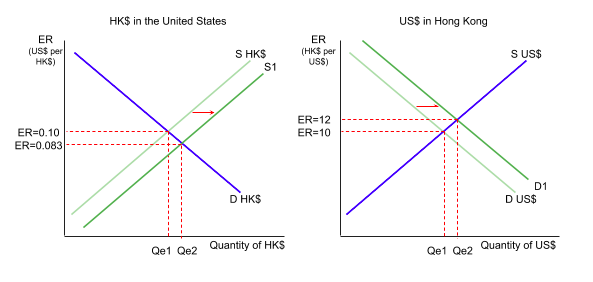
Interest rates move the rate through the financial account rather than through trade, and that is the channel Paper 4 asks about most often.
Disadvantages:
- Volatility and uncertainty, which discourages trade and long term investment because future receipts are unpredictable.
- Speculation can move the rate far from the level justified by trade flows.
- A depreciation raises import prices, which is imported inflation, particularly damaging where a country depends on imported food, fuel or capital goods.
- Removes the discipline that a fixed rate imposes on domestic inflation.
2.2 Fixed
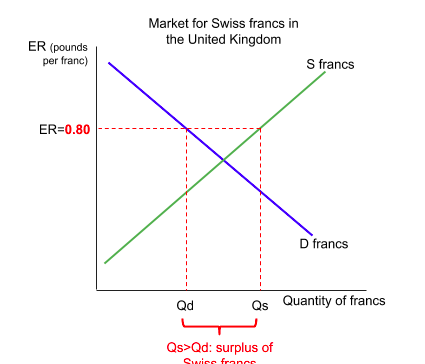
The rate is pegged to another currency or a basket, and the authorities intervene to hold it there, buying their own currency with reserves when it weakens and selling it when it strengthens.
Holding a rate above the market-clearing level creates a surplus of the currency, exactly as a minimum price does in any other market. The authorities must buy that surplus with reserves, which is why a peg set too high drains reserves and eventually breaks.
Advantages:
- Certainty for traders and investors, which encourages trade and long term investment.
- Anti-inflationary discipline. A country cannot allow inflation above its partners' without losing competitiveness and reserves, so the peg constrains domestic policy. This is why pegs are often adopted to establish credibility after a period of high inflation.
- Reduces speculation while the peg is believed.
Disadvantages:
- Requires large reserves and the willingness to use them.
- Monetary policy is subordinated to defending the rate. Interest rates must be set for the exchange rate, not for domestic unemployment or inflation.
- No automatic correction of a payments imbalance, so adjustment must come through deflating domestic demand, which raises unemployment.
- Vulnerable to speculative attack if the market believes the rate cannot be held. Defending it can require punishing interest rates.
- The rate may become fundamentally misaligned as relative inflation rates diverge.
2.3 Managed float
The rate floats but the authorities intervene to smooth fluctuations or to resist movements they judge excessive, without committing to a specific level. This is the most common arrangement in practice, and it attempts to capture the flexibility of floating with some of the stability of a peg. Its weakness is that it lacks the credibility of a firm commitment and the full independence of a clean float.
A common version sets a target band with a stated ceiling and floor. Inside the band the rate is left alone, which is what distinguishes this from a fixed rate.
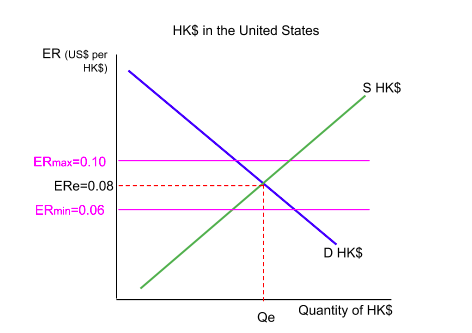
Intervention becomes necessary only when a shift would carry the rate outside the band. Here demand falls far enough that the free-market rate would breach the floor, so the authorities must buy their own currency to hold it at the floor.
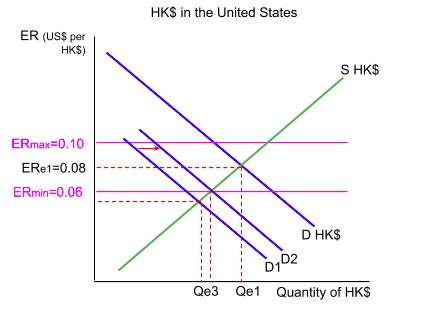
The two lower curves mark the boundary of the problem rather than a sequence. On D2 the band still does its job by doing nothing: the free market lands exactly on the floor, so no intervention is required. On D1 the free market would settle at Qe3 and a rate below 0.06, which the band does not permit. Holding the rate at the floor then means buying Hong Kong dollars with reserves, because at 0.06 the quantity supplied exceeds the quantity demanded and the authorities have to absorb the difference.
2.4 Choosing a system
The choice depends on:
- Openness. A very open economy suffers more from volatility, favouring a peg.
- Inflation history. A country needing to import credibility may peg.
- Reserve adequacy. A peg without reserves is not defensible.
- Whether shocks are symmetric with the anchor country. If the two economies move together, a common monetary policy suits both.
- Wage and price flexibility. With a fixed rate, adjustment must occur through wages, so sticky wages of 9.3 make a peg costly.
3. Purchasing power parity
3.1 The theory
Purchasing power parity (PPP) holds that in the long run exchange rates adjust so that a given sum buys the same basket of goods in every country. It follows from the law of one price: if a good were cheaper in one country, arbitrage would raise demand for that country's currency until the difference disappeared.
3.2 The relative form
The more useful version for examinations relates changes in the rate to differences in inflation:
The expected change in the exchange rate is approximately the difference between the two countries' inflation rates.
A country with higher inflation than its trading partners should see its currency depreciate by roughly the inflation differential, leaving real competitiveness unchanged.
3.3 Worked calculation
Country A has inflation of 9 per cent; Country B has inflation of 3 per cent. The current rate is 1 A-dollar to 2 B-dollars.
- Inflation differential: 9 minus 3, which is 6 per cent.
- A's currency should depreciate by approximately 6 per cent.
- New expected rate: 2 multiplied by (1 minus 0.06), which is approximately 1.88 B-dollars per A-dollar.
If instead the rate stays at 2, A's goods have become 6 per cent less competitive in real terms, and its current account should deteriorate.
3.4 Why actual rates deviate from PPP
- Non-traded goods and services such as housing, haircuts and local transport form a large share of the basket and cannot be arbitraged. This is why PPP-adjusted comparisons are needed for the development comparisons of 10.3.
- Transport costs and trade barriers prevent full arbitrage.
- Capital flows dominate day to day currency demand, and they respond to interest rates and expectations rather than to goods prices.
- Speculation can hold a rate away from fundamentals for long periods.
- Differences in the basket of goods consumed across countries.
The examinable conclusion: PPP is a poor predictor in the short run and a reasonable long run anchor, particularly where inflation differentials are large.
4. The terms of trade
4.1 Definition
The terms of trade measure the ratio of export prices to import prices, expressed as an index:
Terms of trade equals (index of export prices divided by index of import prices) multiplied by 100
4.2 Interpretation
- An improvement (a rise in the index) means export prices have risen relative to import prices, so a given volume of exports buys more imports.
- A deterioration (a fall) means the opposite.
4.3 Worked calculation
Export price index rises from 100 to 112. Import price index rises from 100 to 105.
- Terms of trade: (112 divided by 105) multiplied by 100, which is approximately 106.7.
- The terms of trade have improved by about 6.7 per cent.
Now suppose export prices rise to 112 while import prices rise to 125.
- Terms of trade: (112 divided by 125) multiplied by 100, which is 89.6.
- A deterioration of about 10.4 per cent, even though export prices rose.
That second case is the trap: the terms of trade can worsen while export prices are rising, because what matters is the ratio.
4.4 Why an improvement is not necessarily good
This is the evaluation point examiners look for.
An improvement means each unit exported buys more imports, which raises real income. But if the improvement arose because export prices rose, the volume of exports may fall, since foreign buyers face higher prices. Whether export revenue rises depends on the price elasticity of demand for exports.
- If demand for exports is inelastic, higher prices raise revenue, so the improvement is unambiguously beneficial.
- If demand is elastic, volume falls proportionately more than price rises, so revenue falls and the current account may worsen despite the improved terms.
So an improvement in the terms of trade may coincide with a worsening current account, and saying so with the elasticity condition is a strong answer.
4.5 Causes of movements
- Changes in world demand for a country's exports.
- Changes in world commodity prices, which for a primary exporter dominate everything else, as in 10.4.
- Exchange rate changes, since a depreciation lowers export prices in foreign currency and raises import prices in domestic currency, worsening the terms of trade while improving competitiveness.
- Relative inflation rates.
- Productivity growth, which can lower export prices.
Note the apparent paradox in the third point: a depreciation worsens the terms of trade and improves competitiveness at the same time. Both are true, and confusing them is a common error.
5. Integrated analysis and common traps
5.1 A complete chain
A commodity exporting country with a fixed exchange rate experiences a 30 per cent fall in world prices for its main export.
Its terms of trade deteriorate sharply, so each unit exported buys fewer imports and real national income falls. Export revenue falls, so the current account moves into deficit. Under a fixed rate there is no automatic depreciation to restore competitiveness, so the authorities must either run down reserves, raise interest rates to attract capital, or deflate domestic demand to cut imports. All three are contractionary, so unemployment rises.
Under a floating rate the currency would have depreciated automatically, cushioning the shock by making exports cheaper and imports dearer, though at the cost of imported inflation.
Judgement: for an economy exposed to volatile commodity prices, a floating or managed rate provides an adjustment mechanism that a peg removes. The counter-argument is that volatility itself deters the investment needed to diversify away from commodity dependence, which is the trap of 10.4. The choice therefore depends on whether the greater risk is external shocks or investment uncertainty.
5.2 Common examination errors
- Saying an improvement in the terms of trade is always good, without the elasticity condition.
- Confusing the terms of trade with the balance of trade. The first is a price ratio; the second is a value difference.
- Thinking a depreciation improves the terms of trade. It worsens them while improving competitiveness.
- Concluding a country is more competitive because its terms of trade improved.
- Applying PPP to short run movements.
- Forgetting that a fixed rate subordinates monetary policy.
- Treating a managed float as identical to a clean float.
6. Paper 3 and Paper 4 mastery
Paper 3 tests: calculating the terms of trade from two price indices, identifying whether they improved or deteriorated, calculating an expected rate change from an inflation differential, and identifying an advantage of a stated exchange rate system.
Practise the terms of trade calculation in both directions, including the case where both indices rise.
Paper 4 asks whether a country should fix or float. The reliable structure is to identify the country's characteristics first, namely openness, inflation history, reserves, export composition and wage flexibility, then assess each system against those, then conclude conditionally. The commodity exporter and the small open economy point in opposite directions, which is what makes the question worth asking.
Check you have it
Question 1
Country X’s living standards were compared with country Y’s living standards using real GNP per head converted into US dollars. Country X was ranked above country Y. Which factor might have caused this ranking to be incorrect?
Answer: A.
7. Final checklist
A fully prepared learner can:
- explain floating, fixed and managed systems and give at least four advantages and four disadvantages of each of the first two;
- state the criteria for choosing a system;
- state PPP in both absolute and relative forms;
- calculate an expected exchange rate change from an inflation differential;
- give at least four reasons actual rates deviate from PPP;
- define the terms of trade and calculate the index from two price indices;
- interpret a rise and a fall correctly, including where both indices rose;
- explain why an improvement may worsen the current account, using elasticity;
- explain why a depreciation worsens the terms of trade while improving competitiveness;
- distinguish the terms of trade from the balance of trade; and
- apply the analysis to a commodity exporter facing a price shock under each system.
Related CIE 9708 topics
Not the topic you were looking for? Describe what you are stuck on in your own words and we will take you to the notes that answer it.