Price Elasticity of Supply
Contents: 20 sections
The topic in one idea
Price elasticity of supply measures the responsiveness of quantity supplied to a change in price.
If price changes and quantity supplied responds strongly, supply is elastic. If quantity supplied responds weakly, supply is inelastic.
1. Definition of price elasticity of supply
Core definition
Price elasticity of supply (PES) measures the responsiveness of quantity supplied to a change in price.
Formula
Because price and quantity supplied usually move in the same direction, PES is usually positive.
- price rises
- quantity supplied rises
- price falls
- quantity supplied falls.
Examination language
A good definition should include both parts:
- responsiveness;
- quantity supplied in response to a price change.
Weak definition:
PES is when supply changes.
Stronger definition:
PES measures the responsiveness of quantity supplied to a change in price.
2. Calculating PES
Work each percentage change out from the original value, which is the method Cambridge expects unless a question tells you to do something else.
\qquad
% change = (new - original) ÷ (original) × 100
Worked example
Price rises from 10 to 12. Quantity supplied rises from 50 to 80.
Step 1: % change in quantity supplied
Step 2: % change in price
Step 3: Calculate PES
Interpretation:
Supply is elastic because quantity supplied changes by a greater percentage than price.
A note on the midpoint method
You may meet a second version of the formula that divides by the average of the two values rather than by the original one:
It exists because the original-value method gives a slightly different answer depending on which direction you travel: 10 to 12 is a 20% rise, while 12 back to 10 is a 16.7% fall. The midpoint method removes that asymmetry, and on the figures above it returns 2.54 rather than 3.
The 9708 syllabus does not ask for it. It says only "formula for and calculation of price elasticity of supply", and the words midpoint and arc elasticity appear nowhere in the document. So use the original-value method by default, and use the midpoint version only when a question explicitly sets it out. If you ever do use it, say so in your working.
Beware one collision of words. "Midpoint" also names the middle of a straight-line demand curve, where PED is unit elastic. That is a place on a diagram, not a way of calculating anything.
3. Interpreting PES coefficients
PES > 1

Supply is elastic.
Quantity supplied changes by a greater percentage than price.
PES = 1
Supply is unit elastic.
Quantity supplied changes by the same percentage as price.
0 < PES < 1
Supply is inelastic.
Quantity supplied changes by a smaller percentage than price.
PES = 0
Supply is perfectly inelastic.
Quantity supplied does not change when price changes.
PES = ∞
Supply is perfectly elastic.
An extremely small price change causes an infinite change in quantity supplied, or firms are only willing to supply at one price.
4. Shape of supply curves and PES
Perfectly inelastic supply
A vertical supply curve.
Quantity supplied is fixed whatever the price.
Example contexts:
- a fixed number of seats for an event in the very short run;
- perfectly fixed stock;
- land in a defined location, in some contexts.
Perfectly elastic supply
A horizontal supply curve.
Producers will supply any quantity at one price, but none below it.
This is usually a theoretical extreme.
General caution
Do not assume that a steeper supply curve always means more inelastic supply in all settings without considering scale and axis units. In school diagrams, steeper generally indicates lower elasticity, but elasticity is a measure of responsiveness, not slope alone.
5. Determinants of PES
5.1 Spare capacity
If firms have unused machinery, labour or floor space; they can expand output more easily when price rises.
So:
more spare capacity → more elastic supply.
If firms are already producing near full capacity, supply is less responsive.
less spare capacity → more inelastic supply.
5.2 Availability of stocks
If finished goods are already in storage, producers can respond quickly.
more stocks → more elastic supply.
If there are no stocks, firms must produce more from scratch.
no stocks → more inelastic supply.
5.3 Ease of factor substitution
If firms can easily switch labour, raw materials or machinery into the production of a product, supply is more elastic.
If production requires very specialised inputs, supply is less elastic.
5.4 Mobility of factors of production
If labour and capital can be moved easily between industries, supply can expand more quickly.
If factors are immobile, supply is less responsive.
5.5 Length of production period
Goods that take a long time to produce usually have more inelastic supply in the short run.
Examples:
- housing;
- agricultural crops;
- aircraft.
Goods that can be produced quickly usually have more elastic supply.
Examples:
- simple manufactured products;
- digital goods in some contexts.
5.6 Time period
This is one of the most important determinants.
In the very short run, supply is often inelastic. In the short run, supply may become more elastic. In the long run, supply is usually more elastic.
Why?
Because over time firms can:
- hire more labour;
- build more factories;
- train workers;
- switch resources;
- expand capacity.
5.7 Ability to store the product
If a product can be stored easily, producers may withhold or release stock more flexibly.
This can increase elasticity.
Perishable goods are often less flexible.
6. Time and PES
Very short run
Supply is often highly inelastic or even perfectly inelastic.
Example:
A concert venue cannot create more seats once tickets are on sale.
Short run
Some inputs are variable, but others remain fixed.
Firms may add overtime or use stocks.
Supply becomes somewhat more responsive.
Long run
All factors of production are more adjustable.
Firms can enter or exit, invest in capacity and reorganise production.
Supply is usually more elastic.
Common example: agriculture
A farmer cannot instantly increase wheat output when the price of wheat rises. But over a longer period the farmer may:
- switch crops;
- rent more land;
- buy more machinery;
- improve irrigation.
So agricultural supply is often more elastic in the long run than in the short run.
7. PES versus a movement along the supply curve
A movement along a supply curve happens because price changes.
PES measures how much quantity supplied responds to that change in price.
These are related but not identical ideas.
- movement along the curve = the event;
- PES = the degree of responsiveness.
Important distinction
A shift of the supply curve is caused by a non-price determinant, such as:
- cost of production;
- indirect tax;
- subsidy;
- technology;
- weather;
- number of firms.
A shift is not the same as elasticity.
8. Business significance of PES
PES matters because it affects how strongly producers can respond to changing market conditions.
Examples
If demand rises suddenly
- elastic supply
- output can expand more easily
- inelastic supply
- prices may rise sharply because quantity cannot adjust
much.
If a firm expects a price rise
A firm with storage capacity may hold back stock to sell later at a higher price.
In competitive markets
Firms with more elastic supply may exploit opportunities more effectively.
9. PES and taxation
PES helps determine the effect of taxes on price and quantity.
If supply is inelastic, producers cannot easily reduce quantity supplied, so they may bear a larger part of a tax burden depending on demand conditions.
If supply is elastic, producers can adjust output more easily.
Important qualification
Tax incidence depends on both:
- elasticity of demand;
- elasticity of supply.
Do not explain tax incidence using PES alone.
10. PES and primary products
Primary products often have relatively inelastic supply in the short run.
Reasons:
- natural conditions matter;
- production takes time;
- output may be fixed by biological processes;
- storage may be limited;
- land is limited.
This matters in commodity markets because price changes can be large when demand changes and supply cannot respond quickly.
11. PES and manufactured goods
Manufactured goods may have more elastic supply where firms can:
- use spare capacity;
- expand shifts;
- source more inputs;
- store inventories;
- enter production relatively quickly.
However, not all manufactured goods have elastic supply.
Highly specialised or capacity-intensive industries may still be inelastic in the short run.
12. Common exam traps
Trap 1: PES is negative
Usually wrong. PES is normally positive because price and quantity supplied move in the same direction.
Trap 2: PES measures a shift of supply
Wrong. PES measures responsiveness along a supply curve.
Trap 3: A steep curve automatically proves inelasticity in every case
Too simplistic. Elasticity is about proportionate responsiveness.
Trap 4: Longer time always makes PES perfectly elastic
Wrong. It usually becomes more elastic, not necessarily perfectly elastic.
Trap 5: No spare capacity means no production can increase at all
Wrong. It becomes harder, not necessarily impossible.
Trap 6: Primary products always have perfectly inelastic supply
Wrong. They are often relatively inelastic in the short run, not perfectly inelastic in all cases.
Trap 7: Storage always makes supply elastic
Not always. It can help, but other constraints may still matter.
Trap 8: Elasticity and slope are exactly the same
Wrong. Related in simple diagrams, but not identical concepts.
Trap 9: If supply is elastic, tax burden falls only on consumers
Wrong. Incidence depends on both demand and supply elasticities.
Trap 10: PES uses quantity demanded
Wrong. It uses quantity supplied.
13. Paper 1 technique
Typical tasks:
- define PES;
- calculate PES;
- interpret a PES coefficient;
- identify elastic or inelastic supply;
- explain a determinant of PES;
- compare short-run and long-run PES.
Calculation method
- Identify change in quantity supplied.
- Calculate % change in quantity supplied.
- Identify change in price.
- Calculate % change in price.
- Divide quantity-supplied % change by price % change.
- Interpret the resulting coefficient.
14. Paper 2 technique
Four-mark structure
Price elasticity of supply measures the responsiveness of quantity supplied to a change in price. It is calculated as the percentage change in quantity supplied divided by the percentage change in price. A higher coefficient means producers are more responsive to price changes.
Six-mark structure: determinant question
Question idea:
Explain why the supply of agricultural products is often price inelastic in the short run.
Model structure:
- define inelastic supply;
- explain production takes time;
- explain natural constraints;
- explain inability to expand output quickly;
- conclude quantity supplied changes less than price.
Eight-mark structure: time comparison
Question idea:
Explain why the price elasticity of supply of housing is likely to be higher in the long run than in the short run.
Model structure:
- define PES;
- short run: building takes time, planning and labour constraints;
- long run: firms can train workers, build more capacity, acquire land and finance new projects;
- conclusion: supply becomes more responsive over time.
15. Worked examples
Example A: Fresh strawberries in a heatwave
Short-run supply is likely to be inelastic because current crop levels are largely fixed and strawberries are perishable.
Example B: T-shirts in a factory with idle machinery
Supply may be relatively elastic because the firm can increase output quickly by using spare capacity and additional shifts.
Example C: Housing in a major city
Supply is usually inelastic in the short run because building takes time, planning permission is required and land is limited.
Example D: Digital music downloads
Supply may be highly elastic after creation because extra units can be supplied at very low marginal cost.
16. Active recall
- Define PES.
- State the PES formula.
- Why is PES usually positive?
- What does PES > 1 mean?
- What does 0 < PES < 1 mean?
- What does PES = 1 mean?
- What does PES = 0 mean?
- What does PES = ∞ mean?
- Why does spare capacity affect PES?
- Why do stocks affect PES?
- Why is time important for PES?
- Why is agricultural supply often inelastic in the short run?
- Why may manufactured supply be more elastic?
- Distinguish movement along supply from a shift of supply.
- Why does ability to store products affect PES?
- Give an example of very short-run perfectly inelastic supply.
- Explain why housing supply is inelastic in the short run.
- How can factor mobility affect PES?
- Why is PES relevant to tax analysis?
- Why is PES not the same as the slope of the curve?
17. One-minute revision summary
Definition
PES measures the responsiveness of quantity supplied to a change in price.
Formula
PES = % change in quantity supplied / % change in price.
Interpretation
- PES > 1
- elastic
- PES = 1
- unit elastic
- 0 < PES < 1
- inelastic
- PES = 0
- perfectly inelastic
- PES = ∞
- perfectly elastic.
Determinants
- spare capacity;
- stocks;
- ease of factor substitution;
- factor mobility;
- storage;
- production period;
- time.
Check you have it
Question 1
An increase in the popularity of air conditioning units has resulted in their price increasing by 20%. In response to this the quantity supplied increased by 30%. What can be concluded from this?
Answer: D.
Question 2
The table shows the price of a good and total expenditure on the good during specific periods when the market is in equilibrium. period price ($) total expenditure ($) 1 12 96 000 2 5 40 000 3 8 64 000 4 10 80 000 5 4 32 000 What can be deduced from this data?
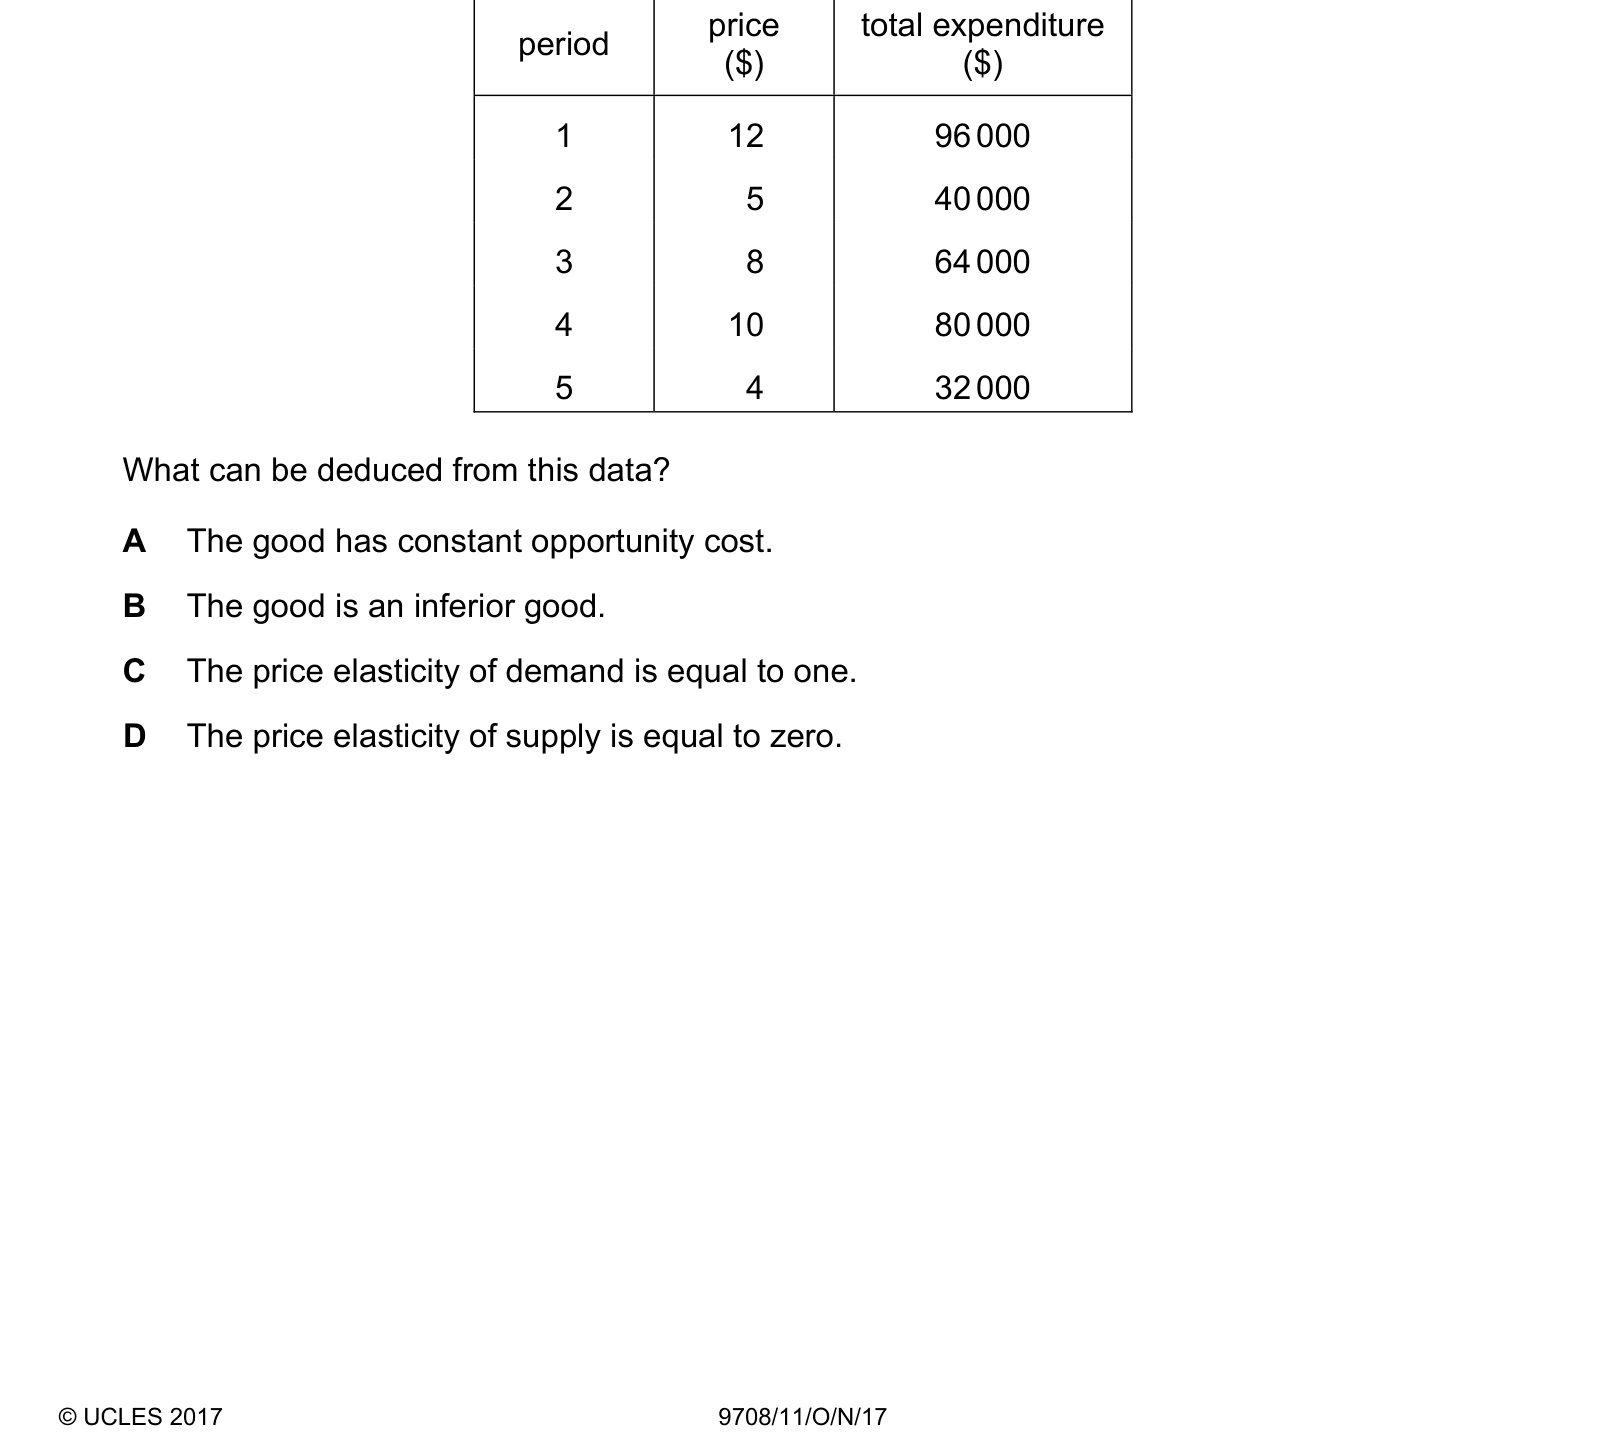
Answer: D.
Explanation:
1. The price elasticity of demand (PED) is a measure of how much the quantity demanded of a good changes in response to a change in its price. If the price elasticity of demand is equal to one, it means that a 1% change in price leads to a 1% change in quantity demanded. However, from the given data, we cannot directly deduce the price elasticity of demand since we do not have information on the quantity demanded at each price level.
2. Inferior goods are goods for which demand decreases as consumer income rises. The data provided does not give any information about consumer income and its relationship with the demand for the good. Hence, we cannot deduce that the good is an inferior good from the given data.
3. Constant opportunity cost refers to a situation where the cost of producing an additional unit of a good remains constant. The data provided does not give any information about the production cost or opportunity cost associated with the good. Therefore, we cannot deduce that the good has constant opportunity cost from the given data.
4. The total expenditure on a good is calculated by multiplying the price of the good by the quantity of the good consumed. In a market equilibrium, the total expenditure should remain constant when the price changes and the quantity consumed changes accordingly. From the data given, we can see that as the price changes, the total expenditure also changes proportionally. However, the ratio between price and total expenditure remains constant. This indicates that the price elasticity of supply is equal to zero. A price elasticity of supply equal to zero means that the quantity supplied does not change in response to a change in price, resulting in a constant total expenditure.
Question 3
Which business is likely to be the slowest to alter its output in response to a sustained increase in demand for its product?
Answer: D.
The question is really about price elasticity of supply, which depends on how quickly a firm can bring extra output to market. Oil exploration is the slowest of the four by a wide margin: finding a new field requires surveying, drilling exploratory wells, proving reserves, and building extraction and transport infrastructure, a process running to years. The capital involved is highly specific and cannot be redeployed from elsewhere, so supply is extremely inelastic in the short run.
Why the other options are wrong:
- A, a fast-food restaurant, can extend opening hours, add staff shifts and order more ingredients within days.
- B, a household cleaning service, is labour-intensive with minimal capital requirements, so it can recruit and deploy extra cleaners very quickly.
- C, a newspaper printer, is the most plausible alternative because printing presses are expensive and specialised. But existing presses can be run for longer, extra shifts added, and additional capacity contracted in, an adjustment measured in weeks, not years.
Most important exam insight
In the short run supply is often inelastic; in the long run it usually becomes more elastic.
What the syllabus asks for on this topicWorking syllabus coverage for Topic 2.3 · Product mastery map
Working syllabus coverage for Topic 2.3
Students should understand and apply:
- the definition of price elasticity of supply (PES);
- the formula and calculation of PES;
- interpretation of PES coefficients;
- the range of elasticity values, including perfectly elastic and perfectly inelastic supply;
- determinants of PES;
- the importance of time in supply responsiveness;
- business and policy applications of PES.
Product mastery map
This topic is split into seven measurable portal skills:
- define PES and explain what it measures;
- calculate PES from percentage changes measured against the original value;
- interpret PES coefficient values accurately;
- distinguish elastic, inelastic, unit elastic, perfectly elastic and perfectly inelastic supply;
- analyse determinants of PES;
- explain why PES usually changes over time;
- apply PES to real-world and policy examples.
Related CIE 9708 topics
Not the topic you were looking for? Describe what you are stuck on in your own words and we will take you to the notes that answer it.