Production Possibility Curves
Contents: 28 sections
The topic in one idea
A PPC shows the maximum combinations of two goods or categories of output that an economy can produce with its current resources and technology when those resources are fully and efficiently used.
The PPC connects:
- scarcity;
- choice;
- opportunity cost;
- productive efficiency;
- unemployment and inefficiency;
- economic growth;
- resource allocation.
Essential definitions
| Term | Examination-ready definition |
|---|---|
| Production possibility curve | A curve showing the maximum combinations of two goods or categories of output that can be produced with current resources and technology when resources are fully and efficiently used. |
| Productive efficiency | Production at the maximum possible output from available resources and technology, represented by a point on the PPC. |
| Opportunity cost | The benefit or output of the next best alternative forgone when a choice is made. |
| Productive capacity | The maximum output an economy can produce with its available resources and technology. |
| Economic growth | An increase in real output over time; potential growth is shown by an outward shift of the PPC. |
| Unemployment of resources | A situation in which available factors of production are not fully used. |
| Constant opportunity cost | Each additional unit of one product requires the sacrifice of a constant amount of the other product. |
| Increasing opportunity cost | Each additional unit of one product requires progressively larger sacrifices of the other product. |
1. Nature and meaning of a PPC
What the PPC shows
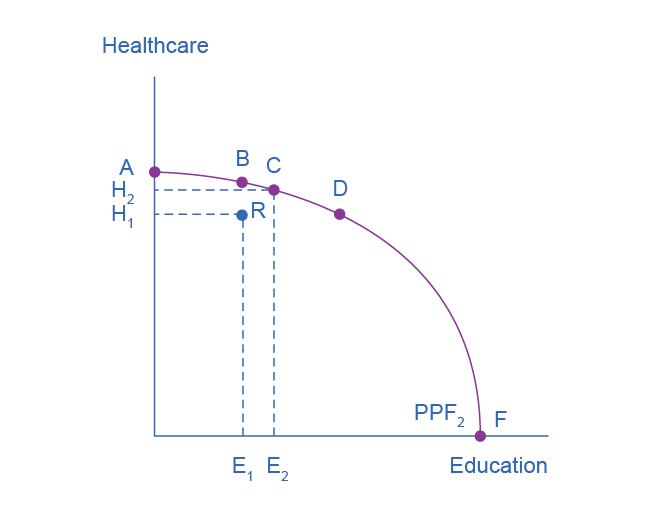
A PPC normally places one product or category of output on each axis.
Examples:
- consumer goods and capital goods;
- agricultural products and industrial products;
- healthcare and defence;
- food and clothing.
Each point on the curve represents a maximum attainable combination when:
- current resources are fully employed;
- resources are used efficiently;
- the quantity and quality of resources are fixed;
- technology is fixed;
- only the two displayed categories are considered.
Why economists use two products
A real economy produces millions of products.
The PPC simplifies reality by grouping output into two categories. This makes the trade-off visible.
It is an economic model, so its usefulness depends on the question being studied rather than on reproducing every detail of the economy.
The standard axes
Either product may be placed on either axis.
Always:
- label both axes;
- state units where given;
- draw the curve clearly;
- label relevant points;
- explain what changes rather than relying on the diagram alone.
The scarcity connection
Resources are limited. The economy cannot produce unlimited quantities of both products.
The PPC therefore forms a boundary between combinations that are currently attainable and combinations that are unattainable with current productive capacity.
2. Positions on, inside and outside the PPC
Point on the PPC
A point on the curve represents:
- full use of resources;
- efficient use of resources;
- maximum attainable output for that combination;
- productive efficiency.
Important limitation
A point on the PPC is productively efficient, but not necessarily allocatively efficient.
Allocative efficiency concerns whether the chosen combination best matches society's preferences or welfare.
A PPC alone does not identify which point society prefers.
Point inside the PPC
A point inside the curve is attainable but productively inefficient.
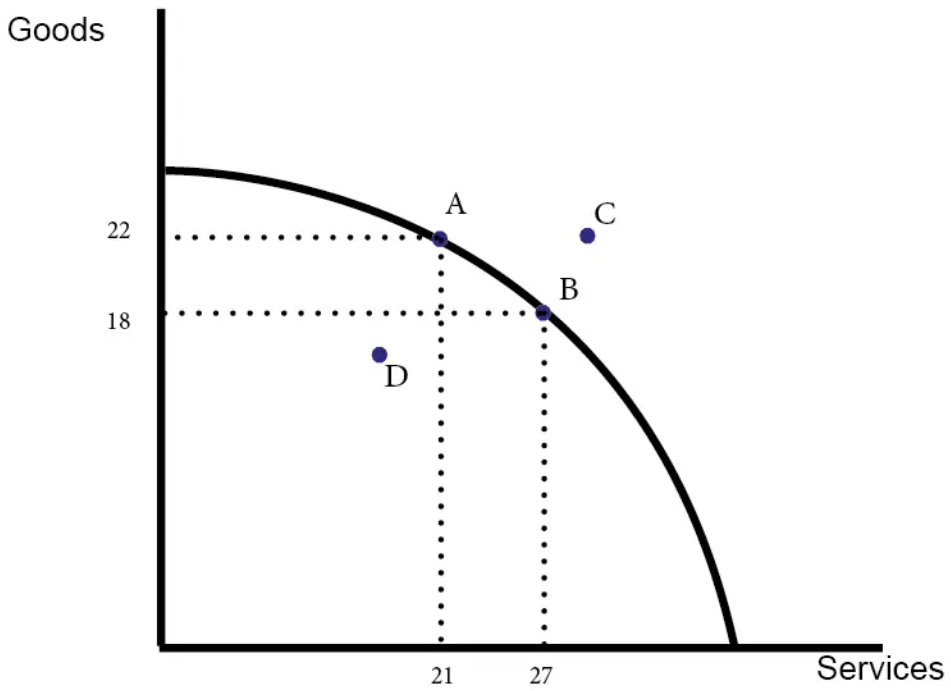
Possible causes include:
- unemployment;
- idle factories;
- underused land;
- recession;
- poor organisation;
- regional mismatch;
- strikes;
- temporary disruption;
- inefficient allocation of resources.
At an interior point, the economy can increase production of at least one good without necessarily reducing production of the other, because unused or misused resources can be employed more effectively.
Point outside the PPC
A point outside the current curve is unattainable with current domestic resources and technology.
It may become attainable through:
- economic growth;
- improved technology;
- more resources;
- better-quality resources.
Trade nuance
International trade can allow an economy to consume a combination beyond its domestic PPC, but it does not allow domestic production beyond the current PPC without an increase in productive capacity.
This distinction becomes important in Topic 6.1.
Point at an intercept
At an intercept, all available resources are devoted to one displayed product and none to the other.
This is usually a theoretical extreme.
3. Movements along the PPC
A movement from one point on the PPC to another represents a reallocation of resources between the two products.
Example:
Move from more agricultural output and less industrial output to more industrial output and less agricultural output.
The economy remains productively efficient, but the output mix changes.
Opportunity cost on the PPC
The opportunity cost of producing more of one product is the amount of the other product sacrificed.
Example:
| Combination | Consumer goods | Capital goods |
|---|---|---|
| A | 100 | 0 |
| B | 90 | 10 |
| C | 70 | 20 |
| D | 40 | 30 |
Moving from B to C:
- capital goods increase by 10;
- consumer goods fall by 20.
The opportunity cost of 10 additional capital goods is 20 consumer goods.
The opportunity cost per additional capital good is:
20 / 10 = 2 consumer goods.
Marginal opportunity cost
On a PPC, the slope represents the rate at which one product must be sacrificed to obtain more of the other.
In simple discrete questions:
Opportunity cost per extra unit of X = units of Y forgone / extra units of X.
Students should use the direction specified in the question.
Moving in the opposite direction
Opportunity cost depends on the direction of movement.
If the economy moves from C back to B:
- it gains 20 consumer goods;
- it sacrifices 10 capital goods.
The opportunity cost of 20 additional consumer goods is 10 capital goods.
4. Constant opportunity cost
Meaning
Opportunity cost is constant when equal increases in one product require equal sacrifices of the other product.
Shape
A constant-opportunity-cost PPC is a straight downward-sloping line.
Why it might occur
The straight line assumes resources are equally suitable for producing both products.
Example:
The trade-off stays constant when every group of resources transferred from food to clothing always produces:
- 10 additional clothing units;
- at a cost of 5 food units.
Numerical example
| Combination | Food | Clothing |
|---|---|---|
| A | 100 | 0 |
| B | 80 | 10 |
| C | 60 | 20 |
| D | 40 | 30 |
| E | 20 | 40 |
| F | 0 | 50 |
Each additional 10 clothing units costs 20 food units.
Opportunity cost remains constant.
Evaluation
Constant opportunity cost may be plausible where:
- resources are homogeneous;
- production processes use similar resources;
- resources transfer easily between uses.
It is less plausible where resources are specialised.
5. Increasing opportunity cost
Meaning
Opportunity cost increases when progressively larger amounts of one product must be sacrificed to obtain equal additional amounts of the other product.
Shape
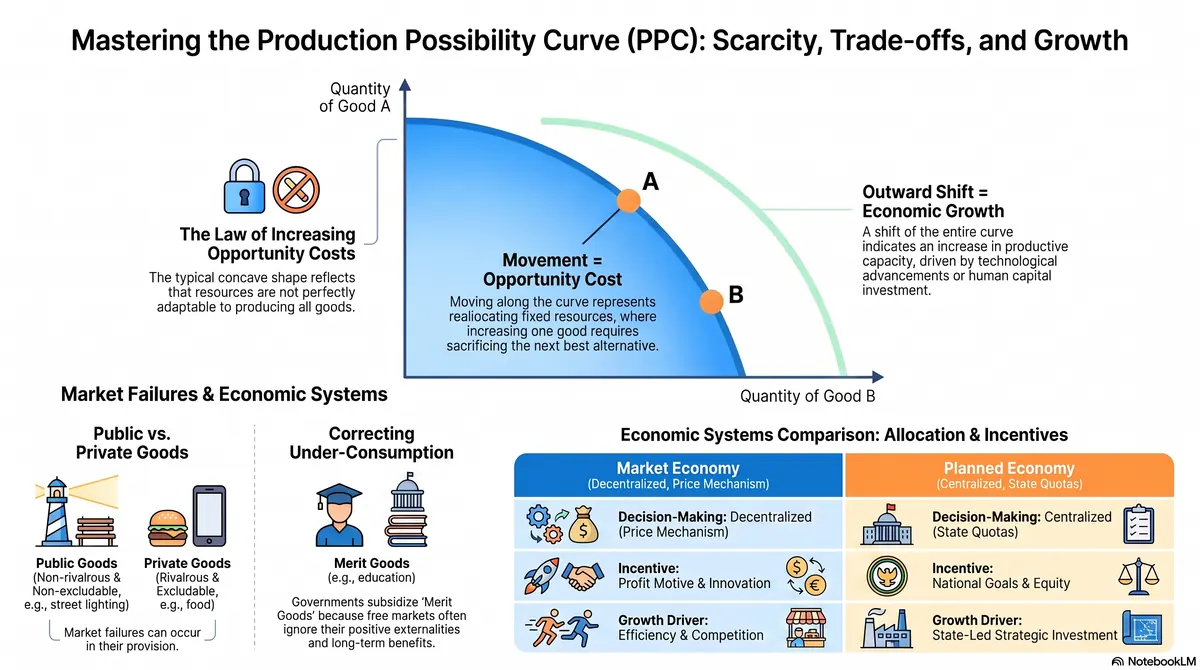
The standard PPC is bowed outward from the origin, also described as concave to the origin.
Why increasing opportunity cost occurs
Resources are not equally suited to all uses.
Suppose resources move from agriculture to industry.
Initially, the economy transfers resources least suited to agriculture and relatively well suited to industry.
This causes:
- a small loss of agricultural output;
- a relatively large gain in industrial output.
As reallocation continues, resources increasingly well suited to agriculture must be transferred.
This causes:
- larger agricultural losses;
- for each equal increase in industrial output.
Analytical chain:
- Resources are specialised
- least suitable resources move first
- initial sacrifice is small
- increasingly suitable resources are later removed from their original use
- marginal opportunity cost rises.
Numerical example
| Combination | Agricultural output | Industrial output |
|---|---|---|
| A | 100 | 0 |
| B | 95 | 10 |
| C | 85 | 20 |
| D | 68 | 30 |
| E | 42 | 40 |
| F | 0 | 50 |
For each additional 10 industrial units, agricultural output sacrificed is:
- A to B: 5;
- B to C: 10;
- C to D: 17;
- D to E: 26;
- E to F: 42.
Opportunity cost increases.
Cambridge examination logic
Official specimen guidance expects students to explain that resources least suited to the original sector are redeployed first, creating low initial opportunity cost, followed by increasingly larger sacrifices as more suitable resources are transferred.
Common shape-language trap
For a standard diagram with the origin at the lower-left:
- bowed outward;
- concave to the origin;
- increasing opportunity cost.
Do not call this "convex to the origin."
6. Constant versus increasing opportunity cost
| Feature | Constant opportunity cost | Increasing opportunity cost |
|---|---|---|
| PPC shape | Straight line | Bowed outward |
| Resource assumption | Resources equally adaptable | Resources specialised |
| Marginal trade-off | Constant | Progressively larger |
| Slope magnitude | Constant | Becomes steeper moving right |
| Typical realism | Simplified special case | More realistic standard case |
Diagram rule
The direction matters.
If X is on the horizontal axis and Y on the vertical axis:
- moving right increases X;
- Y is sacrificed;
- a steeper curve means more Y must be sacrificed for an additional X.
7. Shift of the PPC
A shift changes the economy's productive capacity.
Outward shift
An outward shift means the economy can produce more than before.
It represents an increase in potential output or productive capacity.
Possible causes:
- increase in labour force;
- immigration of workers;
- discovery of natural resources;
- capital investment;
- improved infrastructure;
- education and training;
- improved health;
- technological progress;
- better institutions;
- greater productivity;
- successful supply-side policy.
Inward shift
An inward shift means productive capacity has fallen.
Possible causes:
- war;
- natural disaster;
- destruction of capital;
- loss of labour through emigration;
- disease;
- depletion of resources;
- severe environmental damage;
- collapse of institutions;
- prolonged underinvestment;
- loss of technology or productive knowledge.
Consequences of an outward shift
Potential consequences include:
- higher maximum output;
- more consumption possibilities;
- lower opportunity cost of achieving some previous output combinations;
- potential economic growth;
- improved living standards if the additional capacity is used and benefits are distributed;
- changed output trade-offs.
Consequences of an inward shift
Potential consequences include:
- lower maximum output;
- reduced consumption possibilities;
- greater scarcity;
- lower potential living standards;
- increased trade-offs;
- previous efficient combinations becoming unattainable.
8. Parallel and pivot shifts
Parallel outward shift
If productive capacity rises for both products to a similar extent, the whole curve shifts outward.
Possible cause:
- broad improvement in education and infrastructure;
- economy-wide technology;
- increase in general-purpose capital.
Biased or asymmetric shift
If productivity improves mainly in one sector, one intercept may move outward more than the other.
Example:
A major improvement in agricultural technology mainly increases food production.
The PPC may pivot outward towards the agricultural axis.
Capital-goods investment and future PPC
Suppose the axes show:
- consumer goods;
- capital goods.
Choosing more capital goods now may reduce current consumer-goods output.
However:
- More capital-goods production
- larger future capital stock
- greater future productive capacity
- larger outward PPC shift later.
This illustrates a present-versus-future trade-off.
Qualification
Capital investment does not automatically produce growth.
Its effect depends on:
- quality;
- maintenance;
- worker skills;
- utilisation;
- complementary infrastructure;
- demand;
- institutional conditions.
9. Movement along versus shift of the PPC
This is one of the most important distinctions.
Movement along the PPC
Cause:
- reallocation of current resources.
Meaning:
- different output mix;
- opportunity cost;
- productive capacity unchanged;
- economy remains efficient if it stays on the curve.
Outward shift
Cause:
- increase in resources, resource quality, technology or productivity.
Meaning:
- productive capacity rises;
- previously unattainable combinations may become attainable.
Inward shift
Cause:
- loss or deterioration of productive resources or technology.
Meaning:
- productive capacity falls.
| Event | Curve position | Productive capacity |
|---|---|---|
| Move from A to B on same PPC | Movement along | Unchanged |
| Move from inside point U to point A on PPC | Movement toward frontier | Unchanged |
| PPC1 to PPC2 outward | Shift | Increased |
| PPC1 to PPC0 inward | Shift | Reduced |
10. Movement from inside the PPC to the curve
A movement from an interior point to the frontier represents improved use of existing capacity.
Possible causes:
- lower unemployment;
- recovery from recession;
- improved matching of workers and jobs;
- restarting idle factories;
- better organisation;
- reduced disruption.
What it shows
- actual output increases;
- resource utilisation improves;
- productive efficiency is restored;
- productive capacity itself does not necessarily rise.
Actual versus potential economic growth
Actual growth
An increase in current real output.
This may be shown by movement:
- from inside the PPC towards the curve;
- along with greater utilisation of existing resources.
Potential growth
An increase in productive capacity.
This is shown by:
- an outward shift of the PPC.
An economy may experience:
- actual growth without a frontier shift;
- a frontier shift without immediately using the new capacity;
- both at the same time.
11. Significance of a position within the PPC
The current syllabus explicitly requires the significance of a position within the PPC.
A point inside the curve may indicate:
- unemployed labour;
- idle capital;
- unused land;
- recession;
- inefficient production;
- misallocation;
- disruption.
Why interior points matter
At an interior point, scarcity still exists, but the economy is not obtaining the maximum possible output from its available resources.
The opportunity cost of raising one output may initially be low or zero if idle resources suited to that output can be used without reducing the other output.
Example
If unemployed construction workers and idle machinery are available, housing output may rise without immediately reducing healthcare output.
Once the economy reaches the frontier, further expansion of housing normally requires sacrifice elsewhere.
Not every interior point is identical
An interior point can arise from:
- cyclical unemployment;
- structural mismatch;
- deliberate reserve capacity;
- maintenance;
- temporary closure;
- severe inefficiency.
The policy response may differ.
12. Productive efficiency versus allocative efficiency
Productive efficiency
Represented by any point on the PPC.
The economy is producing the maximum possible combination with available resources.
Allocative efficiency
Requires the output combination to match society's preferences and social benefits.
The PPC alone cannot identify the allocatively efficient point because it does not show:
- consumer preferences;
- marginal social benefit;
- distribution;
- social cost;
- value judgements.
Cambridge-quality judgement
Correct:
Point A is productively efficient because it is on the PPC.
Potentially incorrect:
Point A is the best point for society.
More information is required.
13. PPC and unemployment
A recession may move the economy from the frontier to an interior point.
Chain:
- Aggregate demand falls
- firms reduce production
- unemployment and idle capacity rise
- actual output falls
- economy moves inside its PPC.
A recovery may reverse this:
- Demand and production recover
- idle resources are re-employed
- economy moves towards the frontier.
This does not by itself shift the PPC.
Long-term unemployment qualification
Prolonged unemployment can eventually reduce productive capacity if:
- skills deteriorate;
- firms close;
- investment falls;
- workers emigrate.
The PPC may then shift inward or grow more slowly.
14. PPC and economic growth
Outward shift and potential growth
An outward shift shows potential economic growth.
Possible chain:
- Education and training
- higher human capital
- greater worker productivity
- more maximum output
- PPC shifts outward.
Growth does not guarantee welfare improvement
An outward shift shows greater production possibilities, but welfare effects depend on:
- which products can increase;
- whether capacity is used;
- income distribution;
- environmental effects;
- leisure;
- population growth;
- product quality;
- social priorities.
Population growth
A larger population may shift the total PPC outward by increasing labour.
However, output per person may not rise.
A stronger welfare analysis should distinguish:
- total productive capacity;
- productive capacity per person.
Environmental sustainability
Using natural resources to expand current output may:
- move production along the existing PPC;
- cause future resource depletion;
- reduce future productive capacity.
A temporary rise in output can therefore be associated with a future inward shift if production is unsustainable.
15. PPC and technological change
General-purpose technology
Affects both products and may shift the entire PPC outward.
Examples:
- electricity;
- digital communication;
- transport improvement;
- general management innovation.
Sector-specific technology
Mainly increases one output.
Example:
- drought-resistant crops mainly increase agricultural capacity;
- improved medical technology mainly increases healthcare capacity.
Labour-saving technology
Can:
- raise productive capacity;
- create short-run unemployment or mismatch;
- shift the PPC outward while the economy temporarily remains inside it.
This demonstrates the difference between capacity and utilisation.
16. PPC and natural disasters
A severe earthquake may destroy:
- factories;
- roads;
- housing;
- power systems;
- human capital.
Immediate effects may include both:
- movement inside the existing capacity boundary due to disruption;
- an inward shift because productive resources have been destroyed.
A strong answer should identify whether the event:
- prevents current use of resources;
- permanently or substantially reduces capacity;
- does both.
17. PPC and trade
The PPC shows production possibilities.
With trade, a country may specialise and exchange output, allowing consumption beyond the domestic PPC.
Do not say:
Trade shifts the domestic PPC outward.
Trade does not necessarily change domestic resources or technology.
Correct distinction:
- domestic PPC: production capacity;
- trading possibility or consumption possibility: attainable consumption after trade.
Trade may cause a future outward shift if it increases:
- investment;
- technology transfer;
- skills;
- productivity.
But that is a separate dynamic effect.
18. PPC and economic systems
Every system chooses a point on or inside its PPC.
- A market system uses prices and profit to influence the output mix.
- A planned system uses government targets.
- A mixed system combines both.
The PPC itself does not determine which system is used.
It shows:
- the feasible boundary;
- the cost of choosing between alternatives.
19. Diagram construction checklist
Standard PPC diagram
- Draw horizontal and vertical axes.
- Label one output on each axis.
- Draw a downward-sloping frontier.
- Use a straight line for constant opportunity cost.
- Use a bowed-out curve for increasing opportunity cost.
- Label points clearly.
- Add arrows for movements or shifts.
- Explain the economic meaning in writing.
Points diagram
Include:
- A on the curve;
- U inside;
- X outside.
State:
- A: attainable and productively efficient;
- U: attainable but inefficient;
- X: currently unattainable.
Shift diagram
Use:
- PPC1 for original;
- PPC2 for outward shift;
- PPC0 for inward shift.
Do not draw an outward shift as a movement from one point to another on the same curve.
Asymmetric shift
Move one intercept farther outward than the other.
Explain which sector's productive capacity improved.
20. Common misconceptions and examination traps
Trap 1: Every point on the PPC is allocatively efficient
Every point is productively efficient, not necessarily socially preferred.
Trap 2: A point inside is unattainable
It is attainable but inefficient.
Trap 3: A point outside is impossible forever
It is unattainable with current resources and technology but may become attainable after growth.
Trap 4: Movement from inside to the curve is an outward shift
It is improved utilisation of existing capacity.
Trap 5: Movement along the PPC is economic growth
It is reallocation between outputs with capacity unchanged.
Trap 6: Outward shift always means actual output immediately rises
Capacity rises, but the economy may not use it fully.
Trap 7: A straight PPC shows increasing opportunity cost
A straight PPC shows constant opportunity cost.
Trap 8: A bowed-out PPC shows constant opportunity cost
It shows increasing marginal opportunity cost.
Trap 9: Trade shifts the domestic PPC outward automatically
Trade can allow consumption beyond the PPC without changing domestic production capacity.
Trap 10: Unemployment always shifts the PPC inward
Unemployment usually places the economy inside the existing PPC. A persistent loss of skills or capital may later shift it inward.
Trap 11: More resources always shift both intercepts equally
Sector-specific resources may create a pivot or biased shift.
Trap 12: Population growth necessarily raises living standards
Total capacity may rise while capacity per person does not.
Trap 13: Technological progress always eliminates unemployment
It can raise capacity while causing short-run structural mismatch.
Trap 14: The PPC measures money values
Axes normally measure physical quantities or categories of real output.
Trap 15: A PPC shift and a demand or supply curve shift are interpreted in the
same way
A PPC shift represents productive-capacity change, not a change in market demand or supply.
21. Paper 1 technique
Common tasks include:
- identify point meanings;
- distinguish movement from shift;
- identify constant or increasing opportunity cost;
- calculate opportunity cost from a table;
- identify causes of outward or inward shifts;
- distinguish growth from improved utilisation;
- interpret sector-specific shifts.
Opportunity-cost calculation method
- Identify the product gained.
- Calculate the increase.
- Identify the product sacrificed.
- Calculate the decrease.
- State the opportunity cost in correct units.
- Divide only if asked for opportunity cost per unit.
Position method
- on curve
- efficient
- inside
- attainable and inefficient
- outside
- currently unattainable.
Shift method
Ask whether the event changes:
- quantity of resources;
- quality of resources;
- technology;
- productivity.
If yes, a shift is plausible.
If it only changes utilisation or output mix. Do not shift the frontier.
22. Paper 2 technique
Diagram marks
A strong diagram needs:
- correctly labelled axes;
- correct PPC shape;
- labelled points or curves;
- clear arrows;
- consistency with written analysis.
Model eight-mark answer
Question:
With the help of a diagram, explain how a PPC shows opportunity cost and consider whether opportunity cost is likely to remain constant when resources move from agriculture to industry. [8]
Model answer
A PPC shows the maximum combinations of agricultural and industrial output that can be produced when resources are fully and efficiently used. A movement along the curve towards more industrial output requires some agricultural output to be sacrificed. The agricultural output forgone is the opportunity cost of the additional industrial output.
>
Opportunity cost is unlikely to remain constant because resources are not equally suited to both sectors. Resources least productive in agriculture and relatively suitable for industry will be transferred first, causing a small initial loss of agricultural output. As further industrial expansion occurs, increasingly productive agricultural resources must be transferred, so the agricultural sacrifice rises. The PPC is therefore likely to be bowed outward rather than a straight line.
Model shift answer
Question:
Explain how improved education may affect an economy's PPC. [4]
Model answer
Improved education can raise workers' skills and human capital. This may increase labour productivity, allowing more output to be produced from the same quantity of resources. The economy's productive capacity therefore rises and the PPC shifts outward. The size and direction of the shift depend on whether education benefits both sectors equally.
Model interior-point answer
Question:
Explain the significance of an economy operating inside its PPC. [4]
Model answer
A point inside the PPC is attainable but productively inefficient. It shows that some resources are unemployed, underused or inefficiently organised. The economy may increase output of one or both goods by using existing resources more fully. Moving to the frontier increases actual output but does not itself increase productive capacity.
23. Active recall
- Define a PPC.
- State four assumptions behind a PPC.
- What does a point on the PPC show?
- What does a point inside show?
- What does a point outside show?
- Why is a point on the PPC not necessarily allocatively efficient?
- What does movement along the PPC show?
- How is opportunity cost measured?
- What shape shows constant opportunity cost?
- Why does increasing opportunity cost occur?
- What shape shows increasing opportunity cost?
- Give four causes of an outward shift.
- Give four causes of an inward shift.
- Distinguish parallel and biased shifts.
- Distinguish actual and potential growth.
- Why does movement from inside to the curve not shift the PPC?
- How can capital-goods production affect the future PPC?
- Does trade automatically shift the PPC?
- How can unemployment eventually reduce capacity?
- Why may population growth fail to raise living standards?
- How can a disaster cause both movement inside and an inward shift?
- What is productive capacity?
- Distinguish production and productive capacity.
- Explain the effect of sector-specific technology.
- Explain one sustainability limitation of the PPC model.
24. One-minute revision
PPC definition
Maximum combinations of two outputs with current resources and technology when resources are fully and efficiently used.
Positions
- on: attainable and productively efficient;
- inside: attainable but inefficient;
- outside: currently unattainable.
Movement along
Reallocation and opportunity cost; capacity unchanged.
Straight line
Constant opportunity cost.
Bowed outward
Increasing opportunity cost because resources are specialised.
Outward shift
Greater productive capacity.
Inward shift
Lower productive capacity.
Inside to frontier
Better utilisation and actual output growth, not necessarily potential growth.
Check you have it
Question 1
In the diagram JK is the initial production possibility curve for an economy producing computers and cars. J computers O L K cars What could cause the curve to shift to JL?
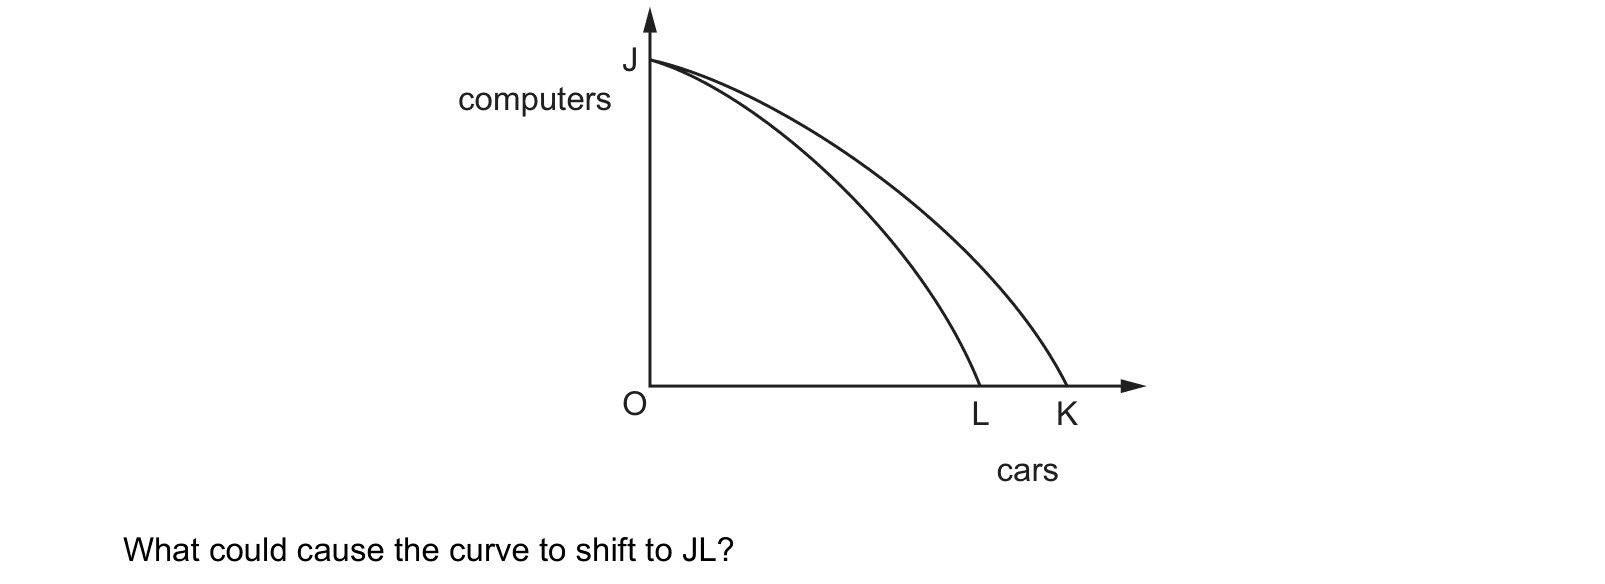
Answer: A.
Question 2
The diagram shows two production possibility curves for goods and services in an economy. What would not cause the economy’s production possibility curve to shift from PPC1 to PPC2?
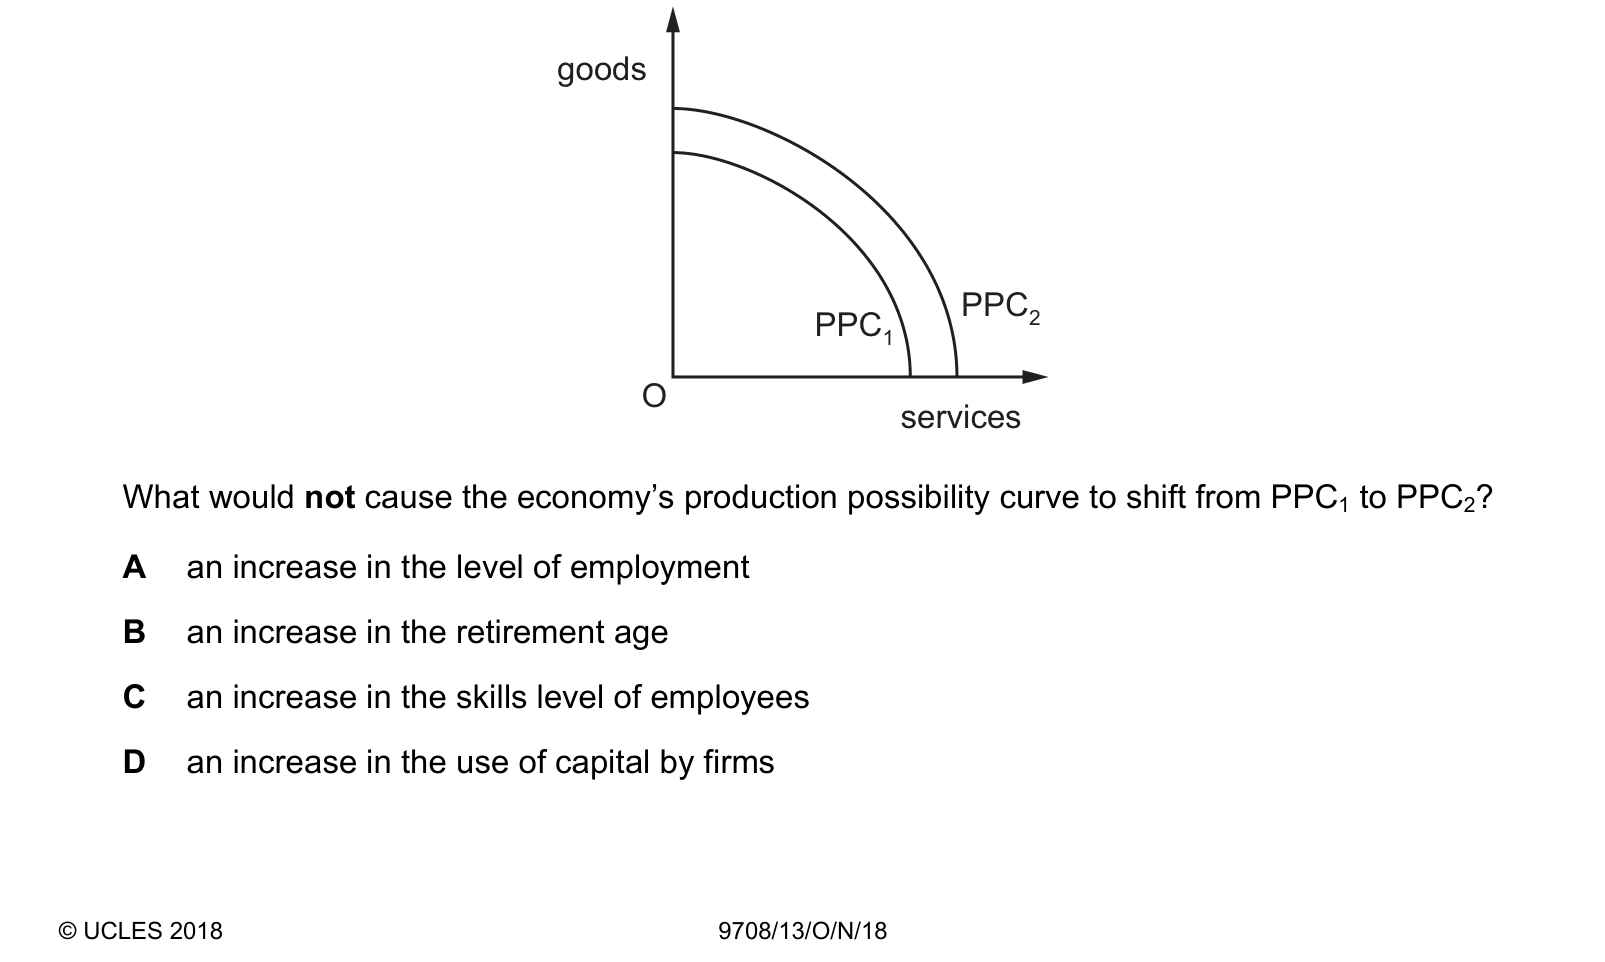
Answer: A.
Question 3
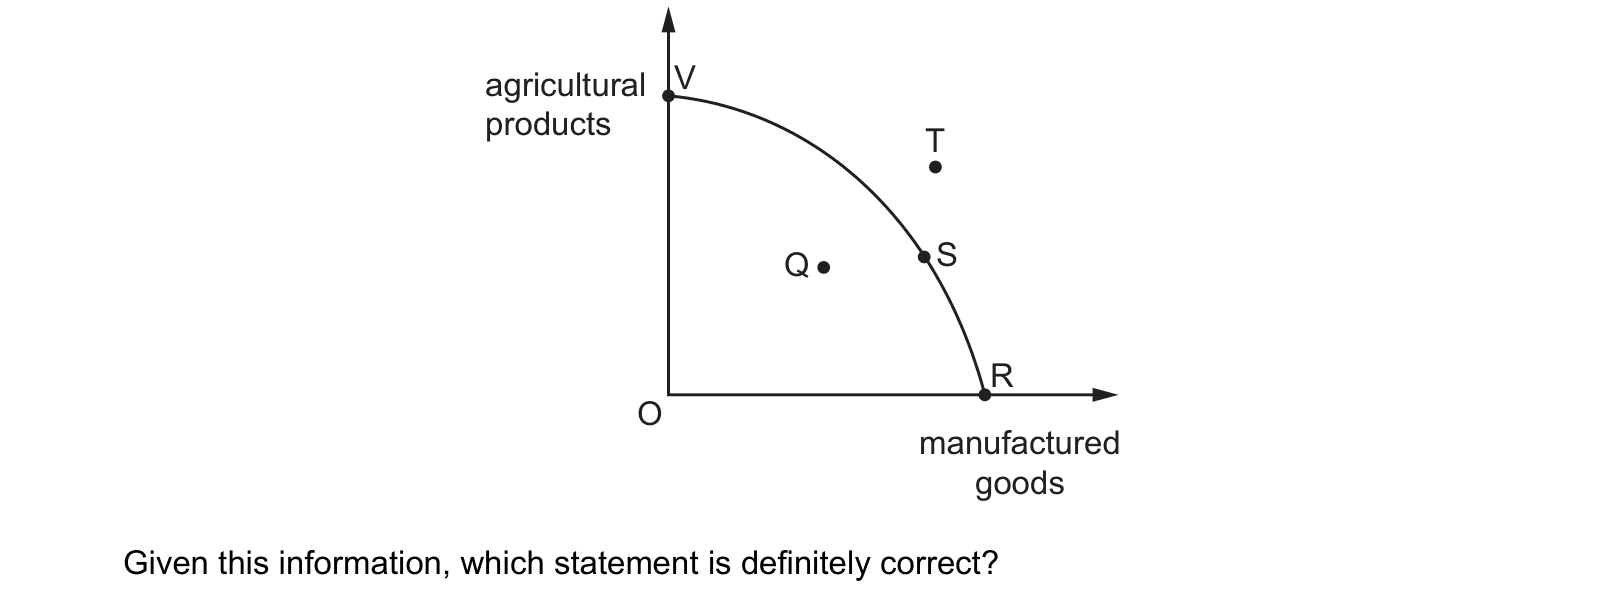
A country can produce manufactured goods and agricultural products as shown in the diagram. agricultural V products T S Q R O manufactured goods Given this information, which statement is definitely correct?
Answer: A.
Critical distinction
Movement along = different mix.
Inside to curve = better use.
Shift = different capacity.
What the syllabus asks for on this topicOfficial syllabus coverage · Product mastery map
Official syllabus coverage
Students must understand:
- 1.5.1 the nature and meaning of a production possibility curve (PPC);
- 1.5.2 the shape of a PPC:
- constant opportunity costs;
- increasing opportunity costs;
- 1.5.3 the causes and consequences of shifts in a PPC;
- 1.5.4 the significance of a position within a PPC.
Product mastery map
The four official statements are split into six measurable portal skills:
- meaning and assumptions of a PPC;
- positions on, inside and outside a PPC;
- movements along a PPC and opportunity cost;
- constant versus increasing opportunity cost;
- causes and consequences of PPC shifts;
- productive capacity versus resource utilisation.
Related CIE 9708 topics
Not the topic you were looking for? Describe what you are stuck on in your own words and we will take you to the notes that answer it.