Methods and Effects of Government Intervention in Markets
Contents: 34 sections
Cambridge International AS & A Level Economics 9708
Topic 3.1 explained why governments may intervene. Topic 3.2 explains the main methods, how they change market outcomes, who gains and loses, and why the intended objective may not be fully achieved.
The topic in one analytical framework
For every intervention, ask:
- Objective: What problem is government trying to address?
- Mechanism: Which curve, legal constraint or decision changes?
- Market outcome: What happens to price and quantity?
- Incidence: Who receives the benefit or bears the burden?
- Government finance: Is there revenue or expenditure?
- Intended effects: How might the objective be achieved?
- Unintended effects: What new problem may appear?
- Evaluation: Does effectiveness depend on elasticity, time, enforcement, information or policy design?
A high-quality answer follows the chain rather than listing advantages and disadvantages without explanation.
1. Specific indirect taxes
Definition
A specific indirect tax is a fixed tax charged per unit of a good or service sold.
Examples:
- £2 per packet;
- $0.20 per litre;
- €10 per tonne.
It differs from an ad valorem tax, which is charged as a percentage of value. The official AS syllabus point is specifically about specific indirect taxes.
Who legally pays and who economically bears the tax?
The government may legally collect the tax from producers or sellers. However, the economic burden can be shared between:
- consumers, through a higher price paid;
- producers, through a lower price received after tax.
This sharing is called tax incidence.
2. Tax diagram mechanics
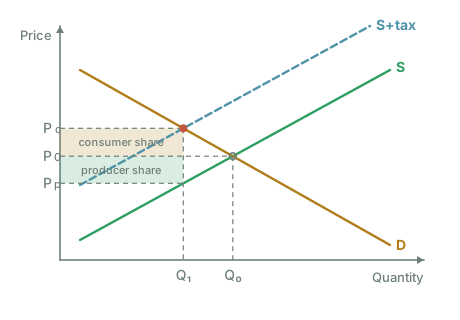
A specific tax raises the cost of supplying each unit by the same amount.
On a standard demand-and-supply diagram:
- the supply curve shifts vertically upwards/left from
StoS + tax; - the vertical distance between the two supply curves equals the tax per unit;
- equilibrium quantity falls from
QetoQt; - the price paid by consumers rises from
PetoPc; - the price received by producers after tax falls from
PetoPp; Pc − Ppequals the tax per unit.
Full chain
- Specific tax increases firms' cost per unit
- supply shifts upward/left
- a shortage exists at the original price
- market price rises
- quantity demanded contracts and quantity supplied expands along the new supply curve
- a new equilibrium forms at a higher consumer price and lower quantity.
Essential labels
A complete diagram should identify:
- original supply
S; - taxed supply
S + tax; - demand
D; - original equilibrium
Pe, Qe; - consumer price after tax
Pc; - producer net price after tax
Pp; - post-tax quantity
Qt; - tax wedge
Pc − Pp.
3. Tax revenue and burden calculations
Government tax revenue
The relevant quantity is the quantity sold after the tax, not the original quantity.
Consumer burden
Producer burden
Total burden
= tax per unit × Qt
Worked example
Before tax:
- equilibrium price = £8;
- equilibrium quantity = 1,000.
After a £3 tax:
- consumers pay £10;
- producers receive £7;
- quantity falls to 800.
Then:
- government revenue = £3 × 800 = £2,400;
- consumer burden = (£10 − £8) × 800 = £1,600;
- producer burden = (£8 − £7) × 800 = £800.
Consumers bear two-thirds of the burden in this example.
4. Tax incidence and elasticity
The side of the market that is less price elastic bears the larger share of the tax burden.
Why?
The less elastic side changes quantity less readily and has less ability to avoid the tax by changing behaviour.
Relatively inelastic demand
Consumers are not very responsive to price.
Result:
- consumer price rises by a large amount;
- producer net price falls by a smaller amount;
- consumers bear more of the tax.
Examples may include necessities with few substitutes, depending on context.
Relatively elastic demand
Consumers respond strongly to price.
Result:
- firms cannot pass much of the tax forward without losing many sales;
- producer net price falls more;
- producers bear more of the tax.
Relatively inelastic supply
Producers cannot reduce output easily.
Result:
- producers bear more of the tax through a lower net price.
Relatively elastic supply
Producers can withdraw or redirect supply easily.
Result:
- consumers bear more through a higher price.
Extreme cases
- perfectly inelastic demand
- consumers bear the entire tax
- perfectly elastic demand
- producers bear the entire tax
- perfectly inelastic supply
- producers bear the entire tax
- perfectly elastic supply
- consumers bear the entire tax.
Core exam rule
Do not say that the side that legally sends the payment to government necessarily bears the tax. Legal incidence and economic incidence can differ.
5. Intended effects of a specific indirect tax
Government may use a tax to:
- reduce consumption of a demerit good;
- reduce production or consumption associated with wider costs;
- raise revenue;
- change relative prices;
- encourage substitution towards less harmful alternatives.
When is a tax more effective at reducing quantity?
A tax causes a larger percentage fall in quantity where demand and/or supply are more elastic over the relevant range.
If demand is highly inelastic:
- price may rise substantially;
- quantity may fall only slightly;
- revenue may be high;
- the consumption objective may be weakly achieved.
Short run versus long run
Demand may become more elastic over time as consumers:
- find substitutes;
- change habits;
- replace equipment;
- relocate;
- acquire more information.
Therefore, a tax may have a stronger quantity effect in the long run.
6. Evaluation of specific indirect taxes
Possible advantages
- uses the price mechanism rather than banning consumption;
- creates an incentive to reduce harmful activity;
- raises government revenue;
- can be adjusted by product or harm level;
- encourages innovation and substitution;
- can make consumers and producers face more of the social cost.
Possible disadvantages
- may be regressive if low-income households spend a larger share of income on the taxed good;
- may reduce quantity very little when demand is inelastic;
- may encourage smuggling, avoidance or illegal markets;
- can affect workers and producers as well as consumers;
- government may estimate the appropriate tax incorrectly;
- administrative and enforcement costs arise;
- consumers may switch to another harmful product;
- revenue and health/environmental objectives can conflict.
Strong judgement conditions
A tax is more likely to be effective when:
- the harmful activity can be measured and taxed accurately;
- legal substitutes are available;
- enforcement is credible;
- the tax is large enough to change relative prices;
- complementary information or regulation is used;
- the burden on vulnerable households is considered.
7. Subsidies
Definition
A subsidy is a payment or financial support from government that lowers the cost of production or consumption.
For diagram analysis, a per-unit producer subsidy is commonly used.
Government may subsidise:
- producers;
- consumers;
- training;
- research and development;
- merit goods;
- environmentally preferred products;
- strategically important industries.
8. Subsidy diagram mechanics
A per-unit subsidy lowers the effective cost of supplying each unit.
On a demand-and-supply diagram:
- supply shifts vertically down/right from
StoS − subsidy; - the vertical distance equals the subsidy per unit;
- equilibrium quantity rises from
QetoQs; - the price paid by consumers falls from
PetoPc; - the price received by producers including subsidy rises from
PetoPp; Pp − Pcequals the subsidy per unit.
Full chain
- Subsidy lowers firms' effective cost per unit
- supply shifts down/right
- a surplus exists at the original price
- market price falls
- quantity demanded expands and quantity supplied contracts along the subsidised supply curve
- a new equilibrium forms at a lower consumer price and higher quantity.
Important producer-price distinction
The market price paid by consumers is not the producer's total receipt.
Producer receipt per unit after subsidy is:
9. Subsidy cost and incidence
Government expenditure
= subsidy per unit × post-subsidy quantity
Benefit split
The benefit is shared between:
- consumers, through the fall in price;
- producers, through the rise in net receipt.
The less elastic side receives the larger share of the subsidy benefit.
Relatively inelastic demand
Consumers change quantity little. Producers tend to gain more through a higher net receipt.
Relatively elastic demand
Consumers are sensitive to price. A larger part of the subsidy tends to appear as a lower consumer price.
Relatively inelastic supply
Producers cannot expand output much. Producers tend to gain more.
Relatively elastic supply
Firms expand readily, so consumers tend to gain more through lower prices and a larger quantity response.
Worked example
A £4 subsidy per unit causes:
- consumer price to fall from £12 to £10;
- producer receipt to rise from £12 to £14;
- quantity to rise from 500 to 700.
Then:
- government cost = £4 × 700 = £2,800;
- consumer benefit per unit = £2;
- producer benefit per unit = £2;
- the per-unit benefit is split equally in this example.
10. Intended effects and evaluation of subsidies
Possible objectives
- increase consumption of merit goods;
- make essential goods more affordable;
- encourage production with wider benefits;
- support employment or strategic capacity;
- accelerate adoption of new technology;
- reduce the price of substitutes for harmful products.
Possible advantages
- lowers consumer price;
- raises quantity consumed and produced;
- increases producer revenue or net receipt;
- preserves consumer choice;
- can encourage investment and innovation;
- may generate wider benefits.
Possible disadvantages
- creates government expenditure and opportunity cost;
- may be captured mainly by producers or consumers depending on elasticities;
- can subsidise people who would have purchased anyway;
- may encourage overproduction or dependence;
- may protect inefficient firms;
- requires information to set the correct amount;
- removal can create political and market disruption;
- fraud and administrative cost may occur.
Evaluation conditions
A subsidy is more convincing when:
- the target activity creates substantial benefit;
- low consumption is caused by price rather than only preferences;
- supply can expand without severe bottlenecks;
- support is targeted at consumers or producers who change behaviour;
- outcomes are monitored;
- the fiscal cost is sustainable.
11. Tax versus subsidy
| Feature | Specific indirect tax | Per-unit subsidy |
|---|---|---|
| Supply shift | Up/left | Down/right |
| Consumer price | Rises | Falls |
| Producer net receipt | Falls | Rises |
| Equilibrium quantity | Falls | Rises |
| Government finance | Revenue | Expenditure |
| Typical objective | Reduce activity | Increase activity |
| Distribution | Burden split by PED/PES | Benefit split by PED/PES |
Evaluation insight
Taxes and subsidies do not automatically achieve opposite outcomes of equal size. Results depend on:
- elasticities;
- initial market conditions;
- policy size;
- enforcement;
- expectations;
- time period;
- complementary policies.
12. Direct provision of goods and services
Definition
Direct provision occurs when government itself supplies, finances or arranges the delivery of a good or service rather than relying entirely on private market provision.
Examples can include:
- national defence;
- state education;
- public healthcare;
- public libraries;
- vaccination programmes;
- emergency services.
Direct provision can be:
- free at the point of use;
- partly charged;
- universal;
- means-tested;
- delivered by public employees;
- purchased by government from private providers.
Reasons
- public-good non-provision;
- merit-good under-consumption;
- affordability and equity;
- minimum service standards;
- geographical access;
- emergency or strategic capacity.
13. Effects of direct provision
Potential benefits
- ensures provision where voluntary payment fails;
- increases access for low-income households;
- can raise consumption of merit goods;
- may improve equality of opportunity;
- can coordinate national standards;
- may exploit scale economies;
- can preserve services in unprofitable regions.
Potential limitations
- financed through taxation, borrowing or reduced spending elsewhere;
- opportunity cost of public resources;
- demand may exceed available capacity when price is zero or low;
- queues and waiting times may replace market rationing;
- quality may vary;
- weak competitive pressure may reduce efficiency;
- government may misjudge preferences or required capacity;
- universal provision may subsidise high-income users unnecessarily;
- private providers may be crowded out.
Evaluation questions
- Is the service a genuine public good or a merit/private service?
- Is universal or targeted provision more appropriate?
- Can quality be measured?
- Is capacity sufficient?
- Would vouchers, subsidies or contracting achieve the objective at lower cost?
- How is the service financed?
14. Maximum prices
Definition
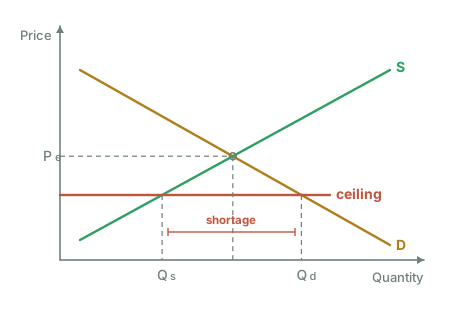
A maximum price, or price ceiling, is a legal price above which a good or service cannot be sold.
Binding condition
Cambridge calls a control that actually bites an effective price control, and papers use that word rather than "binding". An effective maximum price is set below the equilibrium and an effective minimum price is set above it. A maximum price above the equilibrium, or a minimum below it, has no effect at all and is not effective.
A maximum price affects the market only if it is set below the equilibrium price.
If set above equilibrium; it is non-binding and has no direct effect.
Diagram effect
At a binding maximum price Pmax:
- quantity demanded rises from
QetoQd; - quantity supplied falls from
QetoQs; - excess demand / shortage =
Qd − Qs.
Intended objectives
- improve affordability;
- protect low-income consumers;
- prevent emergency price spikes;
- restrain market power;
- maintain access to essentials.
15. Effects and evaluation of maximum prices
Potential benefits
- lower legal price for consumers who obtain the product;
- improved affordability for some households;
- may limit extreme or exploitative prices;
- can have visible short-run equity benefits.
Potential unintended effects
- shortage;
- queues and waiting lists;
- non-price rationing;
- discrimination or favouritism by sellers;
- black markets at higher prices;
- side payments;
- lower quality;
- reduced maintenance and investment;
- conversion to uncontrolled alternatives;
- inefficient allocation to those who queue rather than those with greatest need.
Who gains and loses?
Potential gainers:
- consumers who successfully buy at the controlled price.
Potential losers:
- consumers unable to obtain the product;
- producers receiving a lower price and selling less;
- future consumers if supply and investment fall;
- taxpayers if government adds subsidies or direct provision.
Strong evaluation
Effectiveness depends on:
- size of the gap below equilibrium;
- PED and PES;
- enforcement;
- duration;
- availability of substitutes;
- whether supply is supported;
- the rationing system used.
A modest temporary ceiling with targeted supply support may have different results from a severe permanent ceiling.
16. Minimum prices
Definition
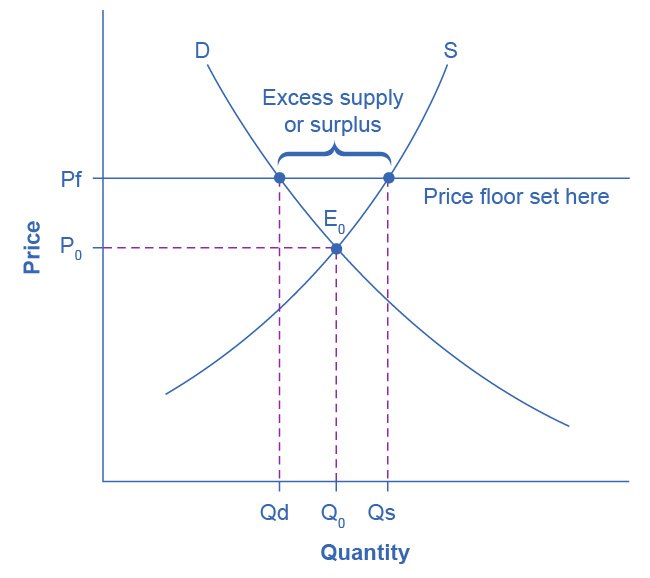
A minimum price, or price floor, is a legal price below which a good or service cannot be sold.
Binding condition
A minimum price affects the market only if it is set above the equilibrium price.
If set below equilibrium; it is non-binding.
Diagram effect
At a binding minimum price Pmin:
- quantity supplied rises from
QetoQs; - quantity demanded falls from
QetoQd; - excess supply / surplus =
Qs − Qd.
Possible objectives
- protect producer income;
- stabilise agricultural markets;
- prevent prices considered unfairly low;
- preserve employment or strategic capacity;
- discourage consumption where a high legal price is combined with other controls.
17. Effects and evaluation of minimum prices
Potential benefits
- higher price for units actually sold;
- may protect producer revenue and confidence;
- can preserve investment and future capacity;
- can reduce consumption of a harmful product in some designs;
- may support regional employment.
Potential unintended effects
- surplus production;
- consumers pay a higher price and buy less;
- not every producer necessarily sells more;
- government may have to purchase surplus;
- storage, administration and disposal costs;
- waste or environmental damage;
- incentive to overproduce;
- inefficient firms may remain in the market;
- imports or illegal discounting may increase.
Producer revenue is not automatically higher
Revenue depends on:
A higher price can coexist with lower sales. If government guarantees purchase of the surplus, producer revenue may rise but public expenditure and stock costs also rise.
Evaluation conditions
- how far the floor is above equilibrium;
- elasticity of demand and supply;
- whether surplus is purchased;
- storage and disposal feasibility;
- whether support is temporary or permanent;
- impact on consumers and taxpayers;
- risk of international trade distortion.
18. Maximum versus minimum prices
| Feature | Maximum price | Minimum price |
|---|---|---|
| Binding position | Below equilibrium | Above equilibrium |
| Immediate market imbalance | Shortage | Surplus |
| Intended beneficiary | Consumers | Producers / workers |
| Consumer price | Lower | Higher |
| Quantity demanded | Higher | Lower |
| Quantity supplied | Lower | Higher |
| Main risk | Queues, black markets, low supply | Surplus, public cost, waste |
Core exam trap
Do not label the shortage or surplus backwards.
- ceiling below equilibrium
- shortage
- floor above equilibrium
- surplus.
19. Buffer stock schemes
Definition
A buffer stock scheme is a system in which an authority buys and sells stocks of a storable commodity to reduce price fluctuations.
The authority usually defines a desired price band:
- a lower intervention price / floor;
- an upper intervention price / ceiling.
Operation when price is too low
If market supply is high or demand is weak and price falls towards/below the lower limit:
- the authority buys the excess supply;
- demand in the market effectively increases;
- stocks are added to storage;
- price is supported.
Operation when price is too high
If market supply is low or demand is strong and price rises towards/above the upper limit:
- the authority releases stock for sale;
- market supply effectively increases;
- stock levels fall;
- price is restrained.
Objective
The aim is price stability rather than permanently maximising producer or consumer welfare.
20. Conditions for a successful buffer stock
A scheme is more likely to work when:
- the commodity can be stored;
- storage losses are limited;
- the authority has sufficient starting stock;
- the authority has sufficient finance;
- the price band is realistic;
- shocks are temporary rather than a permanent trend;
- market data and forecasts are reasonably accurate;
- producers do not respond with excessive long-run overproduction.
Self-financing possibility
In principle, the authority buys when prices are low and sells when prices are high.
However; it may not be self-financing because of:
- storage cost;
- spoilage;
- administrative cost;
- buying more than it can later sell;
- persistent market trends;
- political pressure to set an unrealistic floor.
21. Advantages and disadvantages of buffer stocks
Possible advantages
- protects producers from severe price collapses;
- protects consumers from extreme price spikes;
- stabilises income and planning;
- may support investment;
- may improve food or commodity security;
- releases physical supply during shortages.
Possible disadvantages
- expensive storage;
- perishable products may deteriorate;
- authority may run out of stock during repeated shortages;
- authority may run out of finance during repeated surpluses;
- incorrect price band distorts market signals;
- producers may overproduce because downside risk is reduced;
- disposal of stock may be wasteful;
- difficult to distinguish temporary from structural change;
- international coordination problems may occur.
Diagram caution
A buffer-stock diagram should show a price band and government buying/selling logic. It is not simply the same as a permanent minimum price.
22. Provision of information
Definition
Government information provision attempts to improve decisions by supplying, requiring or communicating information to consumers and producers.
Examples:
- health campaigns;
- nutrition labels;
- cigarette warnings;
- energy-efficiency labels;
- school-performance information;
- public comparison websites;
- financial-risk disclosure;
- environmental labelling.
Intended mechanism
For a merit good:
- information raises awareness of benefits
- demand may shift right
- quantity consumed rises.
For a demerit good:
- information raises awareness of costs
- demand may shift left
- quantity consumed falls.
Information may also improve quality competition by making products easier to compare.
23. Evaluation of information provision
Possible advantages
- preserves consumer choice;
- can be less coercive than bans or regulation;
- may be relatively low-cost;
- addresses imperfect information directly;
- can complement taxes, subsidies and provision;
- may create long-run changes in norms and habits.
Possible limitations
- consumers may already know the information;
- addiction or habit may dominate information;
- low income can still prevent merit-good consumption;
- messages may be ignored or misunderstood;
- information overload;
- low literacy or language barriers;
- government credibility may be weak;
- firms may respond with misleading claims;
- effects can take time;
- measuring causation is difficult.
Policy-design questions
- Is the source trusted?
- Is the message clear and salient?
- Does it reach the target group?
- Is behaviour constrained by price or access rather than information?
- Should labels be mandatory?
- Is personalised information more effective than a general campaign?
- Is another intervention needed alongside information?
24. Comparing the six methods
| Method | Main mechanism | Typical intended effect | Major limitation |
|---|---|---|---|
| Specific tax | Raises per-unit cost | Higher price, lower quantity, revenue | Regressive/avoidance; weak quantity effect if inelastic |
| Subsidy | Lowers effective cost | Lower price, higher quantity | Fiscal cost and poor targeting |
| Direct provision | Government supplies or finances output | Ensures access/provision | Opportunity cost, capacity and efficiency |
| Maximum price | Legal ceiling below equilibrium | Lower legal price | Shortage and non-price rationing |
| Minimum price | Legal floor above equilibrium | Higher supported price | Surplus and public/storage cost |
| Buffer stock | Government buys low and sells high | Price stability | Finance, stock and forecasting constraints |
| Information | Changes knowledge/perceptions | Demand shifts towards preferred level | May not overcome price, addiction or habits |
The table contains seven rows because maximum and minimum prices are separate applications within the official price-control requirement.
25. Choosing the most appropriate method
If the main problem is non-provision of a pure public good
Direct provision financed by taxation is often the clearest method because information or subsidy may not solve non-excludability.
If a merit good is under-consumed because it is expensive
A subsidy or direct provision may be more relevant than information alone.
If under-consumption is mainly caused by ignorance
Information may be relatively targeted and choice-preserving.
If a demerit good is over-consumed and demand is inelastic
A tax may raise revenue but reduce quantity only modestly in the short run. Information, regulation or support for substitutes may be needed alongside it.
If an essential price is temporarily extreme
A maximum price may help some consumers but needs a credible rationing and supply plan.
If agricultural prices fluctuate around a sustainable long-run level
A buffer stock may help if the product is storable and the authority has finance and stock.
If there is a permanent structural surplus
A buffer stock is unlikely to solve the underlying problem indefinitely.
26. Government failure and unintended consequences
At AS Level, evaluation should recognise that government may not have perfect information.
Possible failures include:
- incorrect tax or subsidy size;
- policy capture by producers;
- administrative cost;
- fraud and evasion;
- unintended shortages or surpluses;
- black markets;
- poor targeting;
- long implementation lags;
- reduced innovation or competition;
- opportunity cost of public funds.
This does not prove that the market outcome is preferable. It means the actual policy outcome should be compared with:
- the original market problem;
- realistic alternatives;
- the cost of doing nothing.
27. Common examination traps
- A specific tax is a fixed amount per unit, not a percentage tax.
- The taxed supply curve shifts upward by the tax per unit.
- Consumers and producers can share a tax even when producers legally pay it.
- The less elastic side bears more of a tax.
- Government tax revenue uses post-tax quantity.
- A subsidy creates government expenditure, not revenue.
- Producers receive the consumer price plus the subsidy.
- The less elastic side receives more subsidy benefit.
- Direct provision is not limited to pure public goods.
- A maximum price is binding only below equilibrium.
- A binding maximum price creates a shortage.
- A minimum price is binding only above equilibrium.
- A binding minimum price creates a surplus.
- A higher minimum price does not guarantee every producer higher revenue.
- Buffer stocks require storable goods, finance and stock.
- Information does not solve inability to pay.
- A shift in demand following information is not a movement along demand.
- Intended effects should be separated from unintended effects.
- Effectiveness depends on PED, PES, time and enforcement.
- A market failure does not guarantee that every government method improves welfare.
28. Paper 1 calculation checklist
Tax
- calculate tax wedge:
Pc − Pp; - calculate revenue: tax per unit ×
Qt; - calculate consumer burden:
(Pc − Pe) × Qt; - calculate producer burden:
(Pe − Pp) × Qt; - compare burden shares.
Subsidy
- calculate subsidy wedge:
Pp − Pc; - calculate government cost: subsidy per unit ×
Qs; - calculate consumer benefit per unit:
Pe − Pc; - calculate producer benefit per unit:
Pp − Pe; - compare benefit shares.
Price controls
- maximum-price shortage:
Qd − Qs; - minimum-price surplus:
Qs − Qd.
29. Paper 2 model structures
Explain tax impact and incidence [8]
- define specific indirect tax;
- shift supply upward by tax amount;
- consumer price rises and quantity falls;
- producer net price falls;
- identify tax wedge;
- explain burden split;
- relate incidence to relative PED and PES;
- apply to context.
Explain subsidy impact [8]
- define subsidy;
- shift supply down/right;
- consumer price falls;
- producer net receipt rises;
- quantity rises;
- explain government expenditure;
- explain benefit incidence;
- apply to objective.
Discuss a maximum price [12]
Analysis:
- binding below equilibrium;
- lower price;
- demand rises;
- supply falls;
- shortage.
Evaluation:
- consumers who buy gain;
- others face queues or exclusion;
- black markets and quality;
- effect depends PED/PES and enforcement;
- supply support or targeting;
- conditional judgement.
Discuss a buffer stock [12]
Analysis:
- authority buys when price low;
- stores output;
- sells when price high;
- reduces fluctuations.
Evaluation:
- storability;
- finance and stock;
- temporary versus permanent shocks;
- forecasting;
- distorted incentives;
- conditional judgement.
30. Active recall
- Define a specific indirect tax.
- Explain why taxed supply shifts upward.
- Distinguish
Pc,PeandPp. - State the tax-revenue formula.
- Explain how PED affects tax incidence.
- Explain how PES affects tax incidence.
- Give three intended effects of a tax.
- Give three unintended effects of a tax.
- Define a subsidy.
- Explain why subsidised supply shifts down/right.
- State the subsidy-cost formula.
- Explain how elasticity affects subsidy incidence.
- Define direct provision.
- Give three benefits and three limitations of direct provision.
- State the condition for a binding maximum price.
- Explain the shortage created by a price ceiling.
- State the condition for a binding minimum price.
- Explain the surplus created by a price floor.
- Explain how a buffer stock supports a low price.
- Explain how a buffer stock restrains a high price.
- State four conditions for buffer-stock success.
- Explain how information can affect merit-good demand.
- Explain why information may fail for addictive goods.
- Distinguish intended and unintended effects.
- Choose the most suitable method for a public good and explain why.
31. One-minute revision summary
Specific tax
- Supply up/left
- consumer price rises
- producer net price falls
- quantity falls
- government receives revenue. Less elastic side bears more.
Subsidy
- Supply down/right
- consumer price falls
- producer receipt rises
- quantity rises
- government incurs expenditure. Less elastic side benefits more.
Direct provision
Government supplies or finances output to ensure provision or access, but tax, capacity and efficiency costs arise.
Maximum price
Binding below equilibrium → shortage.
Minimum price
Binding above equilibrium → surplus.
Buffer stock
Buy when price is low; sell when price is high. Success needs finance, stock, storage and a realistic price band.
Information
May shift demand towards a socially preferred level, but cannot necessarily overcome price barriers, addiction or habits.
Check you have it
Question 1
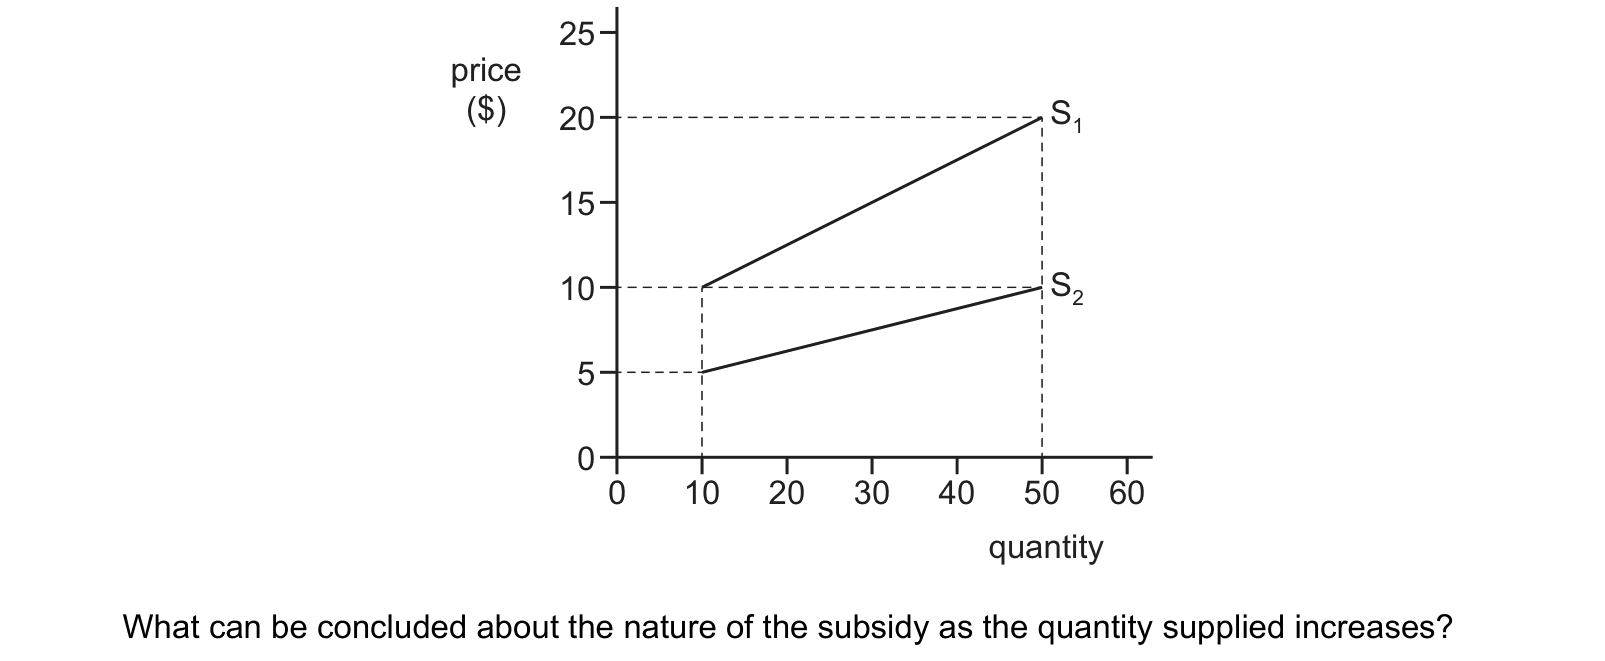
The diagram shows the effect on the supply curve of a product when the government provides a subsidy. What can be concluded about the nature of the subsidy as the quantity supplied increases?
Answer: B.
Question 2
The diagram shows the market for a product before and after the introduction of a subsidy. Which area represents the total amount paid in subsidies?
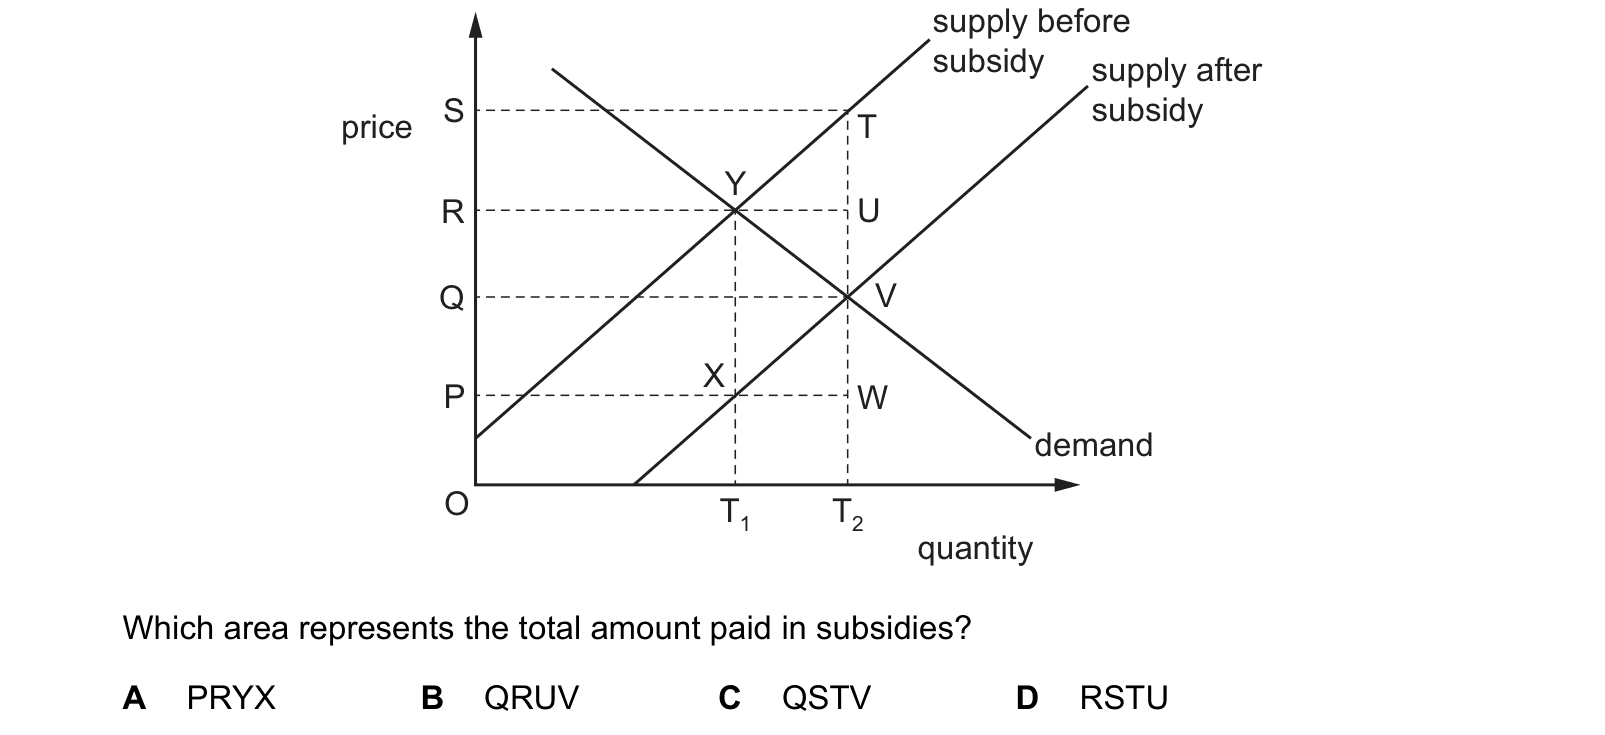
Answer: C.
Question 3
The market for good X is in equilibrium. A government then introduces an effective minimum price on good X. What will decrease as a result of this minimum price?
Answer: D.
Best evaluation sentence
The most appropriate method depends on the cause of the market problem, the relative elasticities, the time period, implementation quality and the scale of unintended consequences.
What the syllabus asks for on this topicOfficial syllabus coverage · Product mastery map
Official syllabus coverage
Students must understand:
- 3.2.1 the impact and incidence of specific indirect taxes;
- 3.2.2 the impact and incidence of subsidies;
- 3.2.3 direct provision of goods and services;
- 3.2.4 maximum and minimum prices;
- 3.2.5 buffer stock schemes;
- 3.2.6 provision of information.
Product mastery map
The six official requirements are separated into ten portal skills:
- mechanics and market impact of a specific indirect tax;
- tax incidence and the role of PED and PES;
- evaluation of indirect taxes;
- mechanics, incidence and market impact of subsidies;
- evaluation of subsidies;
- direct provision of goods and services;
- maximum-price analysis;
- minimum-price analysis;
- buffer-stock operation and evaluation;
- information provision and comparative policy evaluation.
Related CIE 9708 topics
Not the topic you were looking for? Describe what you are stuck on in your own words and we will take you to the notes that answer it.