Methods and Effects of Government Intervention in Markets Exam Questions
97 past-paper questions on this unit. Three of them are below. Answer on the page: each one is marked the moment you pick, the correct option is shown whether or not you found it, and the full explanation opens either way.
CIE 9708Paper 1 MCQsFree account
Methods and Effects of Government Intervention in Markets: three questions to try now
Real past-paper questions, the answer key from the mark scheme, and the explanation that goes with it. No account needed to answer them.
Question 1
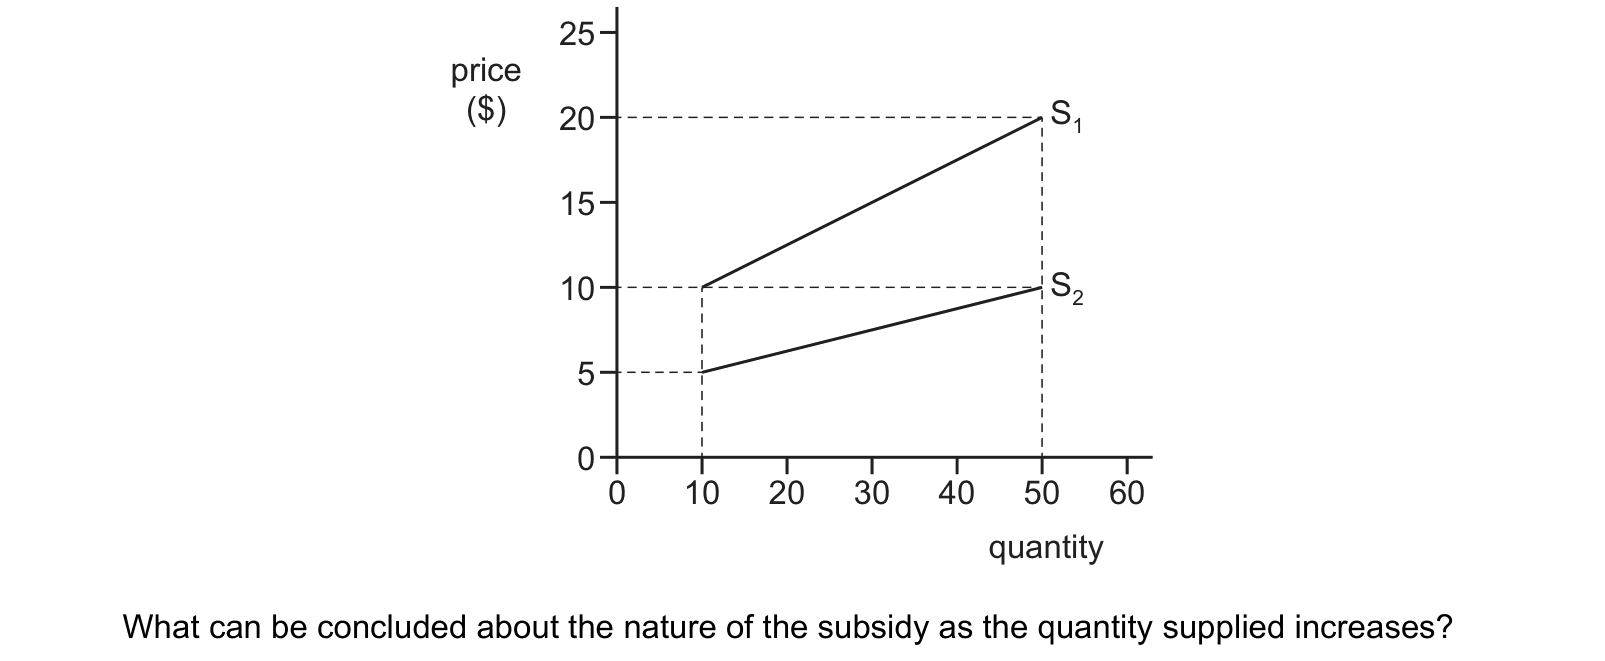
The diagram shows the effect on the supply curve of a product when the government provides a subsidy. What can be concluded about the nature of the subsidy as the quantity supplied increases?
Answer: B.
The vertical gap between the two supply curves is the subsidy per unit, so read that gap at two different quantities and see how it behaves. At a quantity of 10 the original curve sits at $10 and the subsidised curve at $5, so the subsidy is $5, which is half the $10 price. At a quantity of 50 the curves sit at $20 and $10, so the subsidy has doubled to $10, but that is still half the $20 price. The cash amount grows while the proportion stays at 50%, which is what a fixed PERCENTAGE subsidy looks like, so B is right. C would show as a gap of unchanging size, the same number of dollars at every quantity, and this gap clearly widens. A would need the proportion to shrink as quantity rose and D would need it to grow, and here it does neither; it is pinned at half the price throughout.
Question 2
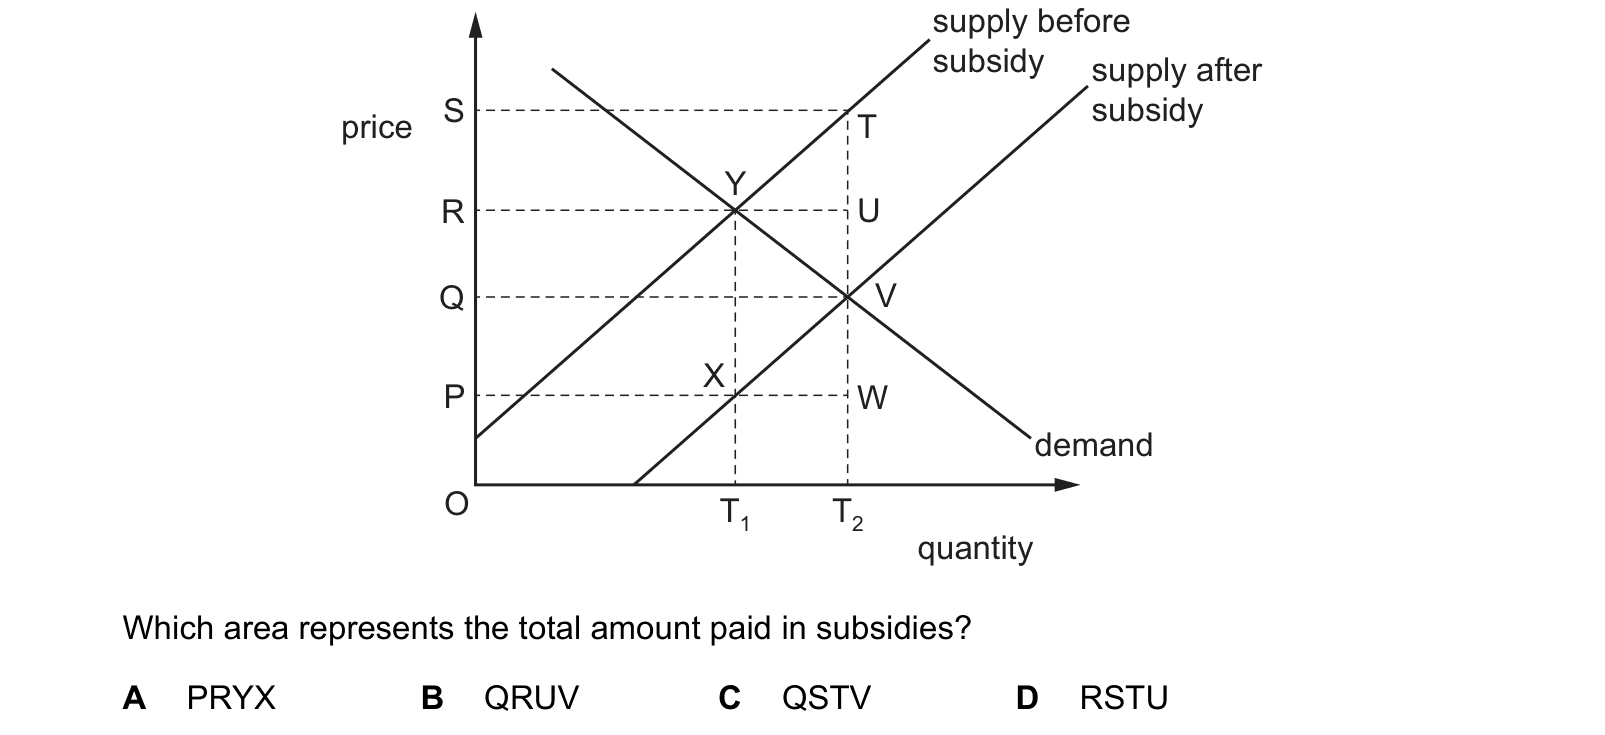
The diagram shows the market for a product before and after the introduction of a subsidy. Which area represents the total amount paid in subsidies?
Answer: C.
The government pays the subsidy on every unit that is actually traded once the subsidy is in place, so the total bill is the subsidy per unit multiplied by the NEW quantity. The new equilibrium is at V, where the subsidised supply curve meets demand, so the quantity is OT2 and consumers pay OQ. Producers receive that price plus the subsidy, which takes them up to T on the original supply curve at OS, so the subsidy per unit is QS. Multiplying QS by OT2 gives the rectangle QSTV, which is C. PRYX is measured at the OLD quantity OT1, so it is too narrow. QRUV is only the part of the subsidy that reaches consumers as a lower price, the fall from OR to OQ. RSTU is only the part that reaches producers as a higher receipt, the rise from OR to OS. QRUV and RSTU are the two halves of QSTV, and the question asks for the whole bill.
Question 3
The market for good X is in equilibrium. A government then introduces an effective minimum price on good X. What will decrease as a result of this minimum price?
Answer: D.
An effective minimum price is one set ABOVE the equilibrium, so buyers now face a higher price and cut back the quantity they buy. Consumer surplus is the area between the demand curve and the price paid, and it is squeezed from both sides at once: the remaining buyers pay more per unit and there are fewer units bought, so consumer surplus falls, which is D. A is wrong because excess supply rises from nothing to a genuine surplus, since producers offer more at the higher price while buyers want less. B is wrong because the market price is exactly what the intervention has raised. C is wrong because a higher price makes production more rewarding, so producers move up their supply curve and the quantity SUPPLIED rises; the quantity actually SOLD falls, but that is not what the option says.
These questions are drawn from past CIE 9708 papers and filtered to methods and effects of government intervention in markets. You answer, you find out immediately whether you were right, and you get the reasoning for the correct option and for each distractor. Wrong answers go to a mistakes locker so you can come back to exactly those.
Practice is free. You need an account only so your progress and your mistakes are still there next time.
These are the errors that cost marks on methods and effects of government intervention in markets, taken from our own topic notes. Read them before you practise and you will recognise the traps in the questions.
A specific tax is a fixed amount per unit, not a percentage tax.
The taxed supply curve shifts upward by the tax per unit.
Consumers and producers can share a tax even when producers legally pay it.
The less elastic side bears more of a tax.
Government tax revenue uses post-tax quantity.
A subsidy creates government expenditure, not revenue.
Producers receive the consumer price plus the subsidy.
The less elastic side receives more subsidy benefit.