The Reasons for International Trade
Contents: 10 sections
Cambridge International AS & A Level Economics 9708 (AS Level) Current syllabus: 2026–2028, Version 2 Official syllabus points: 6.1.1–6.1.4
Exam Essentials
1. Why countries trade
Countries trade because they differ in:
- natural-resource endowments;
- climate and geography;
- labour quantity, skills and wage costs;
- capital, technology and infrastructure;
- productivity and production costs;
- consumer preferences;
- the scale of their domestic markets.
These differences create opportunities for countries to specialise in goods and services they can produce at a lower opportunity cost and exchange them for other products.
An export is a good or service sold by residents of one country to non-residents. An import is a good or service bought by residents of one country from non-residents.
Free trade means international exchange with few or no artificial barriers such as tariffs, quotas or embargoes. Trade liberalisation is the process of reducing or removing such barriers.
Free trade does not mean trade has no real costs. Transport, insurance, information, finance and compliance costs can remain even when policy barriers are absent.
2. Absolute advantage
A country has an absolute advantage in a product when it can:
- produce more of that product using the same quantity of resources; or
- produce the same quantity using fewer resources.
Suppose one unit of resources can produce the following maximum outputs:
| Country | Wheat | Cars |
|---|---|---|
| Aralia | 80 | 20 |
| Borland | 60 | 15 |
Aralia has an absolute advantage in both products because it can produce more wheat and more cars with the same resources.
Absolute advantage compares productivity or resource requirements. It does not by itself identify the best pattern of specialisation.
3. Comparative advantage
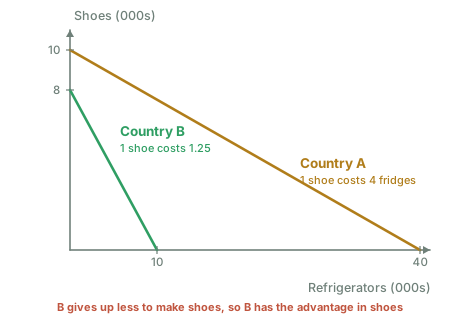
A country has a comparative advantage in a product when it can produce it at a lower opportunity cost than another country.
Comparative advantage is therefore about what must be sacrificed, not simply which country can produce the largest quantity.
Using the table above:
Aralia
- Opportunity cost of 1 car = 80 wheat ÷ 20 cars = 4 wheat.
- Opportunity cost of 1 wheat = 20 cars ÷ 80 wheat = 0.25 cars.
Borland
- Opportunity cost of 1 car = 60 wheat ÷ 15 cars = 4 wheat.
- Opportunity cost of 1 wheat = 15 cars ÷ 60 wheat = 0.25 cars.
Here the opportunity costs are identical. Neither country has a comparative advantage, so the simple model does not generate gains from specialisation between them.
Now change Borland’s car maximum to 10:
| Country | Wheat | Cars |
|---|---|---|
| Aralia | 80 | 20 |
| Borland | 60 | 10 |
- Aralia’s opportunity cost of 1 car = 4 wheat.
- Borland’s opportunity cost of 1 car = 6 wheat.
Aralia has the comparative advantage in cars because it sacrifices fewer units of wheat per car. Borland has the comparative advantage in wheat because:
- Aralia’s opportunity cost of 1 wheat = 0.25 cars;
- Borland’s opportunity cost of 1 wheat = 1/6 car, approximately 0.167 cars.
The central exam point
A country can have an absolute advantage in both products but cannot have a comparative advantage in both products in the standard two-country, two-good model when opportunity costs differ.
The less productive country can still gain from trade by specialising in the product for which its relative disadvantage is smallest.
Calculating Comparative Advantage
4. Output tables
When a table gives the maximum output possible with the same resources:
opportunity cost of one unit of X = maximum output of Y ÷ maximum output of X
Example:
| Country | Coffee | Textiles |
|---|---|---|
| C | 120 | 40 |
| D | 90 | 45 |
Country C
- 1 textile costs 120 ÷ 40 = 3 coffee.
- 1 coffee costs 40 ÷ 120 = 1/3 textile.
Country D
- 1 textile costs 90 ÷ 45 = 2 coffee.
- 1 coffee costs 45 ÷ 90 = 0.5 textile.
Country D has comparative advantage in textiles because 2 coffee is sacrificed rather than 3. Country C has comparative advantage in coffee because 1/3 textile is sacrificed rather than 0.5.
5. Input-requirement tables
When a table gives the resources or hours needed to produce one unit, a lower input requirement shows absolute advantage. Comparative advantage still requires opportunity-cost calculation.
Suppose:
| Country | Hours for 1 unit of software | Hours for 1 unit of food |
|---|---|---|
| E | 4 | 2 |
| F | 9 | 3 |
Country E has absolute advantage in both because it uses fewer hours.
For country E, 4 hours used on software could have made 2 units of food, so the opportunity cost of 1 software is 2 food.
For country F, 9 hours used on software could have made 3 units of food, so the opportunity cost of 1 software is 3 food.
E has comparative advantage in software. F has comparative advantage in food because the opportunity cost of food is lower there:
- E: 1 food costs 0.5 software;
- F: 1 food costs 1/3 software.
Common calculation trap
Do not select comparative advantage by looking only at the largest output or smallest input number. Always calculate opportunity cost.
Specialisation and the Gains from Trade
6. Specialisation
Specialisation occurs when a country concentrates more of its resources on producing a narrower range of goods and services.
Under the comparative-advantage model:
- lower opportunity cost
- specialisation
- higher combined output
- exchange
- consumption possibilities increase
Using the coffee and textiles example:
- C specialises more in coffee;
- D specialises more in textiles;
- combined production can rise because each product is increasingly produced where its opportunity cost is lower.
Specialisation need not be complete in the real world. A country may continue producing some of both goods because of increasing opportunity costs, security concerns, transport costs or the need to diversify.
7. Mutually beneficial terms of trade
The barter terms of trade in a two-good example are the rate at which one product exchanges for another.
For both countries to gain, the international exchange rate must lie between their domestic opportunity costs.
In the coffee-textiles example:
- C gives up 3 coffee to make 1 textile;
- D gives up 2 coffee to make 1 textile.
A mutually beneficial rate for 1 textile must therefore be between 2 and 3 coffee.
At 2.5 coffee per textile:
- C can import 1 textile for 2.5 coffee rather than sacrificing 3 coffee domestically;
- D can export 1 textile for 2.5 coffee rather than receiving the equivalent of only 2 coffee domestically.
At exactly one country’s opportunity cost, that country is indifferent and receives no gain from exchange. For both to obtain a positive gain, the rate should lie strictly inside the range.
8. Benefits of specialisation and free trade
Static gains
- Higher combined output Resources are allocated towards lower-opportunity-cost production.
- Consumption beyond domestic production possibilities Trade enables a country to consume combinations it could not produce alone.
- Lower prices Imports can be sourced from lower-cost producers.
- Greater consumer choice Households and firms gain access to products not available domestically.
- Access to raw materials and capital goods Firms can import inputs, machinery and components needed for production.
Dynamic gains
- Economies of scale Access to larger international markets can allow firms to spread fixed costs and use specialised production methods.
- Greater competition Exposure to imports may reduce domestic market power and create incentives to cut costs and innovate.
- Technology and knowledge transfer Imported capital goods, international supply chains and contact with foreign firms can spread production methods.
- Investment and growth Export opportunities can increase expected demand and encourage investment.
These gains are possible, not automatic. Their size depends on adjustment costs, market structure, institutions, infrastructure and the distribution of gains.
The Trading Possibility Curve
9. Meaning
A production possibility curve (PPC) shows combinations a country can produce using its own resources and technology.
A trading possibility curve (TPC) shows combinations a country can consume after specialising and trading at a given international exchange rate.
The TPC is also described as a consumption possibility line or post-trade consumption line.
10. How to construct and interpret it
A correct diagram should show:
- the domestic PPC;
- a production point chosen after specialisation;
- a trading line passing through that production point;
- the slope of the trading line determined by the international terms of trade;
- a possible consumption point on the trading line but outside the domestic PPC.
A point outside the PPC is unattainable through domestic production alone. It can become attainable for consumption because exports finance imports.
Essential distinction
The country produces at a point on its PPC and may consume at a different point on its TPC.
Do not say trade shifts the PPC outward. The PPC shifts only if resources, productivity or technology change. Trade expands consumption possibilities without necessarily changing productive capacity.
Why the TPC may not extend consumption possibilities
If the international exchange rate is no better than the country’s domestic opportunity cost, trade produces no gain. Transport costs and tariffs can also reduce or eliminate the effective gain.
Exports, Imports and the Terms of Trade
11. Meaning of the terms of trade
The terms of trade compare the prices a country receives for its exports with the prices it pays for its imports.
The standard index is:
terms of trade index = (export price index ÷ import price index) × 100
It is a price ratio. It is not:
- export volume divided by import volume;
- export value divided by import value;
- the trade balance;
- the current-account balance.
The index is normally expressed relative to a base year, often set equal to 100.
12. Measuring the terms of trade
Suppose:
- export price index = 126;
- import price index = 120.
Then:
terms of trade = (126 ÷ 120) × 100 = 105
This means the export-price-to-import-price ratio is 5% above its base-year ratio.
Improvement and deterioration
- The terms of trade improve when the index rises.
- The terms of trade deteriorate when the index falls.
An index above 100 does not necessarily mean the terms of trade are currently improving. It means the ratio is above the base-year ratio. The direction of movement requires comparison with another period.
Example:
- Year 1 index = 112;
- Year 2 index = 108.
The terms of trade have deteriorated even though the Year 2 index remains above 100.
13. Causes of changes in the terms of trade
The index rises when export prices increase relative to import prices. It falls when import prices increase relative to export prices.
Changes in world demand for exports
Greater demand for a country’s exports may raise export prices and improve its terms of trade, especially if export supply is relatively inelastic.
A fall in world demand may reduce export prices and worsen the terms of trade.
Changes in world supply
A disruption to the world supply of a product a country exports can raise its export price. A global shortage of an imported energy product can raise import prices and worsen the importing country’s terms of trade.
Productivity and production costs
Productivity growth may lower export prices. This can worsen the measured terms of trade while improving competitiveness, export volume and national income. A lower index is therefore not automatically harmful.
Higher domestic costs may raise export prices, but the final effect depends on whether foreign buyers remain willing to buy.
Inflation relative to trading partners
If domestic prices rise faster than foreign prices, export prices may rise relative to import prices. The measured terms of trade might improve, but international competitiveness may weaken and export volume may fall.
Exchange-rate changes
A depreciation often raises the domestic-currency price of imports. It may also change export prices depending on the currency in which contracts are set and how firms adjust their margins. The impact on the terms of trade is therefore not mechanically fixed.
Do not state that depreciation or devaluation must always worsen or improve the terms of trade.
Commodity-price changes
Countries dependent on a narrow range of commodity exports or imports can experience large terms-of-trade movements when world commodity prices change.
14. Impact of an improvement
An improvement means each unit of exports can purchase more imports, other things equal. Possible effects include:
- higher real purchasing power from export revenue;
- cheaper imported inputs if the improvement comes from lower import prices;
- a higher potential standard of living;
- lower imported inflation;
- increased real national income.
However, the result depends on the cause.
If the improvement comes from a rise in export prices:
- foreign demand may fall;
- export revenue could rise or fall depending on price elasticity of demand;
- export industries may lose output and employment;
- domestic firms may become less competitive.
If the improvement comes from falling import prices:
- consumers and importing firms benefit;
- domestic import-competing firms may face stronger competition.
15. Impact of a deterioration
A deterioration means a given quantity of exports buys fewer imports, other things equal. Possible effects include:
- lower real purchasing power;
- higher production costs if imported inputs become more expensive;
- imported inflation;
- pressure on real incomes;
- vulnerability for countries reliant on essential imports.
But a deterioration can also accompany stronger export competitiveness if export prices fall because productivity improves. Export volume and employment may rise enough to offset part of the adverse price-ratio effect.
Exam rule
Never conclude from the terms-of-trade index alone that welfare, export revenue or the current account must improve or deteriorate. State the cause, then analyse quantities, elasticities and affected groups.
Limitations of Absolute and Comparative Advantage
16. Simplifying assumptions
The basic model often assumes:
- two countries and two products;
- constant opportunity costs;
- full employment;
- perfect mobility of resources within countries;
- no mobility of resources between countries;
- no transport or transaction costs;
- free trade and no government intervention;
- perfect information;
- identical product quality;
- no external costs or benefits;
- fixed technology and resource endowments;
- gains can be considered without examining distribution.
These assumptions make the model clear but limit direct real-world application.
17. Adjustment costs and unemployment
Workers, capital and regions cannot always move quickly from contracting import-competing industries to expanding export industries.
Trade liberalisation may therefore create:
- structural unemployment;
- regional decline;
- retraining costs;
- stranded capital;
- temporary losses of income and tax revenue.
Long-run national gains can coexist with severe short-run losses for particular groups.
18. Increasing opportunity costs
Resources are not equally suited to all activities. As specialisation increases, progressively less suitable resources may be transferred, causing opportunity cost to rise.
This makes complete specialisation less likely and means curved PPCs may be more realistic than straight-line PPCs.
19. Economies of scale and imperfect competition
Comparative advantage is not the only source of trade. Countries with similar resources may trade differentiated products, and large firms may gain from economies of scale.
Market power also matters. A firm or country may capture a large share of the gains, while consumers or suppliers receive less.
20. Externalities, sustainability and strategic concerns
Market prices may omit:
- pollution;
- carbon emissions;
- resource depletion;
- labour-standard concerns;
- national-security value;
- supply-chain resilience.
A country may choose not to specialise fully in a strategically important product even if imports appear cheaper.
21. Dynamic comparative advantage
Comparative advantage can change through:
- education and training;
- infrastructure;
- investment;
- technological development;
- learning by doing;
- industrial policy;
- discovery or depletion of natural resources.
Treating current comparative advantage as permanent may trap a country in low-productivity activities. On the other hand, attempting to create a new advantage can waste resources if policy is badly designed.
22. Distribution of gains
A rise in total national income does not mean every person gains.
Possible winners include:
- consumers of cheaper imports;
- successful exporters;
- owners of expanding firms;
- workers whose skills are demanded.
Possible losers include:
- firms facing import competition;
- workers with industry-specific skills;
- regions dependent on declining sectors;
- groups harmed by environmental effects.
The model shows that gains are possible in aggregate. It does not prove that gains are equal, automatic or politically easy to achieve.
Full Worked Example
23. Identifying advantage and showing gains
Two countries can use their resources to produce either solar panels or tonnes of rice:
| Country | Solar panels | Rice |
|---|---|---|
| Lydon | 60 | 120 |
| Merin | 30 | 90 |
Step 1: Absolute advantage
Lydon can produce more of both products, so it has absolute advantage in both.
Step 2: Opportunity costs
Lydon:
- 1 solar panel costs 120 ÷ 60 = 2 tonnes of rice;
- 1 tonne of rice costs 60 ÷ 120 = 0.5 solar panels.
Merin:
- 1 solar panel costs 90 ÷ 30 = 3 tonnes of rice;
- 1 tonne of rice costs 30 ÷ 90 = 1/3 solar panel.
Step 3: Comparative advantage
- Lydon has comparative advantage in solar panels because 2 rice is less than 3.
- Merin has comparative advantage in rice because 1/3 panel is less than 0.5.
Step 4: Mutually beneficial exchange rate
For 1 solar panel, the exchange rate must lie between 2 and 3 tonnes of rice.
At 2.4 tonnes of rice per panel:
- Lydon receives 2.4 rice for a panel that costs it 2 rice to produce;
- Merin obtains a panel for 2.4 rice rather than sacrificing 3 rice domestically.
Both gain.
Step 5: Diagram interpretation
Each country produces closer to the product in which it has comparative advantage. The trading line through that production point has a slope reflecting 2.4 rice per panel. A consumption point outside the original PPC demonstrates the gain from trade.
Step 6: Evaluation
The predicted gain may be reduced by transport costs, tariffs, rising opportunity costs, unemployment during adjustment or unequal distribution. The model is a benchmark, not a guarantee.
Exam Mastery
24. Common mistakes
- Defining comparative advantage as producing more with fewer resources. That is absolute advantage.
- Choosing comparative advantage without calculating opportunity cost.
- Assuming the country with absolute advantage in both goods should make both.
- Saying trade shifts the PPC outward.
- Confusing the trading possibility curve with the production possibility curve.
- Calculating terms of trade as import prices divided by export prices.
- Treating a terms-of-trade index above 100 as proof it is currently improving.
- Confusing terms of trade with the balance of trade.
- Assuming an improvement is always beneficial.
- Copying past-paper questions or diagrams rather than using original assessment content.
25. Strong analysis chains
Comparative advantage
- Country A has a lower opportunity cost of machinery
- it specialises more in machinery
- Country B specialises more in food
- combined output rises
- an exchange rate between domestic opportunity costs allows both countries to consume beyond their domestic PPCs.
Terms-of-trade improvement from lower import prices
- import prices fall relative to export prices
- terms-of-trade index rises
- a given quantity of exports buys more imports
- imported inputs become cheaper
- real income and productive potential may rise, although import-competing firms face stronger competition.
Terms-of-trade deterioration from an energy-price shock
- energy import prices rise
- import price index rises relative to export price index
- terms of trade deteriorate
- more exports are needed to finance a given import volume
- firms face higher costs and households face lower real purchasing power.
Check you have it
Question 1
The European Union consists of a group of countries with free trade between its members and a common external tariff on trade with non-members. What would weaken the operation of this customs union?
Answer: D.
Explanation:
This option would weaken the operation of the customs union. The European Union operates as a customs union, which means that all member countries have a common external tariff on trade with non-members. If one member country agrees to a trade deal with a non-member country, it can potentially undermine the common trade policy of the entire EU. This could result in non-tariff barriers being introduced between the member countries, creating inconsistencies within the union and disrupting the principle of a common external tariff.
A devaluation of any member’s currency - This would not necessarily weaken the operation of the customs union. While devaluation could affect trade balances and competitiveness within the union, it would not directly impact the common external tariff or the functioning of the customs union.
Differences in wage costs between members - This may introduce competitive disparities within the union, but it would not directly weaken the operation of the customs union as long as the common external tariff is enforced and trade between members remains free.
Entry tests for seasonal migrant workers - This would be related more to labour market policies and movement of people rather than the functioning of the customs union. While it may have an impact on specific sectors or regions, it does not directly affect the operation of the customs union.
Therefore, the correct answer is D.
Question 2
In a recent year, Japanese car manufacturers agreed to limit exports of cars to the USA. Which form of protectionism is this?
Answer: D.
Explanation: Voluntary export restraint (VER) is a form of trade barrier by which a country agrees with exporting countries to limit the quantity of specific goods being exported to the former country for a specified period. In this case, Japanese car manufacturers agreed voluntarily to limit exports of cars to the USA, which aligns with the concept of voluntary export restraint. This is a common strategy used by exporting countries to avoid being subjected to more severe forms of trade barriers, such as tariffs or quotas. VERs are considered protectionist measures aimed at protecting domestic industries from foreign competition.
Question 3
Country P exports goods and imports goods. Export prices and import prices are set to an index of 100 in year 1. The table shows corresponding prices indices for years 2 and 3. year 2 year 3 export price index 120 132 import price index 110 121 Which statement is correct?

Answer: C.
Year 2: 120 / 110 x 100 = 109.1. Year 3: 132 / 121 x 100 = 109.1.
Between years 2 and 3 both indices rise by exactly 10% (120 to 132, and 110 to 121), so the ratio is unchanged and the terms of trade stay at 109.1. Between years 1 and 2 export prices rose 20% against a 10% rise in import prices, so the terms of trade improved. Improved, then unchanged: C.
B is the trap the question is built around. The absolute rise in export prices between years 2 and 3 (12 points) is larger than the rise in import prices (11 points), which looks like a further improvement, but the terms of trade depend on the RATIO, and proportionally the two rises are identical. A is wrong because the indices are all the information needed. D is wrong because years 1 to 2 are a clear improvement.
26. Evaluation framework
When evaluating free trade or a change in the terms of trade, ask:
- What caused the change?
- Is the effect short run or long run?
- What are the elasticities of demand and supply?
- How mobile are workers and capital?
- Are there transport or policy barriers?
- Are products homogeneous?
- Who gains and who loses?
- Are there externalities or strategic concerns?
- Can comparative advantage change over time?
A strong conclusion identifies the condition that matters most rather than merely listing advantages and disadvantages.
Final Summary
- Absolute advantage means producing more with the same resources or the same output with fewer resources.
- Comparative advantage means producing at lower opportunity cost.
- Comparative advantage, not absolute advantage, determines the simple model’s pattern of specialisation.
- A mutually beneficial exchange rate lies between the two countries’ opportunity costs.
- A trading possibility curve shows post-trade consumption possibilities and may extend beyond the domestic PPC.
- Terms of trade = export price index ÷ import price index × 100.
- An improvement means the index rises; a deterioration means it falls.
- The impact of a terms-of-trade change depends on its cause, elasticities, quantities and distribution.
- Free trade can increase output, choice, competition and dynamic efficiency, but adjustment costs and market imperfections matter.
- Absolute and comparative advantage are powerful benchmarks, not complete descriptions of real-world trade.
What the syllabus asks for on this topicCurrent Cambridge requirements
Current Cambridge requirements
This topic must cover:
- the distinction between absolute advantage and comparative advantage;
- the benefits of specialisation and free trade (trade liberalisation), including the trading possibility curve;
- exports, imports and the terms of trade, including measurement, causes of changes and impacts of changes;
- limitations of the theories of absolute and comparative advantage.
Related CIE 9708 topics
Not the topic you were looking for? Describe what you are stuck on in your own words and we will take you to the notes that answer it.