Consumer and Producer Surplus
Contents: 29 sections
The topic in one idea
Consumer surplus measures the gain buyers receive when they pay less than their maximum willingness to pay. Producer surplus measures the gain sellers receive when the market price is above the minimum price at which they are willing to supply.
At competitive market equilibrium, consumer and producer surplus together form total surplus.
1. Consumer surplus
Examination-ready definition
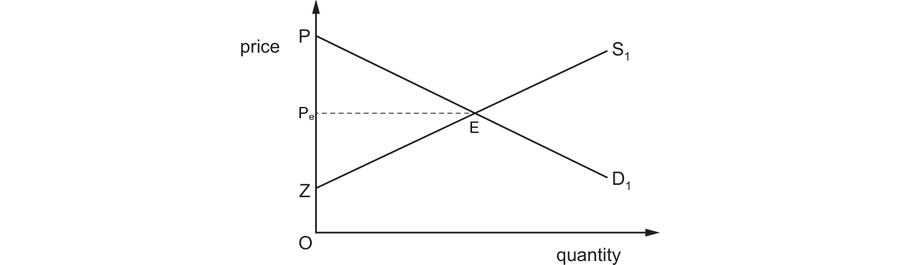
Consumer surplus is the difference between the maximum price consumers are willing and able to pay for a product and the price they actually pay.
Individual consumer surplus
Suppose a consumer is willing to pay £12 for a book but buys it for £8.
The consumer receives a net benefit of £4.
Market consumer surplus
On a market diagram, the demand curve represents consumers' willingness to pay for successive units.
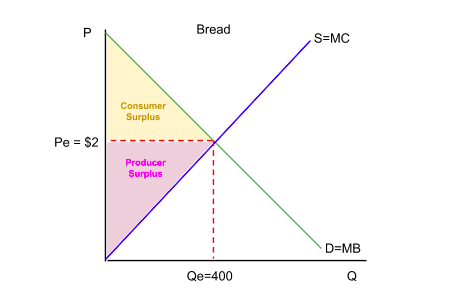
Consumer surplus is the area:
- below the demand curve;
- above the market price;
- from zero to the equilibrium quantity.
Why willingness to pay falls along a demand curve
Consumers normally value earlier units more highly than later units because of diminishing marginal benefit.
The demand curve therefore slopes downward, and buyers of all units pay the same market price even though some would have paid more.
2. Significance of consumer surplus
Consumer surplus can be used as an indicator of:
- benefit received by consumers;
- affordability relative to willingness to pay;
- gains from market exchange;
- changes in consumer welfare following price or market changes.
Important qualification
Consumer surplus is a monetary approximation of benefit. It does not perfectly measure welfare because:
- willingness to pay depends on income;
- people value products differently;
- preferences may be affected by imperfect information;
- external effects are not shown;
- essential goods may generate large benefit even for people with low ability to pay.
A wealthy person's willingness to pay may be higher because of income rather than because the product generates greater true welfare.
3. Producer surplus
Examination-ready definition
Producer surplus is the difference between the market price producers receive and the minimum price at which they are willing and able to supply the product.
The minimum acceptable price reflects the opportunity cost or marginal cost of supplying each unit in the simplified competitive model.
Individual producer surplus
A producer would have supplied a unit for £5 but receives the market price of £9.
Market producer surplus
On a market diagram, producer surplus is the area:
- above the supply curve;
- below the market price;
- from zero to the equilibrium quantity.
The supply curve represents the minimum price required to bring successive units to market.
4. Producer surplus is not the same as profit
This is a major examination trap.
Producer surplus is related to profit but is not identical to profit.
In a simplified model:
- producer surplus is revenue above variable or marginal cost;
- profit is total revenue minus total cost;
- total cost includes fixed cost as well as variable cost.
Therefore:
This relationship is a useful approximation where the supply curve reflects marginal variable cost.
A firm can earn positive producer surplus while making low or negative economic profit if fixed costs are high.
5. Consumer and producer surplus at equilibrium
At market equilibrium:
- quantity demanded equals quantity supplied;
- the equilibrium price is paid by consumers and received by producers;
- consumers whose willingness to pay is at least the market price purchase;
- producers whose minimum acceptable price is at or below the market price supply.
Total surplus
On the standard demand-and-supply diagram, total surplus is the area:
- below the demand curve;
- above the supply curve;
- up to the equilibrium quantity.
Efficiency significance
Under restrictive assumptions, competitive equilibrium maximises total surplus.
These assumptions include:
- no external costs or benefits;
- accurate information;
- competitive markets;
- no public-good problem;
- market demand reflecting social benefit;
- market supply reflecting social cost.
If these assumptions fail, maximum private surplus may not equal maximum social welfare.
6. Calculating surplus using triangles
Where demand and supply are straight lines, surplus is often triangular.
Triangle formula
Consumer surplus calculation
Suppose:
- maximum demand price at quantity zero = £20;
- equilibrium price = £12;
- equilibrium quantity = 100 units.
Producer surplus calculation
Suppose:
- equilibrium price = £12;
- supply intercept = £4;
- equilibrium quantity = 100 units.
Total surplus
Units
If price is measured in pounds per unit and quantity in units, surplus is measured in pounds.
Always state the correct monetary unit.
7. Surplus with rectangles and triangles
A change in price may create a surplus change containing:
- a rectangle representing the price change on units still traded;
- a triangle representing the change caused by additional or lost trades.
Students should not force every change into one triangle.
Example: fall in price
When price falls along a demand curve:
- existing buyers gain because they pay less for units they already purchased;
- additional buyers enter the market;
- consumer surplus rises by a rectangle plus a triangle.
The exact geometry depends on the diagram.
8. Price changes and consumer surplus
Price falls
A lower market price normally increases consumer surplus.
Reasons:
- consumers pay less for the original quantity;
- additional consumers may buy the product;
- the gap between willingness to pay and actual price increases.
Price rises
A higher market price normally reduces consumer surplus.
Reasons:
- consumers pay more for units still purchased;
- some buyers leave the market;
- the gap between willingness to pay and actual price narrows.
Important distinction
A movement along the demand curve caused by a price change is not the same as a shift of demand.
9. Price changes and producer surplus
Price rises
A higher price normally increases producer surplus because:
- producers receive more for units previously sold;
- additional higher-cost units may become profitable to supply.
Price falls
A lower price normally reduces producer surplus because:
- producers receive less for existing sales;
- some higher-cost producers or units leave the market.
10. Increase in demand
An increase in demand shifts the demand curve to the right.
Normally:
- equilibrium price rises;
- equilibrium quantity rises;
- producer surplus rises;
- the effect on consumer surplus is not determined by price alone because the demand curve itself has shifted.
Why consumer surplus may rise despite a higher price
Consumers have become more willing to pay or more numerous.
Although the market price rises, the outward demand shift can enlarge the area between demand and price.
Therefore, do not automatically state:
Higher price means consumer surplus must fall after an increase in demand.
The final consumer-surplus area must be read from the new demand curve and new price.
11. Decrease in demand
A decrease in demand normally causes:
- lower equilibrium price;
- lower equilibrium quantity;
- lower producer surplus;
- an ambiguous or diagram-dependent change in consumer surplus because both the demand curve and price change.
Again, compare the complete old and new areas.
12. Increase in supply
An increase in supply shifts the supply curve to the right.
Normally:
- equilibrium price falls;
- equilibrium quantity rises;
- consumer surplus rises;
- the effect on producer surplus is not determined by price alone because the supply curve itself has shifted.
Why producer surplus may rise despite a lower price
Lower costs or improved productivity may shift supply right.
Producers may sell a much larger quantity and face lower marginal costs. The new producer-surplus area may therefore be larger even though price is lower.
Do not rely on price alone when the supply curve shifts.
13. Decrease in supply
A decrease in supply normally causes:
- higher equilibrium price;
- lower equilibrium quantity;
- lower consumer surplus;
- a diagram-dependent change in producer surplus because price rises but the supply curve shifts inward.
Compare the complete old and new areas.
14. Simultaneous changes
Where demand and supply both shift:
- equilibrium price may rise, fall or remain unchanged;
- equilibrium quantity may rise, fall or be ambiguous;
- consumer and producer surplus depend on the relative size of both shifts.
A strong answer identifies what is certain and what is ambiguous.
Example:
- demand rises;
- supply rises.
Quantity definitely rises, but the effect on price and the division of surplus depends on which shift is larger.
15. PED and changes in consumer surplus
Price elasticity of demand affects how quantity demanded responds to price.
Relatively inelastic demand
Following an adverse supply shift:
- price tends to rise strongly;
- quantity tends to fall by less;
- consumers still purchase many units at a higher price;
- the loss of consumer surplus may be substantial.
Examples may include essential goods with few substitutes.
Relatively elastic demand
Following an adverse supply shift:
- price tends to rise by less;
- quantity tends to fall by more;
- consumers can switch away more easily.
The welfare change depends on the full geometry, but elasticity affects whether adjustment occurs mainly through price or quantity.
Careful language
Do not state that a particular elasticity always creates a larger surplus change without specifying:
- which curve shifts;
- the size of the shift;
- the initial equilibrium;
- the other curve's elasticity.
16. PES and changes in producer surplus
Price elasticity of supply affects how strongly output responds to price.
Relatively inelastic supply
Following an increase in demand:
- price tends to rise strongly;
- quantity rises by less;
- existing producers may gain a large price increase;
- producer surplus may rise substantially.
Relatively elastic supply
Following an increase in demand:
- quantity rises strongly;
- price rises by less;
- the surplus gain comes more through extra output than through a large price increase.
Again, the precise change depends on both demand and supply.
17. Distribution of gains between consumers and producers
The relative elasticities of demand and supply influence how total gains or losses are divided.
General principle:
The side of the market that is less responsive has fewer alternatives and may experience a larger price-related welfare effect.
This becomes especially important when studying:
- indirect taxation;
- subsidies;
- price controls;
- market shocks.
These policies are developed in Unit 3.
18. Consumer surplus and income distribution
Consumer surplus does not tell us whether distribution is fair.
A market can generate high total surplus while:
- low-income consumers are excluded;
- gains are concentrated among richer consumers;
- essential needs are unmet.
Efficiency and equity are different concepts.
A policy can reduce measured total surplus while improving equity, or increase total surplus while worsening distribution.
19. Producer surplus and firm differences
Producer surplus may be distributed unevenly.
Low-cost firms receive more surplus per unit than high-cost firms at the same market price.
Possible reasons for lower costs include:
- better technology;
- economies of scale;
- superior management;
- cheaper inputs;
- more productive workers;
- favourable location.
The area under the market price and above supply combines surplus across many producers and units.
20. Surplus and welfare evaluation
Consumer and producer surplus are useful because they:
- summarise gains from trade;
- allow diagrammatic comparison;
- help assess market changes;
- provide a basis for deadweight-loss analysis;
- link market equilibrium to efficiency.
But they have limitations:
- willingness to pay reflects ability to pay;
- supply may omit external cost;
- demand may omit external benefit;
- information may be imperfect;
- distribution is not shown;
- non-market values may be ignored.
A sophisticated judgement uses surplus as one measure, not a complete measure of social welfare.
21. Common examination traps
Trap 1: Consumer surplus is total spending
Wrong. Total spending is price multiplied by quantity. Consumer surplus is the extra benefit above what consumers pay.
Trap 2: Producer surplus is total revenue
Wrong. It is the amount above producers' minimum acceptable supply price.
Trap 3: Producer surplus always equals profit
Wrong. Fixed costs create a difference.
Trap 4: Consumer surplus lies below demand and below price
Wrong. It lies below demand and above price.
Trap 5: Producer surplus lies above supply and above price
Wrong. It lies above supply and below price.
Trap 6: Any higher price means consumer surplus falls
Only automatically true for a movement along an unchanged demand curve. If demand shifts, compare the new area.
Trap 7: Any lower price means producer surplus falls
Only automatically true for movement along an unchanged supply curve. If supply shifts, compare the new area.
Trap 8: Total surplus measures equality
Wrong. It measures gains from exchange, not distributional fairness.
Trap 9: A larger triangle always means a better social outcome
Not where externalities, imperfect information or inequality matter.
Trap 10: Elasticity changes only the slope, not surplus
Elasticity affects price and quantity responses and therefore the scale and distribution of surplus changes.
Trap 11: The demand curve measures cost
Demand represents willingness to pay or marginal benefit. Supply represents minimum acceptable price or marginal cost in the simplified model.
Trap 12: All surplus calculations are triangles
Some changes include rectangles and triangles.
22. Paper 1 technique
Typical tasks include:
- define consumer or producer surplus;
- identify shaded areas;
- calculate triangular areas;
- determine how a shift affects surplus;
- distinguish surplus from spending, revenue and profit;
- apply PED and PES.
Area-identification method
Consumer surplus:
- find the demand curve;
- find the market price;
- shade below demand and above price to equilibrium quantity.
Producer surplus:
- find the supply curve;
- find the market price;
- shade above supply and below price to equilibrium quantity.
Calculation method
- identify base = equilibrium quantity;
- identify height = vertical price difference;
- use one-half × base × height;
- state the monetary unit.
23. Paper 2 technique
Model four-mark answer: consumer surplus
Consumer surplus is the difference between the maximum price consumers are willing and able to pay and the price they actually pay. On a demand-and- supply diagram; it is the area below the demand curve and above the market price, up to the quantity traded. It measures part of the benefit consumers receive from exchange.
Model four-mark answer: producer surplus
Producer surplus is the difference between the market price received and the minimum price producers are willing and able to accept. On a diagram; it is the area above the supply curve and below the market price, up to the quantity traded. It is related to, but not identical to, profit.
Model eight-mark answer: increase in supply
An increase in supply shifts the supply curve to the right, reducing the equilibrium price and increasing equilibrium quantity. Consumer surplus rises because consumers pay a lower price for existing purchases and additional consumers enter the market. Producer surplus cannot be judged from the lower price alone because the supply curve has also shifted. If costs have fallen substantially and output expands strongly, producer surplus may rise even at a lower market price. The final effect depends on the size of the supply shift and the elasticities of demand and supply.
Evaluation structure
When evaluating surplus changes, consider:
- size and direction of curve shifts;
- PED and PES;
- short run versus long run;
- income distribution;
- external costs and benefits;
- whether the market is competitive.
24. Worked numerical example
Demand intercept = £30. Supply intercept = £6. Equilibrium price = £18. Equilibrium quantity = 80.
Consumer surplus
Producer surplus
Total surplus
25. Active recall
- Define consumer surplus.
- Define producer surplus.
- Where is consumer surplus on a diagram?
- Where is producer surplus on a diagram?
- What does the demand curve represent in surplus analysis?
- What does the supply curve represent?
- State the triangle-area formula.
- Why is producer surplus not identical to profit?
- What happens to consumer surplus when price falls along an unchanged demand curve?
- What happens to producer surplus when price rises along an unchanged supply curve?
- Why is the effect of a demand shift on consumer surplus not determined by price alone?
- Why is the effect of a supply shift on producer surplus not determined by price alone?
- How does inelastic demand affect adjustment to an adverse supply shift?
- How does elastic supply affect adjustment to increased demand?
- Define total surplus.
- Under what assumptions can equilibrium maximise total surplus?
- Why does consumer surplus not measure equity?
- How can external costs make private total surplus misleading?
- What is the difference between consumer surplus and expenditure?
- Give one limitation of willingness to pay as a welfare measure.
26. One-minute revision
Consumer surplus
Maximum willingness to pay minus actual price.
Area below demand and above market price.
Producer surplus
Market price minus minimum acceptable price.
Area above supply and below market price.
Total surplus
Consumer surplus plus producer surplus.
Price fall along unchanged curves
- consumer surplus rises;
- producer surplus falls.
Price rise along unchanged curves
- consumer surplus falls;
- producer surplus rises.
Curve shifts
Do not judge from price alone. Compare the complete old and new surplus areas.
Elasticity
PED and PES determine whether market adjustment occurs mainly through price or quantity and therefore affect the scale and distribution of surplus changes.
Check you have it
Question 1
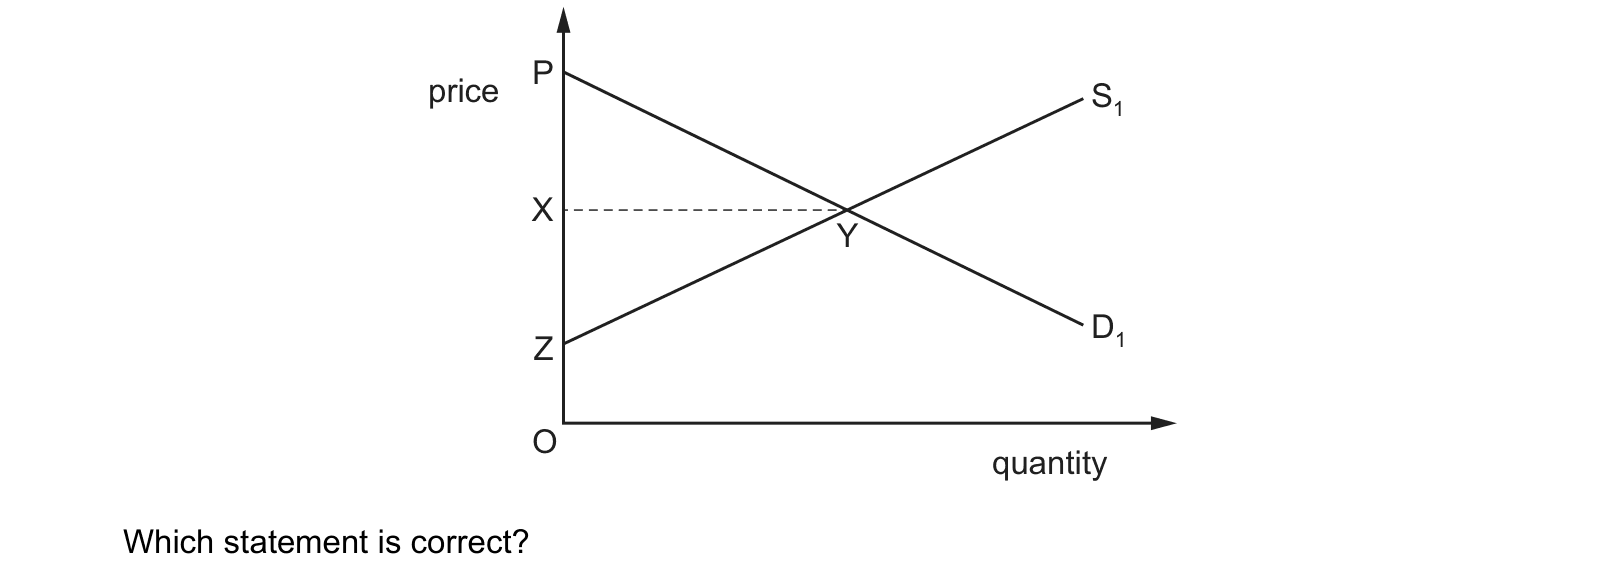
The diagram represents the market for a good. Which statement is correct?
Answer: D.
Question 2
Which statement correctly describes the area of producer surplus on a demand and supply diagram?
Answer: A.
Question 3
An increase in which variable will always lead to an increase in the consumer surplus?
Answer: D.
A subsidy lowers producers' costs, shifting the supply curve to the right. The equilibrium price falls and quantity rises. Consumer surplus is the area between the demand curve and the price line, so a lower price on a larger quantity enlarges it. This holds whatever the elasticities: the price can never rise following a subsidy, so consumer surplus always increases.
Why the other options are wrong:
- A, higher costs of production, shifts supply left. Price rises and consumer surplus falls.
- B, an increase in the maximum price, works against consumers. A binding maximum price sits below equilibrium and holds the price down; raising it lets the price rise towards equilibrium, so consumer surplus falls. (And once the ceiling exceeds equilibrium it stops binding altogether, so raising it further changes nothing.)
- C, an increase in the minimum price, is the clearest reduction. A binding price floor sits above equilibrium; raising it pushes the price further above the market-clearing level, cutting consumer surplus more.
Critical trap
Producer surplus is related to profit but is not the same as profit.
What the syllabus asks for on this topicOfficial syllabus coverage · Product mastery map
Official syllabus coverage
Students must understand:
- 2.5.1 the meaning and significance of consumer surplus;
- 2.5.2 the meaning and significance of producer surplus;
- 2.5.3 causes of changes in consumer and producer surplus;
- 2.5.4 the significance of price elasticity of demand and price elasticity of supply in determining the extent of these changes.
Product mastery map
The official syllabus statements are divided into seven measurable skills:
- meaning of consumer surplus;
- meaning of producer surplus;
- identifying surplus areas on a diagram;
- calculating consumer and producer surplus;
- analysing changes caused by price, demand and supply changes;
- explaining the role of PED and PES;
- applying surplus to efficiency and market-welfare questions.
Related CIE 9708 topics
Not the topic you were looking for? Describe what you are stuck on in your own words and we will take you to the notes that answer it.