Economic Growth
Contents: 5 sections
Cambridge International AS & A Level Economics 9708 (AS Level) Current syllabus: 2026–2028, version 2 Official syllabus points: 4.4.1–4.4.5
Exam Essentials
1. Meaning of economic growth
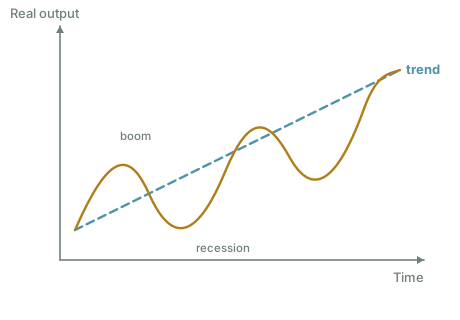
Economic growth is an increase in the real output of an economy over time.
In most examination contexts; it is measured by the percentage increase in real gross domestic product (real GDP). The word real matters because it removes the effect of changes in the general price level. If nominal GDP rises only because prices have increased, the economy has not necessarily produced more goods and services.
A fall in real GDP is negative economic growth or an economic contraction.
The central distinction: actual growth and potential growth

Students should keep two related ideas separate:
- Actual economic growth means an increase in the economy's current real output. It can occur when previously unemployed resources are brought into production. In an AD/AS framework; this is a rise in equilibrium real output.
- Potential economic growth means an increase in the economy's productive capacity. It occurs when the maximum sustainable level of real output rises. It can be represented by an outward shift of the production possibility curve or a rightward shift of LRAS.
Actual output can rise without productive capacity increasing. For example, an economy recovering from recession may employ idle workers and machines more fully. Conversely, productive capacity can increase before actual demand is strong enough to use it fully.
Economic growth is not the same as economic development
Economic growth concerns the increase in real output. Economic development is a broader A Level idea involving changes in living standards, health, education, poverty, institutions and the structure of an economy. Growth may support development, but it does not guarantee that all groups become better off.
Exam trap: do not define growth as “an increase in GDP” without specifying real GDP or real output.
2. Total growth and growth per person
A country may experience an increase in total real GDP while real GDP per person falls. This happens when population grows faster than real GDP.
Real GDP per capita means real GDP divided by population:
real GDP per capita = real GDP ÷ population
Real GDP per capita is useful when considering average material living standards because it allows for population size. However, it remains an average and does not show how income is distributed.
Example
Suppose real GDP rises from $500 billion to $515 billion, a rise of 3%. If population rises by 1%, real GDP per capita rises by approximately 2%. The approximation is suitable for small percentage changes, although exact per-capita values can be calculated when the underlying GDP and population figures are given.
Exam trap: growth in total real GDP does not automatically mean that the average person has access to more output.
3. Measuring economic growth
The standard growth-rate calculation is:
economic growth rate = ((real GDP in the current period − real GDP in the previous period) ÷ real GDP in the previous period) × 100
Worked example 1: positive growth
Real GDP rises from $800 billion to $824 billion.
- Change in real GDP = $24 billion
- Growth rate = (24 ÷ 800) × 100
- Growth rate = 3%
Worked example 2: negative growth
Real GDP falls from $600 billion to $582 billion.
- Change in real GDP = −$18 billion
- Growth rate = (−18 ÷ 600) × 100
- Growth rate = −3%
Always divide by the original or previous-period value, not the new value.
How growth figures may be presented
Growth can be measured over different periods:
- month on month;
- quarter on quarter;
- year on year;
- annual growth;
- growth over a longer period.
Students should state the comparison period clearly. A quarterly growth rate and a year-on-year growth rate are not directly interchangeable.
Important measurement limitations
GDP is a widely used measure of economic activity, but the measured growth rate can be affected by:
- revisions as more complete data become available;
- difficulty measuring informal or unrecorded activity;
- difficulty valuing public services and new products;
- changes in quality;
- seasonal patterns in short-period data;
- measurement error.
These limitations do not make GDP useless. They mean that a growth estimate should be interpreted as an informed statistical estimate rather than a perfect count of every transaction.
4. Interpreting growth data correctly
When comparing two economies, distinguish between:
- the size of real GDP;
- the rate of growth of real GDP;
- real GDP per capita;
- the level of real GDP per capita;
- short-run growth and a sustained long-run trend.
A lower-income economy may grow faster in percentage terms while still having a much lower level of output per person. A large economy may add more output in absolute terms despite having a lower percentage growth rate.
Example
- Economy A: real GDP rises from $2,000 billion to $2,040 billion. Growth = 2%.
- Economy B: real GDP rises from $100 billion to $104 billion. Growth = 4%.
Economy B has the faster percentage growth rate, but Economy A adds $40 billion of output compared with Economy B's $4 billion.
Exam trap: “fastest-growing” does not mean “largest” or “richest”.
5. Nominal GDP and real GDP
Nominal GDP
Nominal GDP values current output at current prices. It is not adjusted for inflation. Nominal GDP can rise because:
- more goods and services are produced;
- prices rise;
- or both occur.
Real GDP
Real GDP adjusts for price changes so that changes in the volume of output can be identified. It uses constant-price or volume measures.
Why the distinction matters
Suppose nominal GDP rises by 8% while the general price level rises by roughly 5%. Real output has risen by only around 3%, not 8%. The exact result depends on the price index and calculation method, but the key principle is that nominal growth combines output growth with inflation.
Simple data example
| Year | Nominal GDP | Price index | Real GDP at base-year prices |
|---|---|---|---|
| 1 | $500bn | 100 | $500bn |
| 2 | $550bn | 110 | $500bn |
Nominal GDP rises by 10%, but the price index also rises by 10%. Real GDP is unchanged, so there is no real economic growth.
A useful conversion where a price index is supplied is:
real GDP = (nominal GDP ÷ price index) × 100
This formula assumes the price index equals 100 in the base year.
Exam trap: do not use nominal GDP growth to claim that living standards or the volume of output has risen.
Full Explanation
6. Causes of actual economic growth
Actual growth occurs when equilibrium real output increases. In the short run; this may result from an increase in aggregate demand when the economy has spare capacity.
Possible causes include:
- higher consumption;
- higher investment;
- higher government spending;
- higher exports;
- lower imports, other things equal;
- improved confidence;
- lower interest rates;
- expansionary fiscal policy;
- recovery in overseas demand.
Causal chain
- Increase in a component of AD
- AD shifts right
- firms receive more orders
- firms increase output and employment
- real GDP rises.
The outcome depends on the shape of aggregate supply and the degree of spare capacity. If the economy is close to full capacity, a rise in AD may create more inflation and relatively little real growth.
Recovery growth versus capacity growth
A fall in cyclical unemployment can produce rapid actual growth during recovery. This does not necessarily mean that the economy's productive potential has increased. It may simply be moving closer to its existing capacity.
7. Causes of potential economic growth
Potential growth requires an increase in the quantity or quality of productive resources, or an improvement in how efficiently they are used.
7.1 Investment in physical capital
Investment adds to the stock of machinery, equipment, buildings, transport networks and digital infrastructure.
- Investment
- capital per worker or productive capacity rises
- labour productivity and/or maximum output rises
- LRAS shifts right
- potential economic growth.
The size of the effect depends on the quality of investment, how quickly it becomes operational and whether the new capacity is actually used.
7.2 Human capital
Education, training and health can improve workers' knowledge, skills and productivity.
- Better human capital
- workers produce more or higher-quality output per hour
- unit costs may fall
- competitiveness and productive capacity improve
- long-run growth.
There may be a substantial time lag because education and health investments take time to affect the workforce.
7.3 Technological progress and innovation
New production methods, automation, software and improved organisation can raise total factor productivity.
- Technological progress
- more output can be produced from a given set of inputs
- costs may fall and new products may emerge
- productive capacity rises.
Technology can also make some existing skills obsolete, creating structural adjustment costs.
7.4 Growth of the labour force
The labour force can increase because of:
- population growth;
- a higher labour-force participation rate;
- immigration;
- later retirement;
- policies that reduce barriers to employment.
A larger labour force can increase total productive capacity. However, output per person will not necessarily rise unless productivity or capital per worker also increases.
7.5 Natural resources
Discovery or more efficient use of natural resources can increase productive capacity. The effect depends on extraction costs, world prices, environmental constraints and whether revenues are invested productively.
Resource-led growth can be volatile and may be unsustainable if it relies on depletion of non-renewable resources.
7.6 Enterprise, institutions and infrastructure
Entrepreneurship can identify new products, methods and markets. Effective legal systems, property rights, access to finance, competition and political stability can support investment and innovation. Infrastructure can reduce transport, communication and transaction costs.
These factors often interact. For example, new technology may have little effect without trained workers, reliable electricity and access to finance.
8. A framework for analysing any cause of growth
A strong answer should identify the initial change. Explain the mechanism and distinguish short-run from long-run effects.
Use this structure:
- Identify the cause: for example, higher business investment.
- State the immediate effect: investment is a component of AD, so AD may rise.
- Explain the short-run result: with spare capacity, real output and employment may rise.
- Explain the long-run result: the capital stock and productivity may increase, shifting LRAS right.
- Add a condition: the effect depends on the productivity of investment, time lags and whether complementary skills and infrastructure exist.
This avoids the common mistake of treating every cause as purely demand-side or purely supply-side. Investment can affect both AD now and productive capacity later.
Exam Mastery
9. Benefits and favourable consequences of economic growth
9.1 Higher material living standards
If real GDP per capita rises, households can potentially consume more goods and services. Higher output can support higher real incomes.
However, the word potentially matters. Average output per person may rise while some groups become worse off.
9.2 Lower cyclical unemployment
Growth caused by stronger demand usually increases firms' demand for labour.
- Higher real output
- greater derived demand for labour
- cyclical unemployment falls.
The effect may be weaker if growth is capital-intensive, if firms raise productivity without hiring many workers or if skills do not match vacancies.
9.3 Higher profits and investment
Higher sales can raise profits and business confidence. Firms may retain and reinvest profits, creating a reinforcing process of capital accumulation and productivity growth.
9.4 Stronger government finances
Growth may increase tax revenue from incomes, profits and spending while reducing some welfare expenditure.
- Higher revenue and lower cyclical benefit payments
- improved budget position, other things equal
- more scope for public services, infrastructure or debt reduction.
This is not guaranteed if tax rates are cut, public spending rises faster or growth is concentrated in lightly taxed activity.
9.5 Reduced absolute poverty
Growth can create jobs and resources for public services. It is more likely to reduce poverty when opportunities and gains reach lower-income households.
10. Costs, risks and unfavourable consequences
10.1 Inflationary pressure
Rapid demand-led growth may create demand-pull inflation, especially near full capacity.
- AD rises strongly
- firms face capacity constraints
- wages and prices rise
- real growth becomes increasingly inflationary.
Supply-led growth is less likely to be inflationary because productive capacity also expands. It may lower unit costs.
10.2 Current-account pressure
Growth can increase imports because households and firms buy more foreign consumer goods, raw materials and capital goods.
- Higher income and investment
- import expenditure rises
- current account may deteriorate, other things equal.
The final effect is ambiguous. If growth improves productivity and export competitiveness, exports may also rise. Imported capital goods may initially worsen the current account but help export capacity later.
10.3 Environmental damage and resource depletion
More production and consumption can increase pollution, congestion, waste and use of finite resources. GDP records production but does not automatically subtract all environmental costs.
The impact depends on:
- the composition of growth;
- energy sources;
- environmental regulation;
- technological change;
- whether natural capital is depleted;
- whether production becomes cleaner.
Growth in renewable energy, public transport or efficient technology can have a different environmental effect from growth based on fossil-fuel extraction.
10.4 Income and wealth inequality
Growth may widen inequality if gains accrue mainly to owners of capital, highly skilled workers or particular regions. It may narrow inequality if it creates widespread employment and raises lower incomes.
Therefore, the effect on inequality depends on the source of growth, labour-market conditions, ownership patterns and government tax and spending policies.
10.5 Structural change and unemployment
Innovation-led growth can make some industries and occupations decline. Although total employment may rise, some workers may experience structural unemployment because their skills or location do not match new jobs.
10.6 Opportunity cost and pressure on quality of life
Investment that raises future growth may require lower consumption now. Rapid growth may also bring longer working hours, congestion, housing pressure or loss of leisure. These effects are not fully captured by GDP.
11. Evaluation: when is growth most beneficial?
The quality of growth matters as much as the headline rate.
A strong judgement should consider:
11.1 Real GDP per capita
If population growth exceeds real GDP growth, average output per person falls. Total growth alone may therefore overstate improvement in material living standards.
11.2 Distribution
A rise in average income does not show who receives the gain. Growth that is broadly shared is more likely to raise social welfare.
11.3 Sustainability
Growth based on depletion of natural resources may be difficult to maintain. Growth based on productivity, human capital and cleaner technology may be more sustainable.
11.4 Spare capacity
Demand-led growth is more likely to raise real output with limited inflation when unemployment and spare capacity are high. Near full capacity, the same rise in AD may mainly raise prices.
11.5 Short run versus long run
A policy or investment may create costs now but raise productive capacity later. Imported machinery may worsen the current account initially but improve productivity and exports in future.
11.6 Composition
Growth in health, education and useful infrastructure may contribute more to welfare than an equal rise in output from activities with large negative externalities.
Judgement template
Economic growth is most likely to improve living standards when it is sustained growth in real GDP per capita, generated by productivity improvements, broadly distributed across households and achieved without severe inflationary, external or environmental costs.
12. Diagram knowledge without publishing an unaudited graph
Three standard models can be used to explain growth:
Production possibility curve
- Movement from a point inside the PPC towards the curve: increase in actual output through fuller use of existing resources.
- Outward shift of the PPC: increase in productive potential.
AD/AS model
- Rightward shift of AD with spare capacity: actual growth, but potentially a higher price level.
- Rightward shift of LRAS: potential growth and a higher full-employment level of output.
- A simultaneous rise in AD and LRAS can increase real output while the effect on the price level depends on the relative size of the shifts.
Real GDP over time
- The vertical axis should show real GDP or an index of real output.
- The horizontal axis should show time.
- A rising long-run trend represents growth, while short-run fluctuations show expansions and contractions around that trend.
No rendered diagram is included in this pack. See diagram-specifications.md and legacy-notes-map.md.
13. Common mistakes
- Defining growth using nominal GDP.
- Confusing an increase in the price level with an increase in output.
- Dividing by the new value rather than the original value in a growth-rate calculation.
- Assuming total GDP growth automatically raises GDP per capita.
- Claiming that all growth reduces unemployment.
- Claiming that growth always causes inflation.
- Treating an outward PPC shift and movement from inside to the PPC as identical.
- Assuming higher GDP guarantees higher welfare.
- Saying that a current-account deficit must worsen without considering export capacity and competitiveness.
- Using the old shortcut of dividing a cumulative multi-year percentage change by the number of years as though it were a compound annual growth rate.
14. Calculation checklist
Before submitting:
- Have I used real rather than nominal GDP?
- Have I used the previous period as the denominator?
- Have I multiplied by 100?
- Have I included a minus sign for contraction?
- Have I stated the comparison period?
- If comparing living standards, have I considered population?
- If a price index is provided, have I converted nominal GDP into real GDP correctly?
Deep Dive
15. Why cumulative growth should not simply be divided by years
Suppose an economy grows from 100 to 121 over two years. Total growth is 21%. Dividing 21% by two gives 10.5%, but two years of 10.5% compound growth would produce more than 121.
The compound annual rate is found from:
ending value = starting value × (1 + annual rate)^number of years
This compound calculation is useful for interpreting long periods but is not a required core technique for Topic 4.4. In Cambridge questions, follow the data and calculation instruction provided.
16. Growth and welfare
GDP is a production measure. It does not directly measure:
- leisure;
- unpaid household work;
- the distribution of income;
- environmental damage;
- personal safety;
- health and education outcomes;
- life satisfaction.
This does not mean growth is irrelevant to welfare. Higher output can fund consumption and public services. It means that growth should be analysed alongside distribution, population, sustainability and the composition of output.
Check you have it
Question 1
Which is most likely to cause a decrease in the public’s ratio of cash to bank deposits?
Answer: A.
Question 2
The real national income of a country fell by 3%. What could have caused this?
Answer: C.
Question 3
What is necessary for an action to be classed as a transfer payment?
Answer: D.
17. Topic summary
- Economic growth is an increase in real output over time.
- The usual measure is the percentage change in real GDP.
- Real GDP per capita is more useful than total GDP when considering average material living standards.
- Nominal GDP includes price changes; real GDP removes their effect.
- Actual growth can arise from stronger AD and fuller resource use.
- Potential growth comes from more or better resources, investment, human capital, technology, productivity and supportive institutions.
- Growth can raise incomes, employment, profits and tax revenue.
- It can also create inflation, current-account pressure, inequality, structural adjustment and environmental costs.
- The best evaluation considers the type, rate, distribution and sustainability of growth.
What the syllabus asks for on this topicSyllabus map
Syllabus map
| Syllabus point | Required knowledge | Where it is covered |
|---|---|---|
| 4.4.1 | Meaning of economic growth | Sections 1–2 |
| 4.4.2 | Measurement of economic growth | Sections 3–4 |
| 4.4.3 | Nominal GDP versus real GDP growth | Section 5 |
| 4.4.4 | Causes of economic growth | Sections 6–8 |
| 4.4.5 | Consequences of economic growth | Sections 9–11 |

Related CIE 9708 topics
Not the topic you were looking for? Describe what you are stuck on in your own words and we will take you to the notes that answer it.