Employment and Unemployment
The Natural Rate, Expectations and the Inflation Unemployment Relationship
Contents: 8 sections
1. Why this topic matters
AS Level covered the types and costs of unemployment. A2 asks a harder question: is there a stable trade-off between inflation and unemployment that a government can exploit?
The answer, and the reason this topic is examined so heavily, is that the apparent trade-off held for a period, then broke down, and explaining why it broke down is what the marks are for. The explanation introduces expectations into macroeconomics, which changed the subject permanently and underpins how central banks operate today.
This topic completes chapter 9 by bringing together the labour market of 8.3, the aggregate supply debate of 9.3 and the monetary analysis of 9.5.
2. The natural rate of unemployment
2.1 Definition
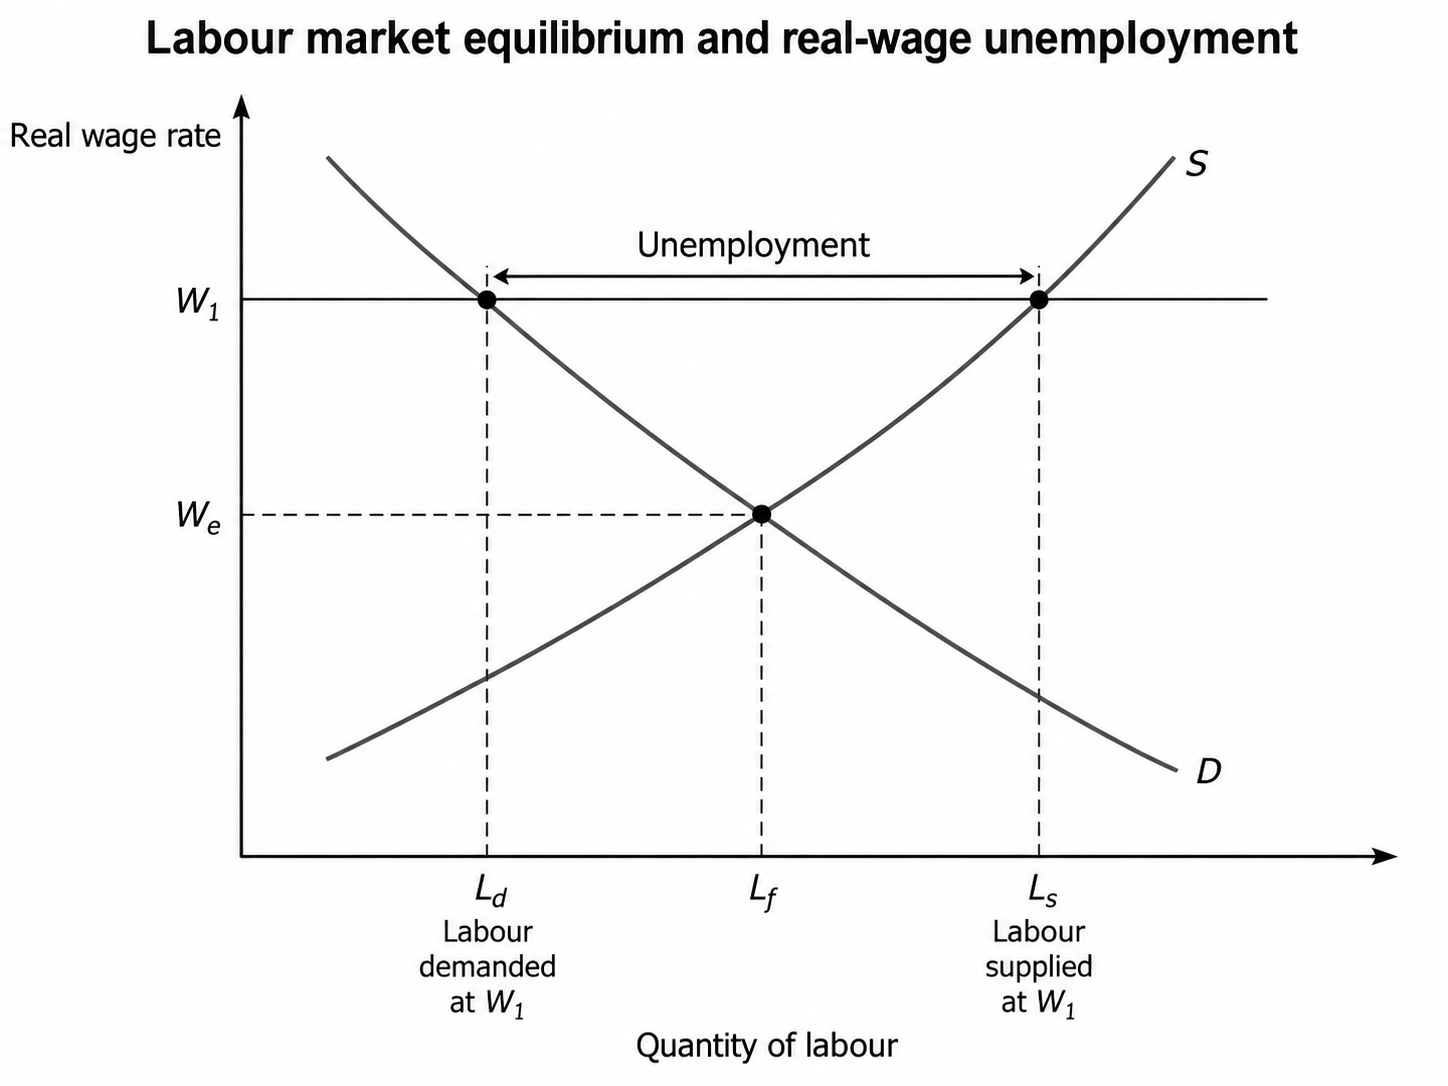
The natural rate of unemployment (NRU) is the rate that persists when the labour market is in equilibrium, meaning the number of people willing and able to work at the going real wage equals the number of jobs available. It is the rate consistent with a stable rate of inflation.
It is not zero, and it is not a measure of failure. It consists of:
- frictional unemployment, people between jobs, which is unavoidable and partly desirable since matching takes time; and
- structural unemployment, mismatch between the skills or locations of workers and of vacancies.
It excludes cyclical (demand deficient) unemployment, which is the part caused by insufficient aggregate demand.
2.2 What determines it
Because the NRU is a supply-side magnitude, it changes only when the structure of the labour market changes:
- the level and duration of unemployment benefits, which affect the intensity of search;
- the efficiency of job matching and the availability of information about vacancies;
- occupational and geographical mobility;
- the extent of skills mismatch, which technological change tends to worsen;
- employment protection legislation and hiring costs; and
- trade union power and the coverage of minimum wages.
The policy implication is the classical one from 9.3: only supply-side measures can reduce the natural rate. Demand management cannot, and attempting it produces inflation.
2.3 Seeing it on the labour market diagram
The natural rate looks paradoxical until it is drawn, and Paper 4 rewards being able to draw it.
Put the real wage on the vertical axis and the quantity of labour on the horizontal. Demand for labour slopes down. Now draw TWO supply curves rather than one.
- LF, the total labour force: everyone who would take a job at that real wage, including those still searching or whose skills do not match the vacancies.
- AJ, those actually willing and able to accept a job at that wage.
AJ lies to the LEFT of LF, and the horizontal gap between them at the equilibrium real wage IS the natural rate. Equilibrium occurs where labour demand meets AJ, so the market clears in the sense that everyone willing to accept a job at that wage has one, and yet a measurable number of people in the labour force remain unemployed.
That is the whole resolution of the paradox. The unemployed at the natural rate are not people who cannot find work at the going wage; they are people searching, retraining or mismatched. A policy that narrows the gap between LF and AJ, better job matching, retraining, greater mobility, reduces the natural rate. A policy that boosts aggregate demand shifts labour demand right and raises the real wage without changing the gap at all.
2.4 A worked example
An economy reports a labour force of 32 million and 30.4 million people in employment.
Survey evidence suggests 1.1 million of the unemployed are between jobs or lack the skills that current vacancies require, and 0.5 million lost their jobs in the recent downturn.
\qquad
cyclical = (0.5) ÷ (32.0) × 100 = 1.6%
The examinable conclusion follows from the split, not from the total. Expansionary demand policy can address the 1.6 percentage points of cyclical unemployment. It cannot touch the 3.4, and pushing unemployment below the natural rate would accelerate inflation rather than create lasting jobs.
Note the denominator: the unemployment rate uses the LABOUR FORCE, not the total population. Using population is a routine and expensive error.
3. The Phillips curve is in Topic 10.2
The relationship between unemployment and inflation, both the original Phillips curve and the expectations-augmented model with its vertical long-run curve, is syllabus point 10.2.5 and is set out in full in [Topic 10.2](/cie-9708/a-level/10-2-links-between-macroeconomic-problems).
What matters here is the destination of that analysis: the long-run Phillips curve is vertical at the natural rate of unemployment defined in section 2, so demand management cannot hold unemployment below it. Reducing unemployment sustainably means lowering the natural rate itself, which is what the policies in section 4 attempt.
4. Policies to reduce unemployment
4.1 For inflation control
If expectations drive inflation, then managing expectations is central. This is the intellectual basis for:
- central bank independence, so that policy is not driven by the electoral cycle of 8.4;
- explicit inflation targets, which give households and firms a clear anchor for expectations; and
- transparency and credibility, since a central bank that is believed can lower expected inflation at less cost in lost output, reducing the sacrifice ratio.
A credible commitment is therefore an economic asset. It lowers the real cost of keeping inflation low.
4.2 For unemployment
Since the long run curve is vertical at the NRU, permanent reductions in unemployment require supply-side policy that lowers the natural rate: training to reduce skills mismatch, improved job matching and information, measures to raise mobility, and reform of benefit structures to sharpen search incentives while protecting the incomes of 8.2.
4.3 Hysteresis: a Keynesian qualification
Hysteresis is the idea that a prolonged period of high cyclical unemployment can raise the natural rate itself. Long term unemployed workers lose skills, become detached from the labour market, and are viewed less favourably by employers. What began as cyclical unemployment becomes structural.
If hysteresis operates, the distinction between cyclical and natural unemployment blurs, and there is a case for demand management even on the supply-side account, because allowing a recession to run its course permanently damages capacity. This is a strong evaluation point and it prevents an answer collapsing into pure monetarism.
4.4 Real-world examples worth quoting
- Germany's Hartz reforms in the mid-2000s cut benefit duration, tightened job-search conditions and reformed placement services. Unemployment fell over the following decade and the reforms are the standard example of supply-side measures moving the natural rate rather than the cycle. The evaluation is equally standard: much of the employment growth was in low-paid and part-time work, so the measure improved and the quality of the outcome is disputed.
- Spain after 2008 is the hysteresis case. Unemployment exceeded 25%, youth unemployment far higher, and even after output recovered the rate stayed well above its pre-crisis level, consistent with skills decaying and long-term unemployed workers detaching from the labour market.
- Technological change in manufacturing across advanced economies is the clearest driver of structural unemployment: the jobs that disappear and the jobs that appear require different skills and often exist in different regions, which is a mismatch in both dimensions at once.
5. Integrated analysis and common traps
5.1 A complete chain
A government facing an election expands demand to reduce unemployment from 6 per cent, the natural rate, to 4 per cent. In the short run the economy moves up and along the existing short run Phillips curve: inflation rises and unemployment falls, because prices have risen faster than the money wages already agreed, so real wages have fallen.
Within a year or two, workers revise expectations and negotiate higher money wages. Real wages are restored, firms cut employment, and unemployment returns to 6 per cent while inflation remains at its new higher level. The short run curve has shifted upward.
Evaluation: the outcome depends on how quickly expectations adjust, which depends on the credibility of policy and on whether inflation is salient to households. If adjustment is slow, the employment gain lasts longer and may be judged worthwhile; if agents form expectations rationally and anticipate the expansion, there may be no employment gain at all, only inflation. And if the initial unemployment was cyclical rather than natural, the expansion raises output with far less inflationary cost, which returns to the output gap question of 9.3.
5.2 Common examination errors
- Treating the original Phillips curve as a stable menu still available today.
- Failing to distinguish the short run curves from the vertical long run curve.
- Saying expectations shift the economy along the curve rather than shifting the curve itself.
- Confusing the natural rate with zero unemployment, or treating it as fixed forever.
- Explaining stagflation only by supply shocks and omitting expectations, or the reverse.
- Forgetting that reducing inflation has a cost in unemployment above the natural rate.
- Ignoring hysteresis, which leaves the answer unable to justify any demand-side response.
6. Paper 3 and Paper 4 mastery
Paper 3 tests: identifying the axes and slope, distinguishing movements along from shifts of the short run curve, identifying the long run curve as vertical at the NRU, and classifying a type of unemployment.
Paper 4 essays ask whether a government can choose between inflation and unemployment. The reliable structure is: present the original curve and its reasoning, describe the breakdown and stagflation. Explain the expectations-augmented model and the vertical long run curve, then evaluate using credibility, the speed of expectation adjustment, hysteresis and whether the initial unemployment is cyclical or natural.
The strongest conclusion is conditional: a trade-off exists in the short run and its exploitation is self-defeating in the long run, so the useful policy question is not which point on the curve to choose but how to lower the natural rate and anchor expectations.
Check you have it
Question 1
Four citizens have each been unemployed for the past six months. Which citizen would not be characterised as being structurally unemployed?
Answer: D.
Structural unemployment occurs when there is a mismatch between the skills of the workforce and the requirements of the available jobs. In this case, citizens A, B, and C are facing structural unemployment due to changes in the economy or labour market that have made their skills or job positions obsolete.
Explanation for why D is not structurally unemployed:
Citizen D is actively choosing to wait and decide which job might be the most suitable for them. This individual is not unemployed due to a lack of suitable job opportunities or a mismatch in skills. Instead, they are taking time to make a thoughtful decision about their next career move. This situation does not fit the criteria for structural unemployment, as there is no indication of a mismatch between their skills and available job opportunities.
In contrast, Citizens A, B, and C are facing structural unemployment due to external factors such as the closure of coal-fired power stations, decreased foot traffic in town centres, and firm relocations. These individuals are unable to find suitable employment options that align with their skills and experience, leading to their classification as structurally unemployed.
Question 2
Which combination of policies is most likely to reduce cyclical unemployment but might increase frictional unemployment?
Answer: B.
The question needs a combination that helps one type of unemployment while worsening another, and B does exactly that.
On cyclical unemployment, both measures raise aggregate demand. Higher benefits put money in the hands of the unemployed, who have a marginal propensity to consume close to 1, so almost all of it is spent. Lower direct taxes raise disposable income for those in work. Stronger demand means firms produce more and hire more, so demand-deficient unemployment falls.
On frictional unemployment, higher benefits raise the reservation wage. With more income available while searching, the unemployed can afford to look for longer and turn down less attractive offers, so the average duration of job search lengthens and frictional unemployment rises.
Why the other options are wrong:
- A and C decrease benefits, which shortens job search and so reduces frictional unemployment rather than increasing it.
- C and D increase direct taxes, which reduces disposable income and aggregate demand, worsening cyclical unemployment.
- D raises benefits (increasing frictional unemployment as required) but also raises taxes, so the net effect on demand is ambiguous and cyclical unemployment need not fall.
Question 3
An increase in which variable affecting labour markets is most likely to reduce the natural rate of unemployment?
Answer: D.
The natural rate of unemployment is the equilibrium rate, made up of frictional and structural unemployment. Training attacks the structural component directly: workers whose skills have become obsolete acquire skills that current vacancies require, so they become occupationally mobile and can move from declining industries into expanding ones. The mismatch between the unemployed and the available jobs narrows, and the equilibrium unemployment rate falls.
Why the other options would raise the natural rate:
- A, higher unemployment benefit, raises the reservation wage and lengthens job search, increasing frictional and voluntary unemployment.
- B, greater union militancy, pushes wages above the market-clearing level and resists changes in working practices, so fewer workers are employed at equilibrium and labour reallocates more slowly.
- C, a higher national minimum wage, prices out workers whose marginal revenue product falls below the new floor, typically the young and the least skilled, precisely those most at risk of structural unemployment.
7. Final checklist
A fully prepared learner can:
- define the natural rate of unemployment and state which types it includes and excludes;
- list at least five determinants of the natural rate;
- draw the original Phillips curve and explain the labour market reasoning behind it;
- explain what stagflation is and why it discredited the stable trade-off;
- explain supply shocks and expectations as the two explanations for the breakdown;
- explain money illusion and why the employment gain is temporary;
- derive the vertical long run Phillips curve and explain the accelerationist hypothesis;
- define NAIRU and the sacrifice ratio;
- work through a numerical example of expectations adjusting after an expansion;
- explain why credibility, independence and inflation targets lower the cost of disinflation;
- explain hysteresis and why it qualifies the supply-side conclusion; and
- reach a conditional judgement on whether a trade-off can be exploited.

Related CIE 9708 topics
Not the topic you were looking for? Describe what you are stuck on in your own words and we will take you to the notes that answer it.