Economic Growth and Sustainability
Output Gaps, the Trade Cycle, and Growth That Lasts and Includes
Contents: 10 sections
1. Why this topic matters
AS topic 4.4 defined economic growth and showed it on a PPC and an AD/AS diagram. This topic asks three harder questions: how far the economy is from what it could produce, why output moves in cycles, and whether the growth achieved is worth having.
The last of those is where Cambridge has moved. A2 no longer treats growth as a single good number. It asks whether growth is inclusive, meaning the gains reach people across the income distribution, and whether it is sustainable, meaning it does not consume the capacity of future generations to grow in turn. Answers that treat higher GDP as self-evidently good will not reach the top bands.
2. Actual and potential growth
The distinction governs almost everything else here.
- Actual growth is the rise in real output actually produced, a movement towards or along the production possibility curve, or a rightward movement of equilibrium real GDP.
- Potential growth is the rise in the economy's productive capacity, an outward shift of the PPC or of the long-run aggregate supply curve.
Actual growth without potential growth is a recovery. It uses spare capacity and cannot continue once that capacity is exhausted. Potential growth without actual growth is wasted capability, capacity built but not used.
Causes of potential growth are the sources of extra capacity: more labour through population growth or participation, more capital through net investment, more or better land and natural resources, improved human capital through education and training, and technological progress, which is the only one that can continue indefinitely.
Causes of actual growth are the components of aggregate demand from 9.1: consumption, investment, government spending and net exports.
A frequent examination error is to explain an outward PPC shift using a rise in aggregate demand. Demand determines how much of capacity is used, not how much capacity exists.
3. Output gaps
An output gap is the difference between actual real output and the potential output the economy could sustain.
3.1 Negative output gap
Actual output is below potential. The economy is inside its PPC, or to the left of the long-run aggregate supply curve.
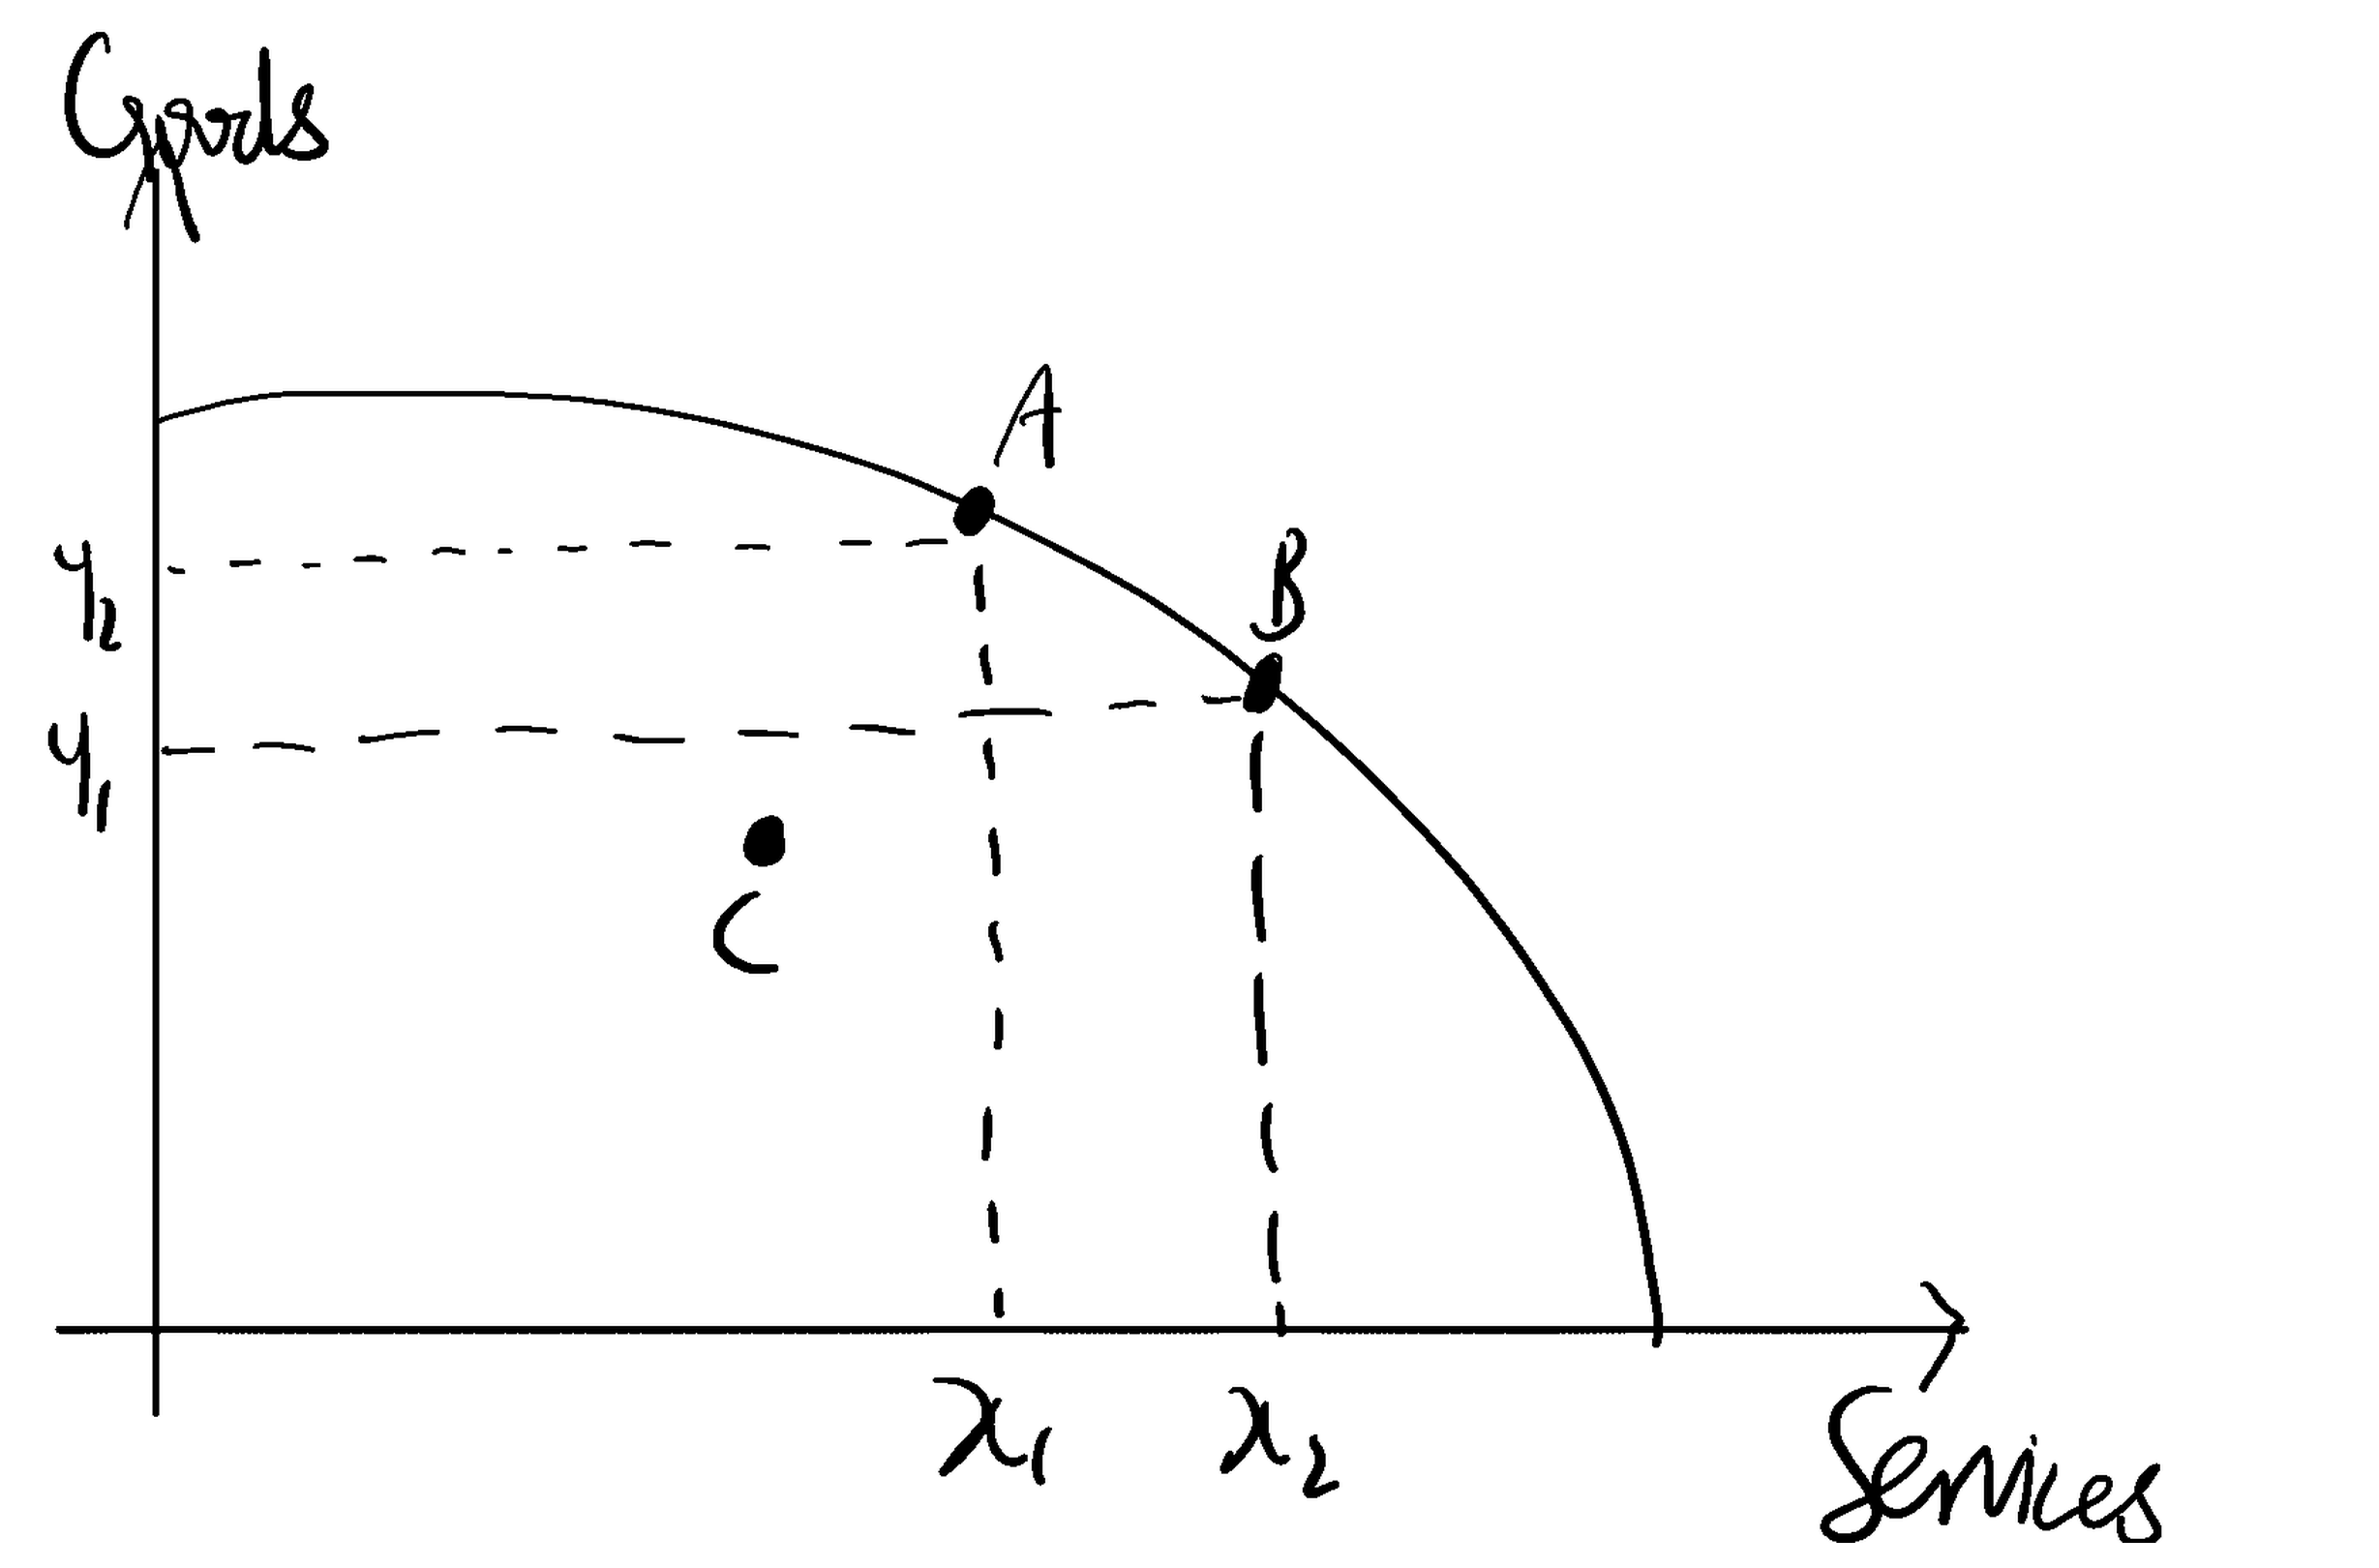
Point C is the negative output gap. It is not a shortage of capacity, because the frontier is unchanged and A and B remain reachable; it is capacity sitting idle. That is why the policy response is demand-side. Moving C out to the frontier is actual growth, and it requires no new resources at all, only that the existing ones are used.
Note also that C is not a choice between goods and services. Any point on the curve gives more of at least one and no less of the other, so a country at C is giving up output for nothing in return. That is the sense in which a recession is a waste rather than a trade-off.
- Unemployment is above the natural rate, so there is cyclical unemployment.
- Spare capacity means firms compete for scarce customers, so inflationary pressure is weak or negative.
- The gap is normally caused by deficient aggregate demand.
3.2 Positive output gap
Actual output is above potential, which is possible in the short run because factors can be worked beyond their sustainable rate: overtime, deferred maintenance, older equipment brought back into use.
- Unemployment is below the natural rate.
- Shortages of labour and inputs bid up wages and prices, so inflation accelerates.
- It cannot last, because the extra intensity is not sustainable, which is why a positive gap is a signal of overheating rather than of success.
3.3 Measuring the gap
Potential output is not observed, only estimated, so output gaps are revised heavily after the event. That is a genuine evaluation point: a government tightening policy on an estimated positive gap may be responding to a number that is later revised away.
4. The business cycle
The business cycle, also called the trade cycle, is the fluctuation of actual output around the trend of potential output.
4.1 The phases
- Recovery: output rising from a low base, spare capacity being taken up, unemployment falling, inflation still low.
- Boom: output above trend, a positive output gap, unemployment below the natural rate, inflation rising, and often a widening current account deficit as import demand rises.
- Slowdown or recession: output growth falling, and in a recession falling absolutely, conventionally for two consecutive quarters. Unemployment rises and inflationary pressure falls.
- Trough: the low point, a large negative output gap, before recovery begins.
4.2 Causes of the cycle
- Demand-side fluctuations, particularly in investment, which is the most volatile component of aggregate demand. The accelerator in 9.1 explains why: investment depends on the change in output, so it swings far more violently than output itself.
- Multiplier and accelerator interaction, which can turn a small initial change into a self-reinforcing expansion or contraction.
- Changes in confidence and expectations, which are self-fulfilling: firms that expect a downturn cut investment, which causes one.
- Credit cycles, where easy lending fuels a boom and the subsequent contraction of credit deepens the bust.
- External shocks, including commodity price movements, the trade cycle of major trading partners, and supply disruptions.
- Supply-side shocks, which move potential output itself rather than the gap.
4.3 Automatic stabilisers
Automatic stabilisers are features of the fiscal system that dampen the cycle without any policy decision being taken.
- In a downturn, incomes and profits fall, so tax revenue falls automatically, cushioning the fall in disposable income. Unemployment and income-related benefit spending rises automatically, supporting demand.
- In a boom, both work in reverse: revenue rises and benefit spending falls, restraining demand.
The budget therefore moves towards deficit in a downturn and towards surplus in a boom without any new legislation, which is precisely why the deficit widening in a recession is not by itself evidence of fiscal irresponsibility.
Their strength depends on how progressive the tax system is and how generous the benefit system is, so stabilisers are weaker in economies with low tax-to-GDP ratios and limited welfare provision.
Their limitation is that they moderate the cycle rather than remove it, and being automatic they cannot be targeted.
5. Policies to promote economic growth
Actual and potential growth need different policies, and the strongest answers say which they are targeting.
To raise actual growth, use demand-side policy from 10.3: expansionary fiscal policy, lower interest rates, or a competitive exchange rate. This works when there is a negative output gap and spare capacity. Applied at full capacity it produces inflation rather than output.
To raise potential growth, use supply-side policy: investment in education and training, infrastructure, research and development, incentives to invest, and measures to raise labour force participation.
5.1 Effectiveness
- Demand-side measures act relatively quickly but only where spare capacity exists, and they may worsen the current account and the budget position.
- Supply-side measures act slowly, often over a decade for education, and the political cycle rewards visible short-run action, so they are chronically underprovided.
- Investment in capital raises capacity but has an opportunity cost in current consumption, which is a genuine sacrifice for a low-income economy.
- Technological progress is the only source of growth not subject to diminishing returns, which is why research and development spending is weighted so heavily in the literature.
- No policy works if institutions are weak, since neither firms nor households will invest where property rights are insecure.
The reliable conclusion is that a country with a negative output gap needs demand-side measures first, and a country already at capacity needs supply-side measures, because doing the reverse in either case produces inflation or wasted capability.
6. Inclusive economic growth
Inclusive economic growth is growth whose benefits are distributed broadly across the population, rather than accruing to a narrow group.
The distinction from ordinary growth is that GDP per head is a mean. Mean income can rise substantially while the median is flat, if the gains are concentrated at the top. A country can therefore report strong growth while most of its people experience none.
6.1 Why growth may not be inclusive
- Gains accruing to capital rather than labour, so owners of assets benefit more than wage earners.
- Skill-biased technological change, raising the earnings of the highly skilled while displacing routine work.
- Regional concentration, where growth occurs in a few cities and leaves other regions behind.
- Sectoral concentration, where growth comes from an enclave such as extractive industry with few links to the rest of the economy.
- Unequal access to education, which entrenches the existing distribution across generations.
6.2 The effect of growth on equity and equality
The relationship runs both ways, which is what makes this a good evaluation question.
- Growth raises tax revenue, funding health, education and transfers, which can reduce inequality.
- Growth creates employment, and employment is the main route out of poverty.
- But growth can widen inequality through the mechanisms above, and the Kuznets hypothesis suggests inequality may rise in the early stages of development before falling.
- Absolute poverty can fall while relative poverty rises, and the two moving in opposite directions is a distinction Cambridge rewards.
6.3 Policies to promote inclusive growth
- Progressive taxation and targeted transfers.
- Education and training widely accessible, which raises both growth and its distribution at once.
- Regional policy directing investment and infrastructure to lagging areas.
- Minimum wages and labour protections, subject to the employment effects analysed in 8.3.
- Financial inclusion, so that credit is available beyond those who already have assets.
- Healthcare access, since ill health is both a cause and a consequence of poverty.
Note that several of these raise potential growth as well as its inclusiveness, so the trade-off is weaker than it first appears.
7. Sustainable economic growth
Sustainable economic growth is growth that can be maintained without depleting the resource base or damaging the environment in ways that reduce future generations' ability to grow.
7.1 Using and conserving resources
The distinction that governs the analysis is between renewable resources, which regenerate if harvested below their replacement rate, and non-renewable resources, which do not.
Growth based on extracting non-renewable resources raises measured income now while reducing future capacity, unless the proceeds are converted into other forms of capital: infrastructure, education, or a sovereign wealth fund. Norway invests its oil revenue in exactly this way, which is why extraction there is treated as a transfer between asset types rather than as pure income.
Renewable resources are still exhaustible if harvested faster than they regenerate, which is the tragedy-of-the-commons problem from 7.3 applied over time.
7.2 Growth, the environment and climate change
- Production and consumption generate negative externalities: emissions, pollution, habitat loss. These are the external costs of 7.4, appearing at the level of the whole economy.
- The costs fall disproportionately on future generations and on low-income countries, neither of which is party to the decisions creating them, which is exactly why the market does not price them.
- Climate damage feeds back into potential output through agricultural yields, extreme weather and displacement, so unchecked growth can eventually reduce the capacity that made it possible.
The counter-argument worth including is that growth also funds the technology and the abatement that reduce environmental damage, and that the relationship between income and some pollutants is an inverted U rather than a straight line. That does not hold for carbon dioxide, so the argument must not be overstated.
7.3 Policies to mitigate the environmental impact
These are the 8.1 policy instruments applied to an environmental target.
- Carbon taxes and other Pigouvian taxes, internalising the external cost so the price reflects the social cost.
- Tradable pollution permits, capping total emissions and letting the market allocate reductions to whoever can abate most cheaply.
- Regulation and standards, such as emissions limits and efficiency requirements.
- Subsidies for renewable energy and research, addressing the positive externality of clean technology.
- Property rights over common resources, so that someone has an incentive to conserve them.
- International agreements, necessary because emissions are a global externality that no single country can address alone, and undermined by the free-rider incentive that each country faces.
7.4 Judgement
Growth and sustainability are not simple opposites. Investment in education, health and institutions raises potential output without depleting natural capital, and a country that grows can afford abatement that a poor one cannot. The genuine conflict is narrower: it lies in growth built on resource depletion and unpriced emissions, and the policy answer is to price those effects rather than to abandon growth.
8. Integrated analysis and common traps
8.1 A complete chain
An economy grows at 5 per cent a year for a decade, driven by expanding oil extraction. Unemployment falls, GDP per head doubles, and the Gini coefficient rises.
Analysis: this is actual growth, and to the extent that extraction capacity has been built it is also potential growth. Rising employment and income are genuine gains, and higher tax revenue expands the state's capacity to provide services.
Evaluation: the rising Gini shows the growth is not inclusive, consistent with the enclave pattern in 6.1, since extraction employs few workers relative to its output and the returns accrue to capital. It is not sustainable either, because the resource is non-renewable, so measured income overstates the sustainable level unless the proceeds are being converted into other capital. The diagnostic question is what happened to the revenue: invested in education, infrastructure or a fund; this is sustainable development, and consumed; it is a decade of borrowed prosperity.
Judgement: the growth rate alone answers neither question. Inclusiveness needs a distributional measure and sustainability needs to know what the proceeds bought.
8.2 Common examination errors
- Explaining potential growth with a rise in aggregate demand.
- Treating a negative output gap as the normal state and a positive one as impossible.
- Assuming a rising budget deficit in a recession proves fiscal mismanagement, when automatic stabilisers produce exactly that.
- Describing the phases of the cycle without explaining any cause.
- Confusing inclusive growth with sustainable growth. One is about who gets the gains, the other about whether they last.
- Using GDP per head to argue that ordinary people are better off, forgetting it is a mean.
- Asserting that growth always damages the environment, ignoring both abatement technology and the funding of it.
- Recommending international agreements without acknowledging the free-rider problem that weakens them.
9. Paper 3 and Paper 4 mastery
Paper 3 tests: distinguishing actual from potential growth on a PPC or AD/AS diagram, identifying the sign of an output gap from data on unemployment and inflation, identifying an automatic stabiliser, and selecting the policy that raises potential rather than actual output.
Paper 4 asks whether economic growth is always desirable, or how a government should pursue growth that is both inclusive and sustainable. The structure that works is to separate the three questions the topic keeps distinct: how fast, for whom, and for how long. Take each in turn with a mechanism, then conclude on the specific economy's starting position, since a country with a large negative output gap and a country at full capacity need opposite policies.
Check you have it
Question 1
What needs to be removed to improve nominal GDP as a measure of comparative living standards?
Answer: D.
Question 2
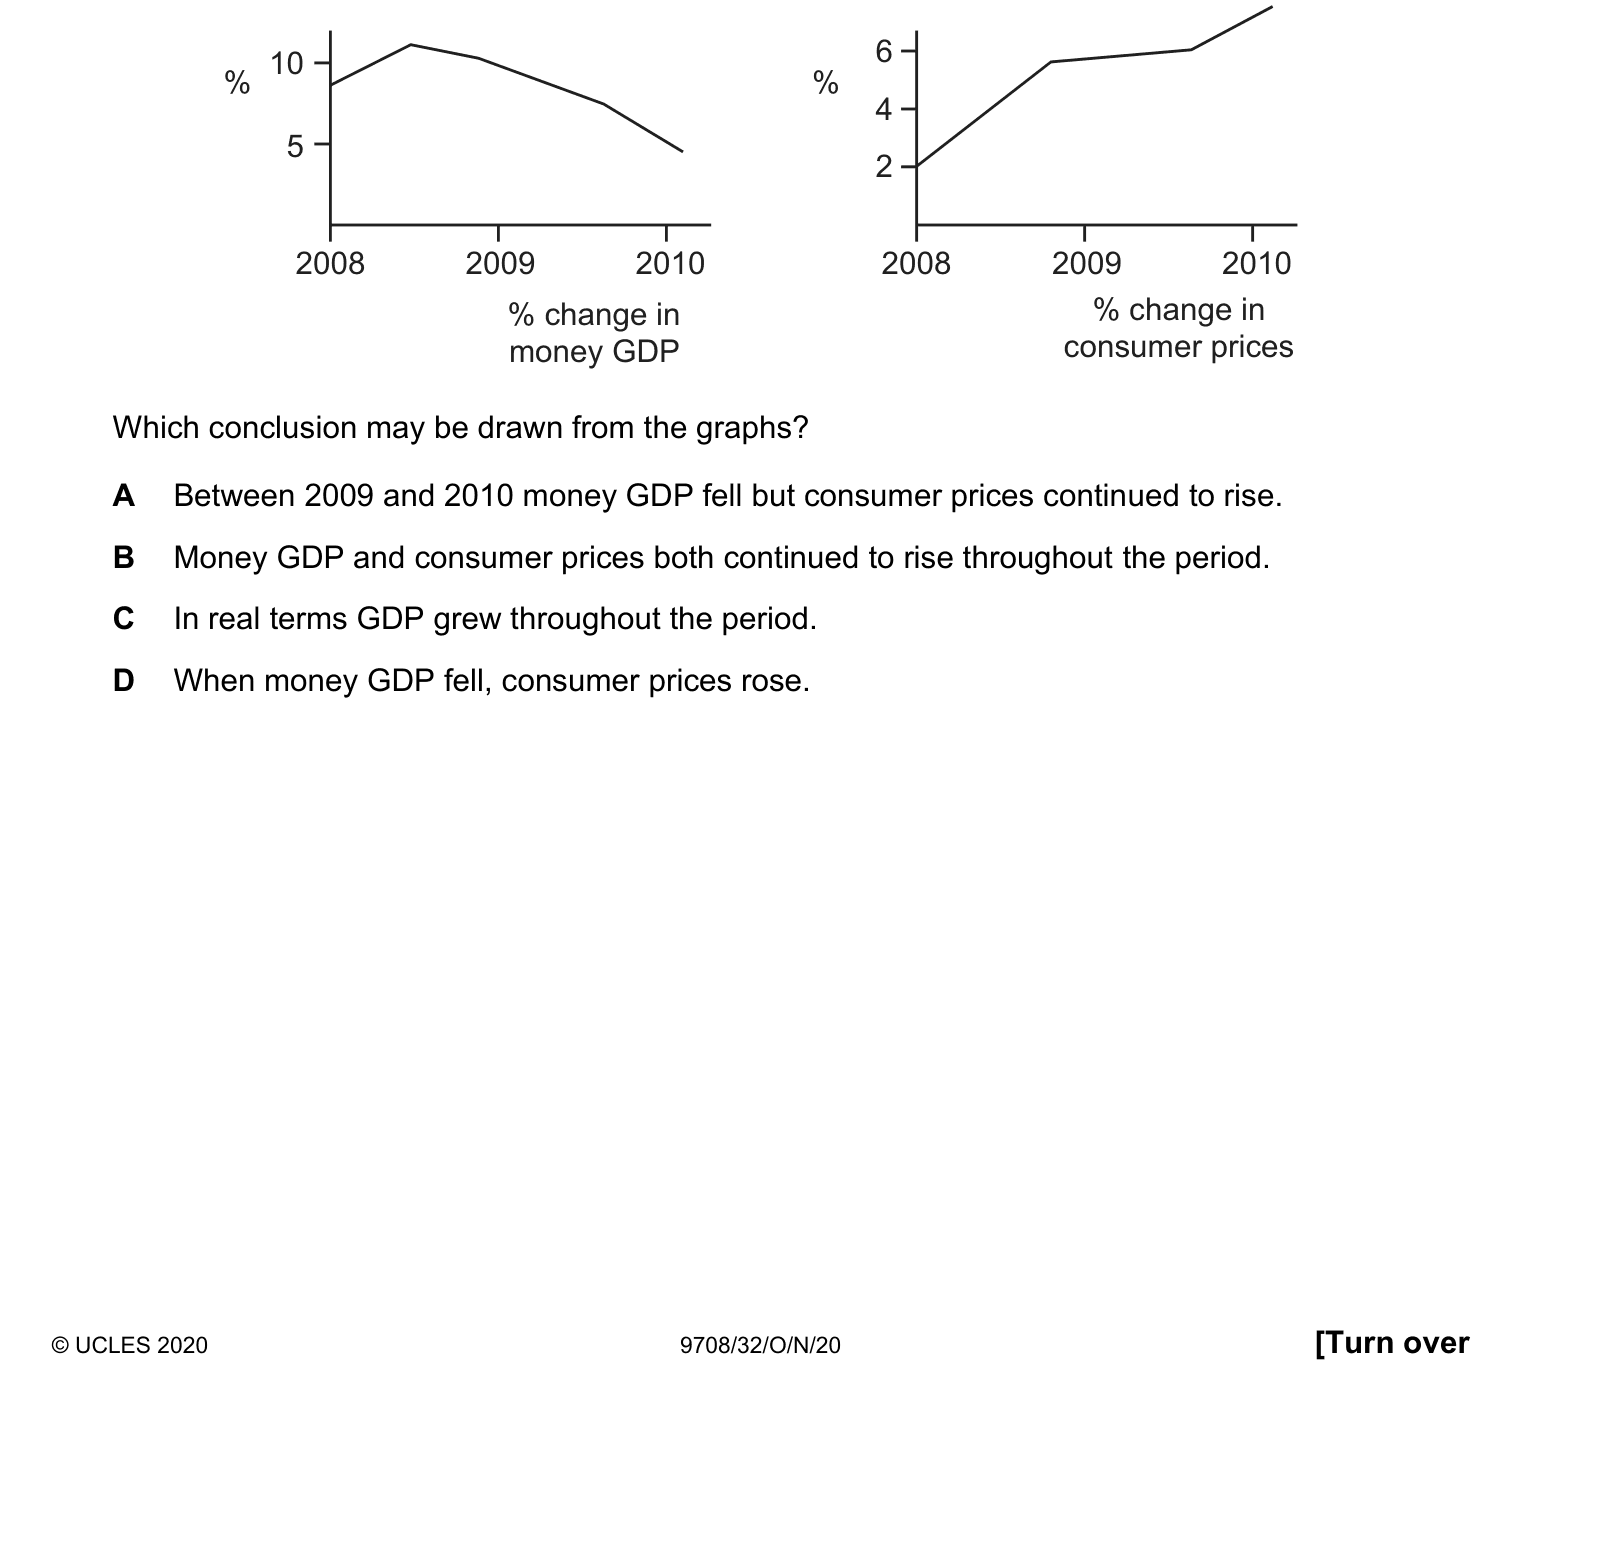
The graphs below show percentage changes in money GDP and consumer prices in a country between 2008 and 2010. 2008 2009 2010 10 5 % % change in money GDP 2008 2009 2010 6 4 2 % % change in consumer prices Which conclusion may be drawn from the graphs?
Answer: B.
Question 3
How must GDP at market prices (producer prices) be adjusted to find GDP at factor cost?
Answer: D.
10. Final checklist
A fully prepared learner can:
- distinguish actual from potential growth and state the causes of each;
- define positive and negative output gaps and identify each from unemployment and inflation data;
- explain why output gap estimates are unreliable and what follows for policy;
- name the phases of the business cycle and explain at least four causes, including the accelerator;
- explain how automatic stabilisers work in both directions and what determines their strength;
- match demand-side and supply-side policies to the appropriate output gap;
- define inclusive growth and explain why mean income can rise while the median does not;
- state at least four reasons growth may not be inclusive and four policies that make it more so;
- define sustainable growth and distinguish renewable from non-renewable resource use;
- explain why environmental damage is an externality and name at least five mitigating policies; and
- argue both sides of the growth and environment relationship without overstating either.
Related CIE 9708 topics
Not the topic you were looking for? Describe what you are stuck on in your own words and we will take you to the notes that answer it.