Demand and Supply Curves
Contents: 25 sections
Topic overview
Demand shows how much consumers are willing and able to buy at different prices. Supply shows how much producers are willing and able to sell at different prices.
The key analytical distinction is:
A change in the product's own price causes a movement along a curve. A change in any relevant non-price determinant causes the entire curve to shift.
1. Effective demand
Examination-ready definition
Effective demand is a desire for a good or service that is supported by both the willingness and the ability to pay for it.
A person may want a product without creating effective demand.
Example
A student may strongly want a £1000 laptop. If the student is unable to pay or borrow the money, the desire is not effective demand at that price.
Why the distinction matters
Market demand does not measure every want. It measures the quantities that consumers are willing and able to purchase at different prices over a stated period.
Core components
Effective demand requires:
- desire;
- willingness to buy;
- ability to pay;
- a particular price;
- a particular time period.
Common trap
Demand is not simply need.
A person may need housing or healthcare but may not have enough purchasing power to create the same market demand as a wealthier consumer.
2. Demand
Definition
Demand is the quantity of a good or service that consumers are willing and able to buy at each possible price during a given period of time, ceteris paribus.
Quantity demanded
Quantity demanded is the amount consumers are willing and able to buy at one specific price.
Demand refers to the entire relationship between price and quantity demanded.
Law of demand
Ceteris paribus, as the price of a good rises, quantity demanded falls; as the price falls, quantity demanded rises.
This is an inverse relationship.
Demand curve
A standard demand curve:
- has price on the vertical axis;
- has quantity demanded on the horizontal axis;
- slopes downward from left to right;
- is labelled D.
Use:
Why the demand curve slopes downward
1. Substitution effect
When a good becomes cheaper relative to substitutes, consumers may switch towards it.
Example:
- Price of train travel falls relative to coach travel
- some passengers switch to trains
- quantity demanded of train journeys rises.
2. Income effect
A lower price increases consumers' real purchasing power.
With the same money income, consumers can afford more of the product and/or other products.
3. Diminishing marginal benefit
Consumers may value additional units less highly than earlier units, so a lower price is needed to encourage the purchase of more units.
This idea is developed more fully at A Level.
Ceteris paribus assumption
The demand curve isolates the relationship between:
- the product's own price;
- quantity demanded.
Other determinants are assumed unchanged.
3. Individual demand
Definition
Individual demand is the quantity of a product that one consumer is willing and able to purchase at different prices during a given period.
Individual demand schedule
| Price per unit | Quantity demanded by Consumer A |
|---|---|
| $10 | 1 |
| $8 | 2 |
| $6 | 3 |
| $4 | 5 |
| $2 | 8 |
The schedule can be plotted to form the individual's demand curve.
Interpretation
At $6, Consumer A demands 3 units.
If price falls from $6 to $4, quantity demanded rises from 3 to 5 units. This is a movement along the same individual demand curve.
4. Market demand
Definition
Market demand is the total quantity of a product that all consumers in the market are willing and able to buy at each price during a given period.
Horizontal summation
Market demand is found by adding individual quantities demanded at each price.
| Price | Consumer A | Consumer B | Consumer C | Market demand |
|---|---|---|---|---|
| $10 | 1 | 0 | 2 | 3 |
| $8 | 2 | 1 | 3 | 6 |
| $6 | 3 | 2 | 5 | 10 |
| $4 | 5 | 4 | 7 | 16 |
At $6:
Market demand = 3 + 2 + 5 = 10 units.
Why market demand may change
Market demand can change because:
- an existing consumer changes quantity demanded due to price;
- consumers' incomes or preferences change;
- the number of consumers changes;
- prices of related goods change.
Individual versus market curve
A market demand curve generally lies farther to the right than an individual demand curve because it sums the quantities demanded by all consumers at each price.
5. Determinants of demand
A determinant of demand is a factor other than the product's own price that changes how much consumers wish to purchase at every price.
5.1 Income
Normal goods
For a normal good:
- Income rises
- demand increases
- demand curve shifts right.
Examples may include:
- restaurant meals;
- holidays;
- higher-quality clothing.
Inferior goods
For an inferior good:
- Income rises
- demand decreases
- demand curve shifts left.
Possible examples:
- very low-cost transport;
- basic own-brand products;
- low-quality substitutes.
A good is not inherently inferior for every consumer. Classification depends on actual consumer behaviour.
5.2 Prices of substitute goods
Substitutes can be consumed in place of each other.
Examples:
- tea and coffee;
- train and coach travel;
- competing smartphone brands.
Chain:
- Price of coffee rises
- tea becomes relatively cheaper
- demand for tea rises
- tea demand curve shifts right.
5.3 Prices of complementary goods
Complements are consumed together.
Examples:
- cars and fuel;
- printers and ink;
- games consoles and games.
Chain:
- Price of games consoles falls
- more consoles purchased
- demand for games rises
- games demand curve shifts right.
5.4 Tastes and preferences
Demand may change because of:
- fashion;
- health concerns;
- advertising;
- cultural change;
- environmental awareness;
- reviews or social media.
More favourable preferences shift demand right.
5.5 Expectations
Consumers may respond to expected future changes.
Examples:
- expected future price rise
- current demand may increase
- expected future income fall
- current demand may decrease
- expected shortage
- current demand may rise.
The effect depends on whether consumers can buy now and store or bring forward consumption.
5.6 Number of buyers and population
More buyers normally increase market demand.
Possible causes:
- population growth;
- immigration;
- market expansion;
- demographic change.
5.7 Distribution of income
Even if total national income is unchanged, a redistribution of income may change demand for particular products because income groups have different spending patterns.
5.8 Seasonal and environmental factors
Examples:
- hot weather raises demand for cold drinks;
- cold weather raises demand for heating;
- festivals raise demand for particular products.
5.9 Government policy
Demand may be influenced through:
- indirect taxes;
- subsidies to consumers;
- regulation;
- information campaigns;
- legal restrictions.
Some policy effects operate through price and therefore create a movement along the curve; others alter non-price conditions and shift demand. The diagram must match the mechanism described.
6. Increase and decrease in demand
Increase in demand
An increase in demand means consumers are willing and able to buy more at every price.
The demand curve shifts to the right, from D1 to D2.
Use:
Possible causes:
- higher income for a normal good;
- lower income for an inferior good;
- higher price of a substitute;
- lower price of a complement;
- more favourable tastes;
- greater number of buyers;
- expectation of higher future prices.
Decrease in demand
A decrease in demand means consumers are willing and able to buy less at every price.
The curve shifts left.
Possible causes are the reverse of those above.
Language
Correct:
- increase in demand;
- decrease in demand;
- shift right;
- shift left.
Avoid using "extension" or "contraction" for a curve shift. Those terms refer to movement along a curve.
7. Movement along the demand curve

A change in the product's own price causes movement along the existing demand curve.
Extension in quantity demanded
- Price falls
- quantity demanded rises
- movement down and right along D.
Contraction in quantity demanded
- Price rises
- quantity demanded falls
- movement up and left along D.
Crucial distinction
- change in quantity demanded = movement along;
- change in demand = shift of the curve.
Use:
8. Supply
Definition
Supply is the quantity of a good or service that producers are willing and able to sell at each possible price during a given period, ceteris paribus.
Quantity supplied
Quantity supplied is the amount producers are willing and able to sell at one specific price.
Supply is the entire price-quantity relationship.
Law of supply
Ceteris paribus, as price rises, quantity supplied rises; as price falls, quantity supplied falls.
This is a direct relationship.
Supply curve
A standard supply curve:
- has price on the vertical axis;
- has quantity supplied on the horizontal axis;
- slopes upward from left to right;
- is labelled S.
Use:
Why the supply curve slopes upward
A higher market price may:
- increase potential profit;
- make higher-cost production worthwhile;
- encourage firms to use overtime or additional capacity;
- attract output from alternative uses.
At lower prices, some production may not cover opportunity cost or marginal cost.
9. Individual supply
Definition
Individual supply is the quantity that one producer is willing and able to sell at different prices during a given period.
Individual supply schedule
| Price | Quantity supplied by Firm A |
|---|---|
| $2 | 0 |
| $4 | 2 |
| $6 | 5 |
| $8 | 8 |
| $10 | 12 |
The schedule can be plotted to form the firm's supply curve.
10. Market supply
Definition
Market supply is the total quantity that all producers in a market are willing and able to sell at each price during a given period.
Horizontal summation
| Price | Firm A | Firm B | Firm C | Market supply |
|---|---|---|---|---|
| $4 | 2 | 1 | 0 | 3 |
| $6 | 5 | 3 | 2 | 10 |
| $8 | 8 | 6 | 4 | 18 |
| $10 | 12 | 9 | 7 | 28 |
At $8:
Market supply = 8 + 6 + 4 = 18 units.
An increase in the number of firms normally shifts market supply right.
11. Determinants of supply
11.1 Costs of production
Costs include:
- wages;
- raw materials;
- energy;
- rent;
- transport;
- borrowing costs.
Chain:
- Input costs fall
- profit at each product price rises
- firms are willing to supply more
- supply shifts right.
Higher costs shift supply left.
11.2 Productivity and technology
Better technology or productivity can reduce unit cost and allow more output from the same inputs.
- Productivity rises
- cost per unit may fall
- supply increases.
11.3 Indirect taxes
A tax on production raises firms' costs.
- Indirect tax rises
- supply decreases
- supply curve shifts left.
The exact treatment of taxes is developed later in Topic 3.2.
11.4 Subsidies
A subsidy reduces the net cost of production or increases revenue received by firms.
- Subsidy rises
- supply increases
- curve shifts right.
11.5 Prices of related goods in production
Competitive supply
Goods compete for the same resources.
Example:
A farmer can use land for wheat or maize.
- Price of maize rises
- maize becomes more profitable
- land moves from wheat to maize
- supply of wheat falls.
Joint supply
Two products are produced together.
Examples:
- beef and leather;
- crude oil and associated products.
Higher production of one may increase supply of the joint product.
11.6 Number of firms
More firms in the market generally increase market supply.
Firm exit decreases market supply.
11.7 Expectations
If firms expect a higher future price; they may reduce current supply by holding stocks, provided storage is possible.
Expectations can also encourage current production and investment, so the effect must be explained in context.
11.8 Natural factors
Supply may be affected by:
- weather;
- disease;
- natural disasters;
- harvest conditions;
- resource discoveries.
These are especially important for primary products.
11.9 Government regulation
Regulations may:
- raise compliance costs;
- restrict production;
- improve productivity or infrastructure;
- change the number of firms able to operate.
The direction depends on the policy.
11.10 Producer objectives
A change in objectives may influence willingness to supply at each price.
For example, a state enterprise may continue supplying output that a profit-maximising firm would reduce.
12. Increase and decrease in supply
Increase in supply
An increase in supply means producers are willing and able to sell more at every price.
The supply curve shifts right, from S1 to S2.
Use:
Possible causes:
- lower input costs;
- better technology;
- higher productivity;
- lower indirect taxes;
- higher subsidies;
- more firms;
- favourable natural conditions.
Decrease in supply
A decrease in supply means less is supplied at every price.
The supply curve shifts left.
Possible causes include:
- higher costs;
- taxation;
- lower productivity;
- adverse weather;
- fewer firms;
- tighter regulation.
13. Movement along the supply curve

A change in the product's own price causes movement along the existing supply curve.
Extension in quantity supplied
- Price rises
- quantity supplied rises
- movement up and right along S.
Contraction in quantity supplied
- Price falls
- quantity supplied falls
- movement down and left along S.
Crucial distinction
- change in quantity supplied = movement along;
- change in supply = shift of the curve.
Use:
14. Complete movement-versus-shift framework
| Event | Diagram effect |
|---|---|
| Product's own price changes | Movement along demand and/or supply curve |
| Consumer income changes | Demand curve shifts |
| Price of substitute or complement changes | Demand curve shifts |
| Tastes change | Demand curve shifts |
| Number of buyers changes | Market demand shifts |
| Input cost changes | Supply curve shifts |
| Technology changes | Supply curve shifts |
| Tax or subsidy changes | Supply curve shifts |
| Number of firms changes | Market supply shifts |
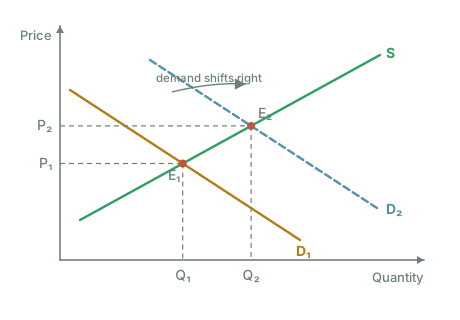
Decision rule
Ask:
Did the price of the product itself change, or did another condition change?
- own price
- movement along
- other determinant
- shift.
15. Simultaneous changes
A real market may experience several changes at the same time.
Example:
- consumer incomes rise;
- production costs rise.
This can shift demand right and supply left simultaneously.
The current topic focuses on identifying the separate curves correctly. The resulting equilibrium effects are developed in Topic 2.4.
Exam discipline
When several changes occur:
- identify the demand-side event;
- identify the supply-side event;
- shift each curve separately;
- do not treat the change as movement along unless the product's own price is the original cause.
16. Market applications
Restaurant meals
Demand may rise because of:
- higher income;
- favourable reviews;
- population growth.
Supply may fall because of:
- higher wages;
- higher food costs;
- tighter licensing rules.
Agricultural products
Demand may change due to:
- health preferences;
- population;
- prices of substitutes.
Supply may change due to:
- weather;
- fertiliser prices;
- technology;
- disease.
Foreign currency
Demand and supply curves can also be used for currencies. The application is studied in Topic 6.4.
Transport
Demand may depend on:
- income;
- price of fuel;
- price of alternative transport;
- employment patterns.
Supply may depend on:
- wage costs;
- energy prices;
- capacity;
- government subsidies.
17. Common misconceptions and examination traps
Trap 1: Demand means desire
Demand must be effective: willingness and ability to pay.
Trap 2: Demand and quantity demanded are identical
Demand is the whole curve. Quantity demanded is one amount at one price.
Trap 3: A lower price shifts the demand curve right
A lower own price causes movement down the existing curve.
Trap 4: Higher income always increases demand
Not for inferior goods.
Trap 5: Higher price of a complement increases demand
It normally decreases demand for the related good.
Trap 6: Higher price of a substitute decreases demand
It normally increases demand for the other substitute.
Trap 7: Supply means stock
Stock is the amount physically available. Supply is the amount offered for sale at different prices during a period.
Trap 8: Supply and quantity supplied are identical
Supply is the whole curve; quantity supplied is one amount at one price.
Trap 9: Higher production costs cause movement along supply
Costs are a non-price determinant, so supply shifts.
Trap 10: A tax shifts demand
A tax on producers normally shifts supply. A tax on consumers may affect demand, but the mechanism and tax design must be specified.
Trap 11: Extension means a curve shift
Extension and contraction describe movements along curves.
Trap 12: Market demand is the average of individual demand
It is the sum of individual quantities at each price.
Trap 13: Market supply is the supply of the largest firm
It is the sum of all firms' quantities at each price.
Trap 14: A curve must always be straight
Straight lines are a simplification. The economic relationship matters more than exact artistic shape unless the question specifies otherwise.
Trap 15: Price is a determinant that shifts the curve
The product's own price is already represented on the axes and causes movement along the curve.
18. Diagram-quality checklist
For every demand or supply diagram:
- Put price on the vertical axis.
- Put quantity on the horizontal axis.
- Label curves D or S.
- Use D1 and D2 or S1 and S2 for shifts.
- Add a directional arrow.
- State the determinant causing the change.
- Distinguish movement from shift in writing.
- Use ceteris paribus where relevant.
Diagram assets
demand-curve-movement.pngdemand-shift-right.pngsupply-curve-movement.pngsupply-shift-right.pngdemand-movement-vs-shift.pngsupply-movement-vs-shift.png
These were created from image-generated textbook panels, then cropped, enlarged, corrected and manually inspected.
19. Paper 1 technique
Typical tasks include:
- define effective demand;
- distinguish individual and market curves;
- add quantities to calculate market demand or supply;
- identify the correct curve shift;
- distinguish substitutes and complements;
- distinguish movement along from a shift;
- identify the determinant behind a scenario.
Fast MCQ method
- Identify whether the question concerns demand or supply.
- Identify the variable that changed.
- Decide movement or shift.
- Decide right or left.
- Check whether the good is normal or inferior, substitute or complement.
20. Paper 2 technique
Four-mark demand-shift answer
Question:
Explain how an increase in consumer income may affect demand for restaurant meals. [4]
Model answer:
If restaurant meals are a normal good, higher income increases consumers' willingness and ability to buy them. At every price, a greater quantity is demanded, so the demand curve shifts to the right from D1 to D2. The size of the shift depends on how strongly demand responds to income.
Four-mark supply-shift answer
Question:
Explain how a fall in energy prices may affect the supply of manufactured goods. [4]
Model answer:
Energy is a cost of production. A fall in energy prices reduces firms' costs and may increase profit at each product price. Producers are willing and able to supply more at every price, so the supply curve shifts right from S1 to S2.
Six-mark distinction answer
Question:
Explain the difference between an increase in demand and an extension in quantity demanded. [6]
Model answer:
An extension in quantity demanded is caused by a fall in the product's own price and is shown by movement down and to the right along the existing demand curve. An increase in demand is caused by a non-price determinant such as higher income for a normal good or a rise in the price of a substitute. It is shown by the entire demand curve shifting right, because more is demanded at every price.
21. Active recall
- Define effective demand.
- Define demand.
- Define quantity demanded.
- State the law of demand.
- Why does the demand curve slope downward?
- Define individual demand.
- Define market demand.
- How is market demand calculated?
- List six determinants of demand.
- Explain the effect of higher income on a normal good.
- Explain the effect of higher income on an inferior good.
- Explain the effect of a rise in the price of a substitute.
- Explain the effect of a fall in the price of a complement.
- Distinguish an increase in demand from an extension.
- Define supply.
- Define quantity supplied.
- State the law of supply.
- Why does a supply curve usually slope upward?
- Define individual supply.
- Define market supply.
- How is market supply calculated?
- List six determinants of supply.
- Explain how lower costs affect supply.
- Explain how technology affects supply.
- Explain the effect of an indirect tax.
- Explain the effect of a subsidy.
- Distinguish an increase in supply from an extension.
- What is competitive supply?
- What is joint supply?
- State the movement-versus-shift decision rule.
22. One-minute revision
Demand
Willingness and ability to buy at different prices.
Effective demand
Desire backed by willingness and ability to pay.
Market demand
Sum of all individual quantities demanded at each price.
Supply
Willingness and ability to sell at different prices.
Market supply
Sum of all firms' quantities supplied at each price.
Demand movement
Own price changes.
Demand shift
Income, related prices, tastes, expectations or number of buyers changes.
Supply movement
Own price changes.
Supply shift
Costs, technology, taxes, subsidies, natural factors or number of firms changes.
Check you have it
Question 1
The diagrams show initial equilibrium positions at Y1P1. Which diagram reflects the impact on an economy of higher unit wage costs and an improvement in the balance of trade?
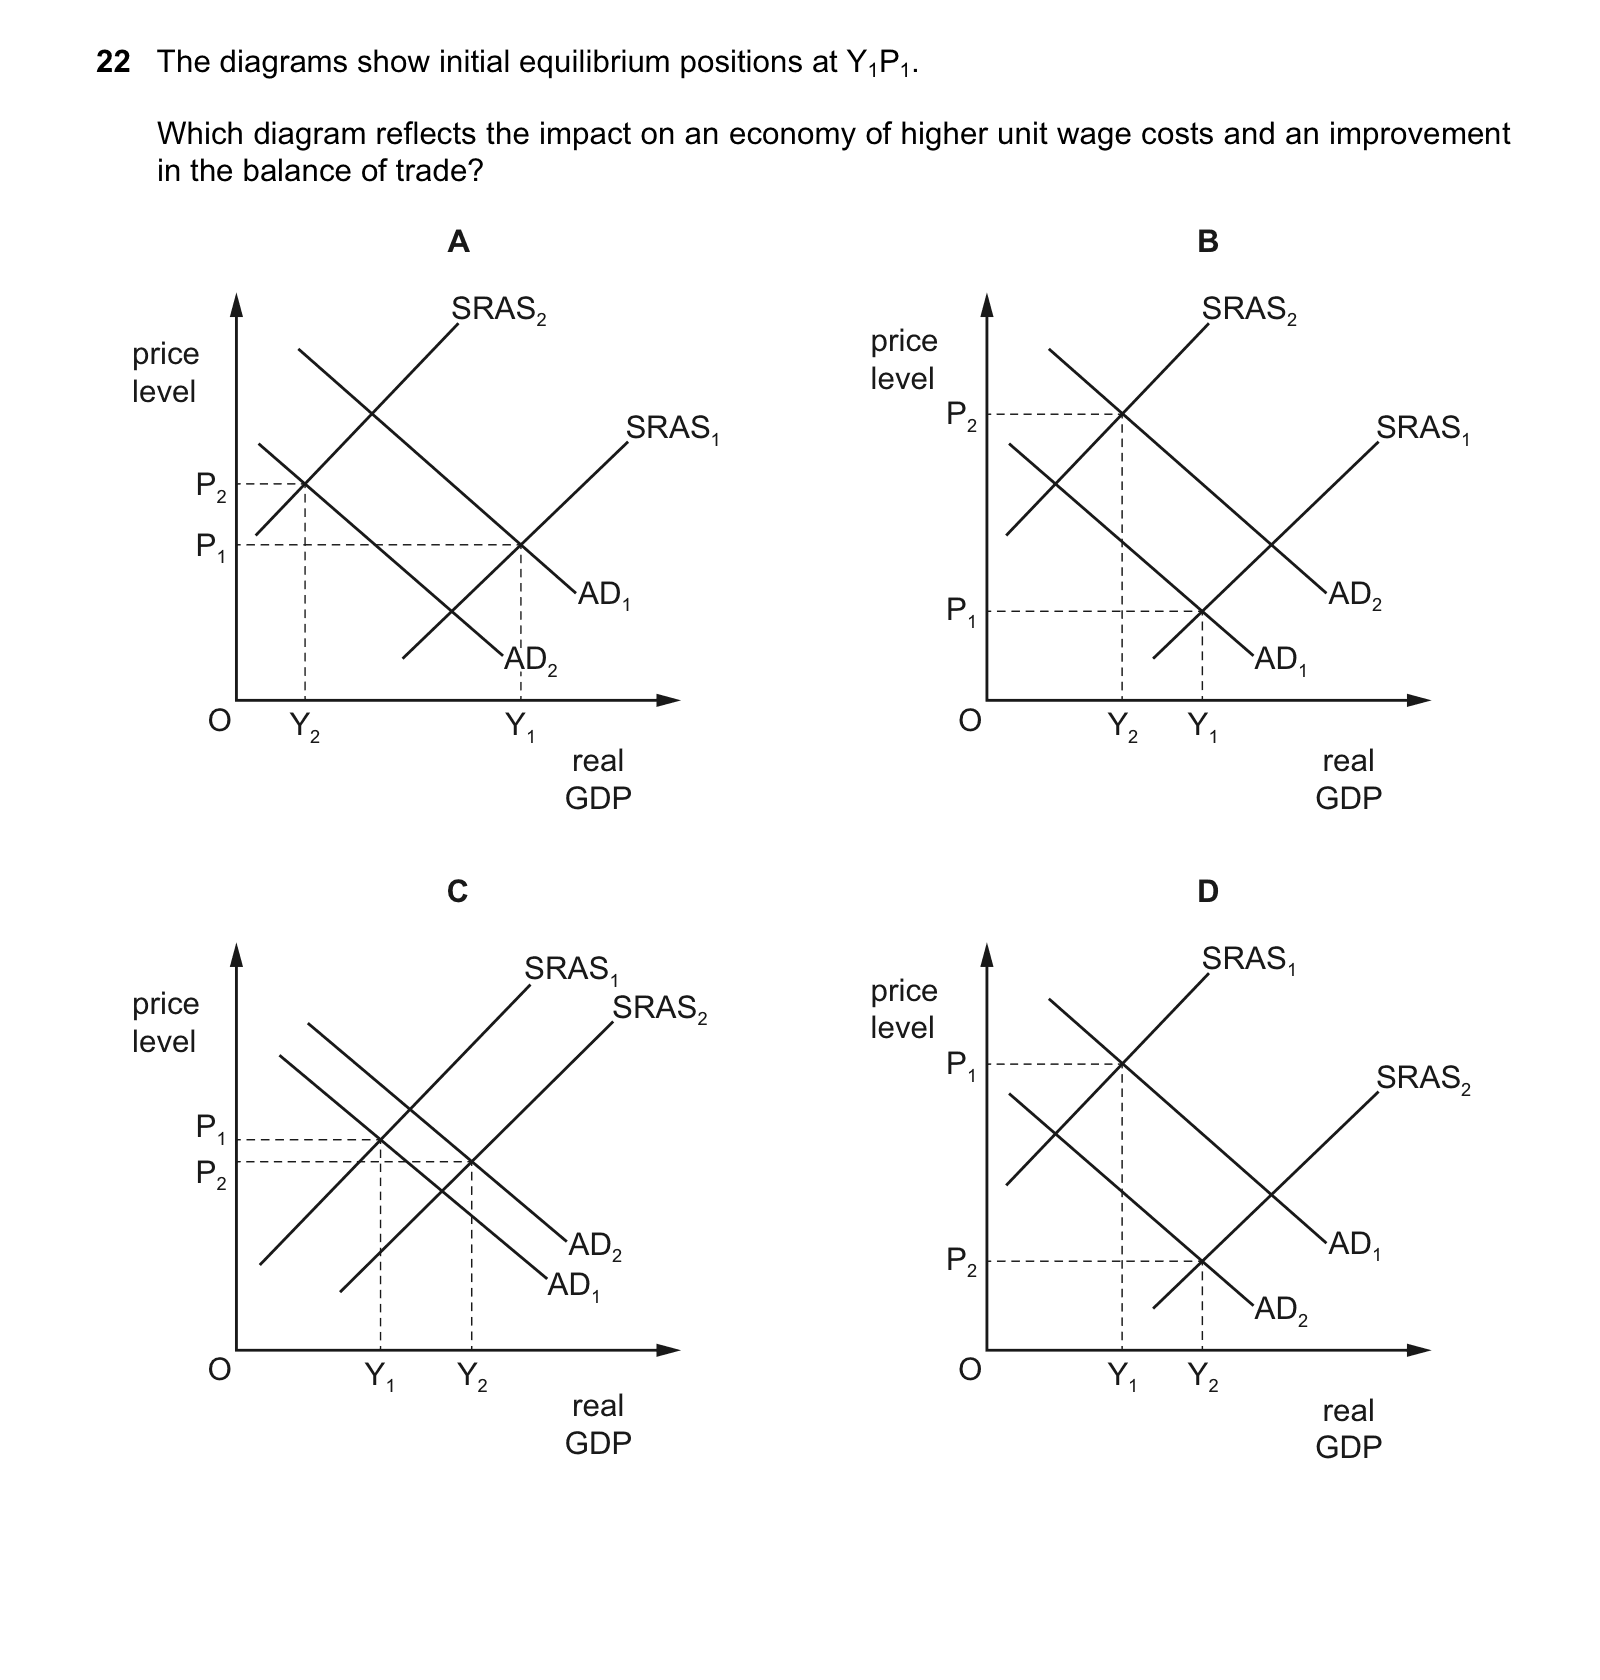
Answer: B.
Explanation:
- An improvement in the balance of trade means that the country is exporting more than it is importing, leading to an increase in net exports and ultimately boosting the aggregate demand (AD) curve.
- Higher unit wage costs would lead to an increase in production costs for firms, shifting the short-run aggregate supply (SRAS) curve to the left as they would need to increase prices to maintain profit margins.
- The combination of an upward shift in the AD curve and a leftward shift in the SRAS curve would lead to an increase in the price level (from P1 to P2) and a decrease in real GDP (from Y1 to Y2), which is depicted in diagram B.
Question 2
The diagram shows the supply curve of a product. The government imposes a specific indirect tax of $5 on the product. How will the price elasticity of supply of the product change?
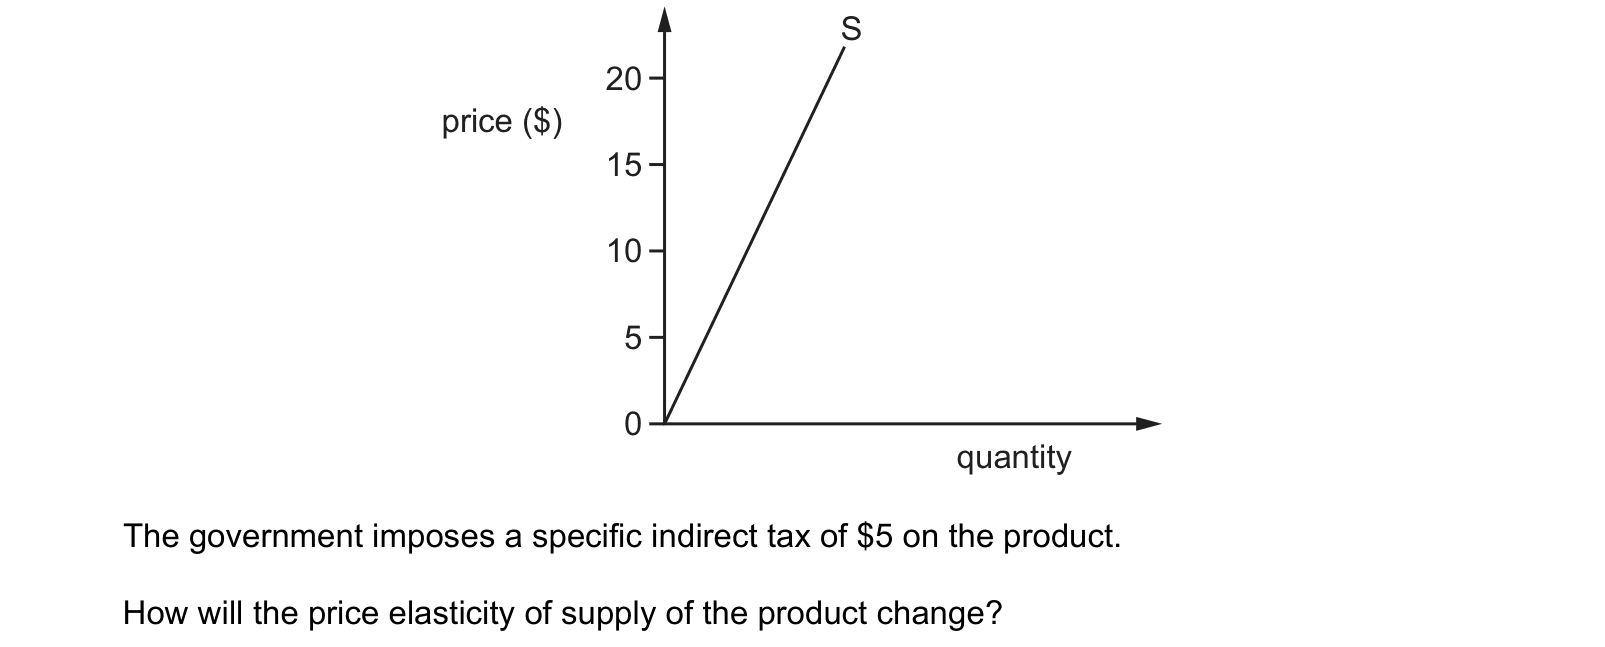
Answer: D.
Question 3
The demand for houses in London has caused house prices to rise considerably in the last five years. Many people cannot now afford to buy a house.
What can be concluded from this?
Answer: B.
Perfect exam sentence
A change in the product's own price causes a movement along the curve; a change in another determinant shifts the entire curve.
What the syllabus asks for on this topicOfficial syllabus coverage · Product mastery map
Official syllabus coverage
Students must understand:
- 2.1.1 effective demand;
- 2.1.2 individual and market demand and supply;
- 2.1.3 determinants of demand;
- 2.1.4 determinants of supply;
- 2.1.5 causes of a shift in the demand curve;
- 2.1.6 causes of a shift in the supply curve;
- 2.1.7 the distinction between a shift of a demand or supply curve and a movement along these curves.
Product mastery map
The topic is tracked through seven portal skills:
- effective demand;
- individual and market demand;
- individual and market supply;
- determinants and shifts of demand;
- determinants and shifts of supply;
- movements along demand and supply curves;
- application of demand-and-supply diagrams to unfamiliar markets.
Related CIE 9708 topics
Not the topic you were looking for? Describe what you are stuck on in your own words and we will take you to the notes that answer it.