Demand and Supply Curves: three questions to try now
Real past-paper questions, the answer key from the mark scheme, and the explanation that goes with it. No account needed to answer them.
Question 1
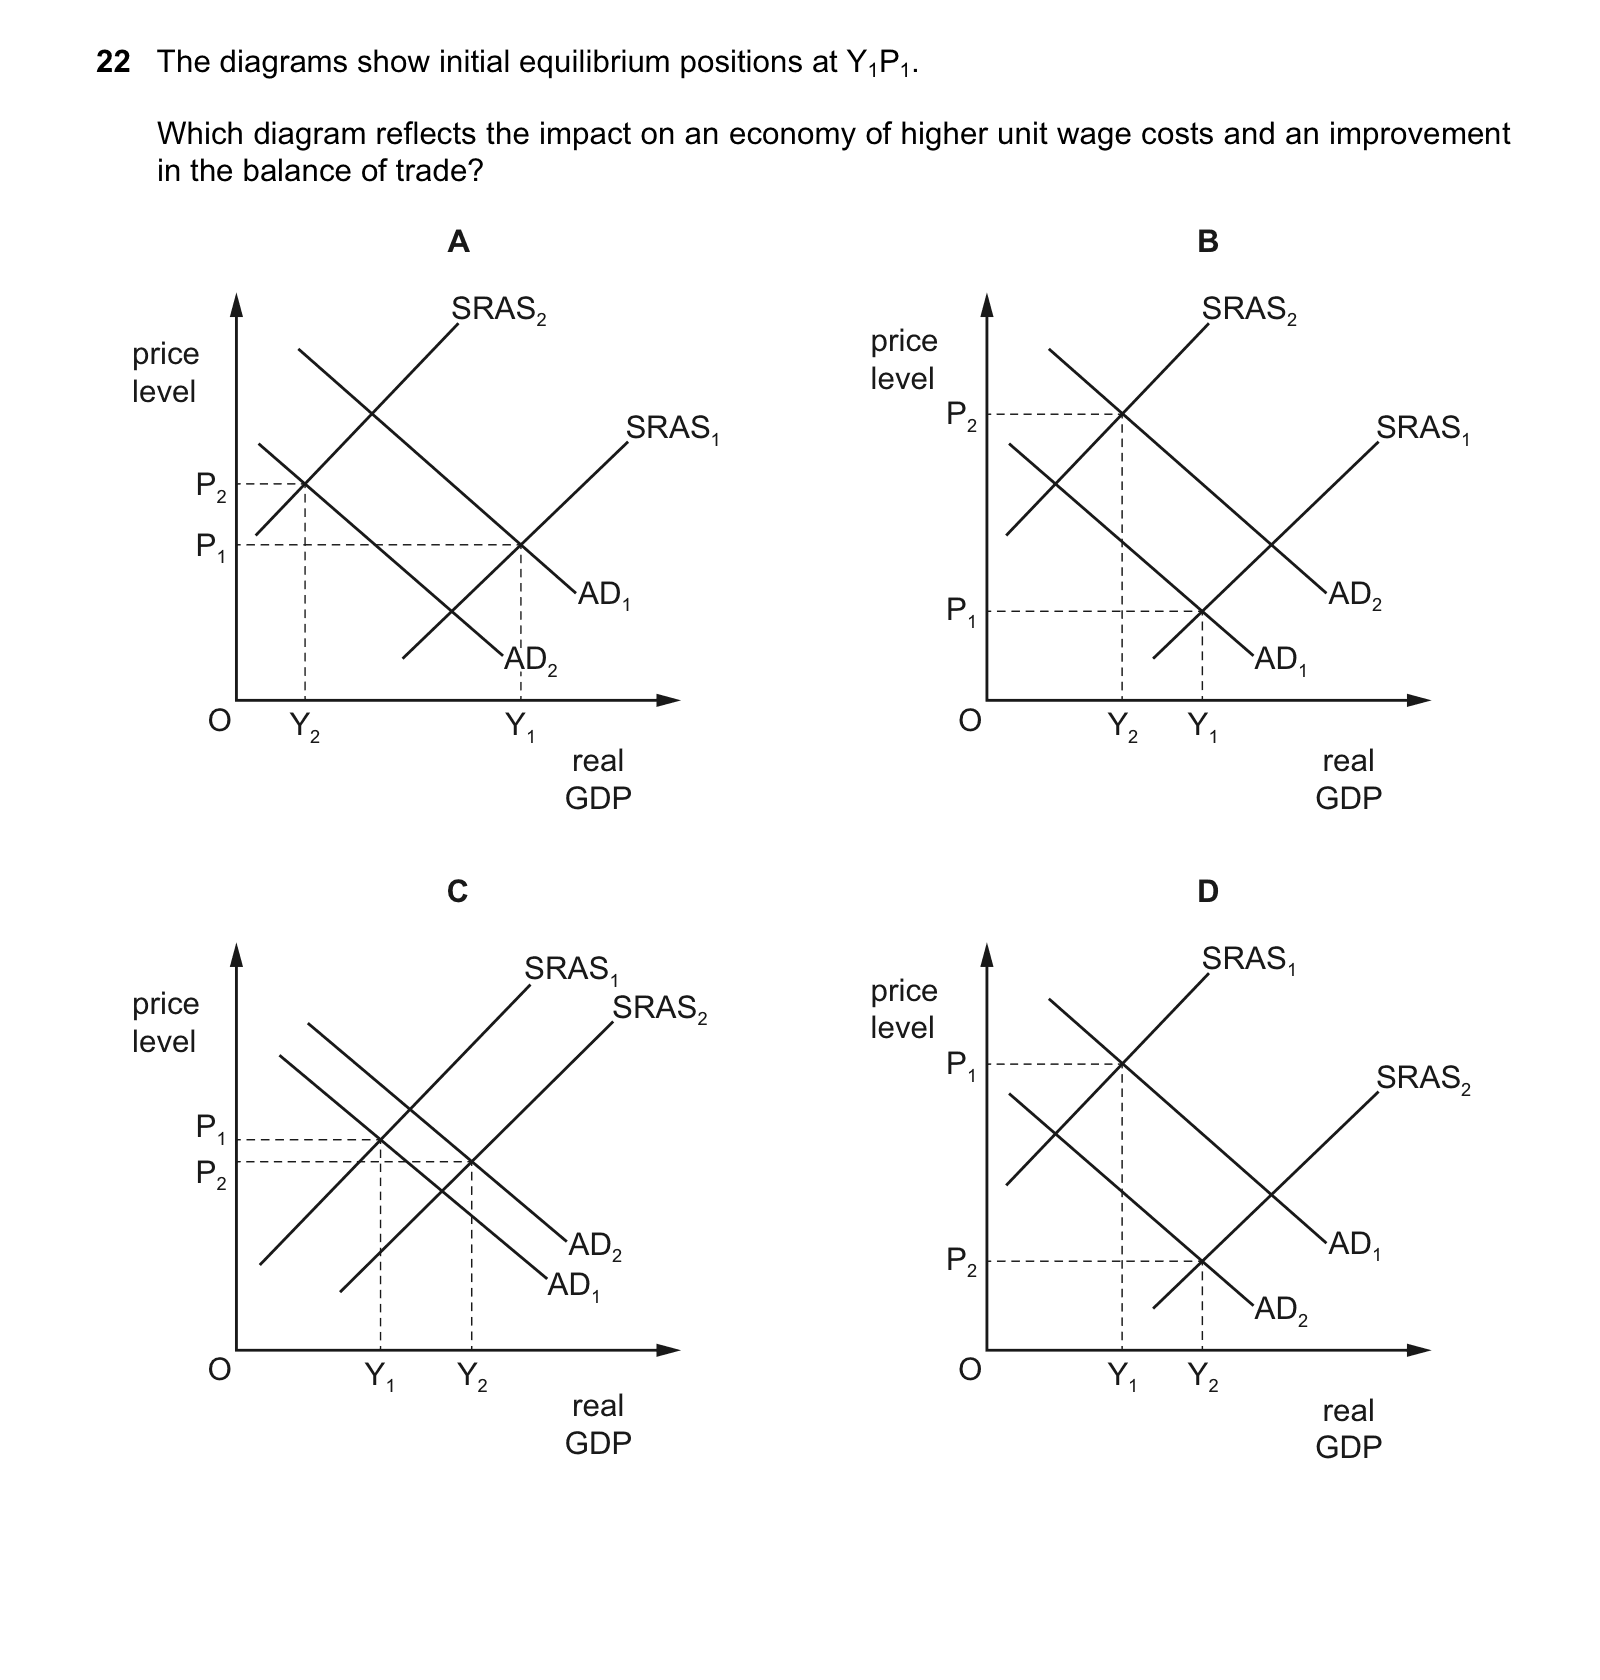
The diagrams show initial equilibrium positions at Y1P1. Which diagram reflects the impact on an economy of higher unit wage costs and an improvement in the balance of trade?
Answer: B.
Explanation:
- An improvement in the balance of trade means that the country is exporting more than it is importing, leading to an increase in net exports and ultimately boosting the aggregate demand (AD) curve.
- Higher unit wage costs would lead to an increase in production costs for firms, shifting the short-run aggregate supply (SRAS) curve to the left as they would need to increase prices to maintain profit margins.
- The combination of an upward shift in the AD curve and a leftward shift in the SRAS curve would lead to an increase in the price level (from P1 to P2) and a decrease in real GDP (from Y1 to Y2), which is depicted in diagram B.
Question 2
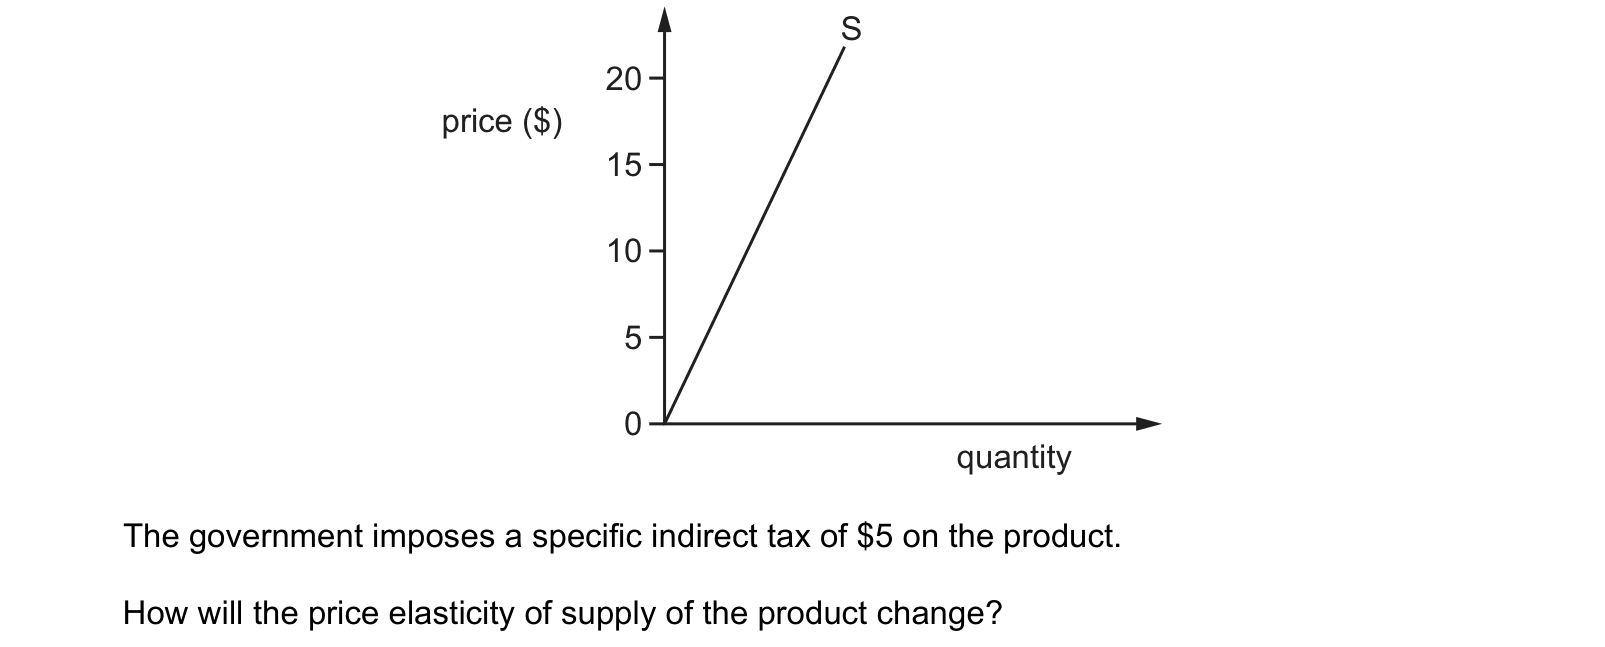
The diagram shows the supply curve of a product. The government imposes a specific indirect tax of $5 on the product. How will the price elasticity of supply of the product change?
Answer: D.
Question 3
The demand for houses in London has caused house prices to rise considerably in the last five years. Many people cannot now afford to buy a house.
What can be concluded from this?
Answer: B.
What this practice covers
These questions are drawn from past CIE 9708 papers and filtered to demand and supply curves. You answer, you find out immediately whether you were right, and you get the reasoning for the correct option and for each distractor. Wrong answers go to a mistakes locker so you can come back to exactly those.
Practice is free. You need an account only so your progress and your mistakes are still there next time.
What examiners see students get wrong here
These are the errors that cost marks on demand and supply curves, taken from our own topic notes. Read them before you practise and you will recognise the traps in the questions.
- Demand means desire. Demand must be effective: willingness and ability to pay.
- Demand and quantity demanded are identical. Demand is the whole curve. Quantity demanded is one amount at one price.
- A lower price shifts the demand curve right. A lower own price causes movement down the existing curve.
- Higher income always increases demand. Not for inferior goods.
- Higher price of a complement increases demand. It normally decreases demand for the related good.
- Higher price of a substitute decreases demand. It normally increases demand for the other substitute.
- Supply means stock. Stock is the amount physically available. Supply is the amount offered for sale at different prices during a period.
- Supply and quantity supplied are identical. Supply is the whole curve; quantity supplied is one amount at one price.
Revise it first
If any of the above is unfamiliar, work through the notes before practising: Demand and Supply Curves revision notes.