The Interaction of Demand and Supply
Contents: 33 sections
The topic in one idea
Market equilibrium occurs where quantity demanded equals quantity supplied. Changes in demand or supply create disequilibrium, and price changes help coordinate buyers and sellers towards a new equilibrium.
Topic 2.4 brings together:
- demand;
- supply;
- elasticity;
- equilibrium;
- interdependent markets;
- resource allocation.
1. Market equilibrium
Examination-ready definition
Market equilibrium occurs at the price where quantity demanded equals quantity supplied.
At equilibrium:
- there is no excess demand;
- there is no excess supply;
- there is no inherent pressure for the market price to change;
- planned purchases equal planned sales.
Equilibrium price
The price at which quantity demanded equals quantity supplied.
Equilibrium quantity
The quantity bought and sold at the equilibrium price.
Diagram interpretation
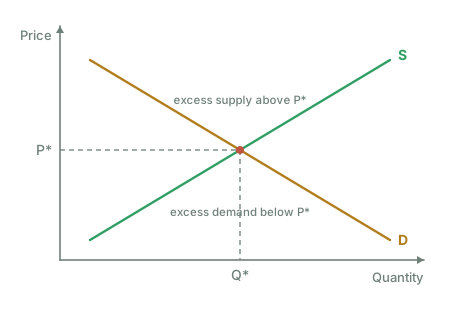
On a standard demand and supply diagram:
- the downward-sloping demand curve intersects the upward-sloping supply curve;
- the intersection is labelled E;
- a horizontal guide identifies equilibrium price Pe;
- a vertical guide identifies equilibrium quantity Qe.
Important qualification
Equilibrium does not mean:
- fair;
- socially optimal;
- affordable to everyone;
- environmentally sustainable;
- permanently fixed.
It only means that planned quantity demanded equals planned quantity supplied at that price.
2. Disequilibrium
Examination-ready definition
Disequilibrium occurs when quantity demanded does not equal quantity supplied at the current market price.
There are two principal forms:
- excess demand or shortage;
- excess supply or surplus.
3. Excess demand or shortage
Meaning
A shortage occurs when:
This normally occurs when the current price is below equilibrium.
Diagram logic
At a price below equilibrium:
- consumers wish to buy a relatively large quantity;
- firms wish to sell a relatively small quantity;
- quantity demanded exceeds quantity supplied.
The shortage is measured horizontally:
Price-adjustment chain
- Price below equilibrium
- quantity demanded exceeds quantity supplied
- consumers compete for scarce output
- firms observe unsatisfied demand
- price rises
- quantity demanded contracts and quantity supplied extends
- shortage narrows
- equilibrium is restored.
Non-price rationing during a shortage
Before price adjusts fully, shortages may create:
- queues;
- waiting lists;
- informal rationing;
- favouritism;
- black markets;
- empty shelves.
4. Excess supply or surplus
Meaning
A surplus occurs when:
This normally occurs when the current price is above equilibrium.
Diagram logic
At a price above equilibrium:
- firms wish to sell a relatively large quantity;
- consumers wish to buy a relatively small quantity;
- unsold stock accumulates.
The surplus is measured horizontally:
Price-adjustment chain
- Price above equilibrium
- quantity supplied exceeds quantity demanded
- unsold stock accumulates
- firms reduce price
- quantity demanded extends and quantity supplied contracts
- surplus narrows
- equilibrium is restored.
Possible firm responses
Firms may also:
- reduce production;
- offer discounts;
- increase advertising;
- store goods;
- dispose of perishable output;
- leave the market in the long run.
5. Why markets may not adjust immediately
The price mechanism is a model, and adjustment can take time.
Possible reasons include:
- menu costs;
- contracts;
- imperfect information;
- price controls;
- expectations;
- stock limitations;
- production delays;
- market power;
- government intervention.
A market can therefore remain in disequilibrium for a period.
6. Increase in demand
An increase in demand shifts the demand curve right from D1 to D2.
At the original price:
- quantity demanded increases;
- quantity supplied has not yet changed;
- a shortage emerges.
Price then rises, causing an extension of supply.
Final result
- Increase in demand
- equilibrium price rises
- equilibrium quantity rises.
Examples
- rising income for a normal good;
- increased popularity;
- population growth;
- higher price of a substitute;
- lower price of a complement.
Analytical chain
- Demand shifts right
- excess demand at the original price
- upward pressure on price
- firms extend quantity supplied
- consumers contract quantity demanded along the new demand curve
- new equilibrium at higher price and quantity.
7. Decrease in demand
A decrease in demand shifts demand left from D1 to D2.
At the original price:
- quantity demanded falls;
- quantity supplied temporarily exceeds quantity demanded;
- a surplus emerges.
Price falls, causing a contraction of supply.
Final result
- Decrease in demand
- equilibrium price falls
- equilibrium quantity falls.
Examples
- falling income for a normal good;
- changing tastes;
- population decline;
- lower price of a substitute;
- higher price of a complement.
8. Increase in supply
An increase in supply shifts the supply curve right from S1 to S2.
At the original price:
- firms wish to supply more;
- quantity supplied exceeds quantity demanded;
- a surplus emerges.
Price falls, causing an extension of demand.
Final result
- Increase in supply
- equilibrium price falls
- equilibrium quantity rises.
Examples
- lower production costs;
- improved technology;
- subsidy;
- favourable weather;
- more firms entering the market.
Analytical chain
- Supply shifts right
- excess supply at the original price
- downward pressure on price
- consumers extend quantity demanded
- firms contract quantity supplied along the new supply curve
- new equilibrium at lower price and higher quantity.
9. Decrease in supply
A decrease in supply shifts supply left from S1 to S2.
At the original price:
- firms supply less;
- quantity demanded exceeds quantity supplied;
- a shortage emerges.
Price rises, causing a contraction of demand.
Final result
- Decrease in supply
- equilibrium price rises
- equilibrium quantity falls.
Examples
- higher production costs;
- indirect tax;
- adverse weather;
- fall in productivity;
- firms leaving the market.
10. Summary of single-curve shifts
| Change | Equilibrium price | Equilibrium quantity |
|---|---|---|
| Demand increases | Rises | Rises |
| Demand decreases | Falls | Falls |
| Supply increases | Falls | Rises |
| Supply decreases | Rises | Falls |
This table should be memorised, but exam answers must still explain the adjustment process.
11. Role of elasticity in equilibrium changes
Elasticity affects the size of price and quantity changes.
Increase in demand
If supply is inelastic:
- price tends to rise substantially;
- quantity rises relatively little.
If supply is elastic:
- quantity tends to rise substantially;
- price rises relatively little.
Decrease in supply
If demand is inelastic:
- price tends to rise substantially;
- quantity falls relatively little.
If demand is elastic:
- quantity tends to fall substantially;
- price rises relatively little.
Important examination point
The direction of change comes from the shift. The magnitude of change depends partly on elasticity.
12. Simultaneous shifts
Real markets often experience more than one change at once.
When demand and supply both shift, one outcome may be certain while the other is ambiguous.
Demand increases and supply increases
- equilibrium quantity definitely rises;
- equilibrium price is uncertain.
Price rises if demand increases by more than supply. Price falls if supply increases by more than demand. Price remains unchanged if the shifts offset exactly.
Demand decreases and supply decreases
- equilibrium quantity definitely falls;
- equilibrium price is uncertain.
Demand increases and supply decreases
- equilibrium price definitely rises;
- equilibrium quantity is uncertain.
Demand decreases and supply increases
- equilibrium price definitely falls;
- equilibrium quantity is uncertain.
Summary table
| Demand change | Supply change | Price | Quantity |
|---|---|---|---|
| Increase | Increase | Ambiguous | Rises |
| Decrease | Decrease | Ambiguous | Falls |
| Increase | Decrease | Rises | Ambiguous |
| Decrease | Increase | Falls | Ambiguous |
Strong exam language
Do not simply write "cannot tell."
Write:
The final outcome depends on the relative magnitude of the shifts.
13. Joint demand: complements
Definition
Joint demand exists when two goods are consumed together, so an increase in demand for one tends to increase demand for the other.
Examples:
- cars and petrol;
- printers and ink;
- games consoles and games;
- smartphones and mobile-data plans.
Market relationship
Suppose the price of cars falls.
- quantity demanded for cars rises;
- more cars are used;
- demand for petrol shifts right;
- petrol equilibrium price and quantity tend to rise, ceteris paribus.
Link to XED
Complements normally have a negative cross elasticity of demand.
14. Alternative demand: substitutes
Definition
Alternative demand exists when goods can be used instead of one another, so a rise in the price of one tends to increase demand for the other.
Examples:
- tea and coffee;
- bus and rail travel;
- butter and margarine;
- competing smartphone brands.
Market relationship
Suppose the price of coffee rises.
- quantity demanded for coffee contracts;
- consumers switch towards tea;
- demand for tea shifts right;
- tea equilibrium price and quantity tend to rise.
Link to XED
Substitutes normally have a positive cross elasticity of demand.
15. Derived demand
Definition
Derived demand occurs when demand for a factor of production or intermediate good arises from demand for the final product it helps produce.
Examples:
- demand for construction workers derives from demand for buildings;
- demand for steel derives partly from demand for cars and machinery;
- demand for airline pilots derives from demand for air travel;
- demand for cocoa derives from demand for chocolate.
Analytical chain
- Demand for final product rises
- firms plan greater output
- demand for relevant factors or inputs rises
- input demand curve shifts right.
Important distinction
Derived demand is not the same as joint demand.
- joint demand concerns goods consumed together;
- derived demand concerns inputs required to produce output.
16. Joint supply
Definition
Joint supply occurs when the production of one good creates another good or by-product from the same production process.
Examples:
- beef and leather;
- wool and mutton;
- petrol and other petroleum products;
- wheat and straw.
Market relationship
Suppose demand for beef rises.
- beef price may rise;
- cattle production increases;
- leather supply also increases;
- leather supply curve shifts right;
- leather equilibrium price tends to fall and quantity tends to rise, ceteris paribus.
Important distinction
Joint supply is a supply-side relationship. It is not the same as complementary demand.
17. Linked-market comparison
| Relationship | Core connection | Example |
|---|---|---|
| Joint demand | Goods consumed together | Cars and petrol |
| Alternative demand | Goods used instead | Tea and coffee |
| Derived demand | Input demanded because final output is demanded | Labour and construction |
| Joint supply | Goods produced together | Beef and leather |
18. Price as a rationing mechanism
Meaning
When a good is scarce, price helps decide who receives it.
If demand exceeds supply:
- price rises;
- some consumers reduce demand or leave the market;
- scarce output is allocated to those willing and able to pay.
Critical evaluation
Price rationing reflects:
- willingness to pay;
- ability to pay.
It does not necessarily reflect:
- need;
- fairness;
- social importance.
19. Price as a signal
Meaning
Prices transmit information about:
- consumer preferences;
- relative scarcity;
- changing costs;
- market opportunities.
Example
- Demand for electric bicycles rises
- price rises
- firms receive a signal that consumers value more electric bicycles.
A falling price may signal:
- weak demand;
- excess supply;
- reduced scarcity;
- lower profitability.
20. Price as an incentive
Producer incentive
A higher price may increase potential profit and encourage firms to:
- expand output;
- enter the market;
- invest;
- move resources into production;
- innovate.
Consumer incentive
A higher price encourages consumers to:
- reduce quantity demanded;
- seek substitutes;
- conserve the product.
Integrated price-mechanism chain
- Preference changes
- demand changes
- price transmits the signal
- consumers and firms receive incentives
- quantities adjust
- resources are reallocated.
21. Price mechanism and resource allocation
Suppose demand for solar panels rises.
- Demand shifts right.
- A shortage appears at the original price.
- Price rises.
- Higher price signals stronger consumer preference.
- Potential profit incentivises firms to expand.
- Labour and capital move into solar-panel production.
- Output rises.
- Price rations the available panels among buyers.
- A new equilibrium is reached.
This example integrates all three functions of price.
22. Why equilibrium can change continuously
Markets are dynamic.
Equilibrium may change because of:
- income;
- tastes;
- technology;
- costs;
- expectations;
- taxes;
- weather;
- population;
- related markets;
- global events.
The market may be constantly moving towards a new equilibrium without remaining at one point for long.
23. Primary-product application
Agricultural markets often combine:
- volatile demand;
- inelastic short-run supply;
- weather-driven supply shifts.
Example:
- Poor harvest
- supply shifts left
- price rises strongly and quantity falls.
If demand is inelastic, farmer revenue may rise even though output falls. This links Topic 2.4 to elasticity.
24. Transport-market application
A fall in the price of rail travel may:
- increase quantity demanded for rail travel;
- reduce demand for substitute bus travel;
- reduce demand for petrol if some car journeys are replaced;
- raise derived demand for train drivers if services expand.
One initial market change can therefore create several linked-market effects.
25. Foreign-exchange application
Demand for a currency and supply of a currency can be analysed using the same market model.
- demand for exports may increase demand for the domestic currency;
- demand for imports may increase supply of the domestic currency;
- equilibrium determines the market exchange rate under a floating system.
Detailed exchange-rate analysis appears in Topic 6.4.
26. Common exam traps
Trap 1: Equilibrium means socially desirable
Wrong. Equilibrium only means quantity demanded equals quantity supplied.
Trap 2: A shortage is shown by a vertical gap
Wrong. Shortages and surpluses are measured horizontally between quantities at a given price.
Trap 3: A price below equilibrium creates a surplus
Wrong. It creates a shortage.
Trap 4: A price above equilibrium creates a shortage
Wrong. It creates a surplus.
Trap 5: An increase in demand means movement along demand
Wrong. It is a rightward shift of the demand curve.
Trap 6: Increased supply raises equilibrium price
Wrong, ceteris paribus: price falls and quantity rises.
Trap 7: Simultaneous shifts always give a definite price and quantity result
Wrong. One result may be ambiguous.
Trap 8: Joint demand means substitutes
Wrong. Joint demand refers to complements.
Trap 9: Derived demand means consumers want two goods together
Wrong. Derived demand arises from demand for final output.
Trap 10: Joint supply means two goods have similar supply curves
Wrong. It means they emerge from the same production process.
Trap 11: Price signalling and price incentivising are identical
They are linked but distinct:
- signalling communicates information;
- incentives motivate action.
Trap 12: Price rationing allocates by need
It allocates according to willingness and ability to pay.
27. Paper 1 technique
Common tasks include:
- identify equilibrium;
- calculate shortages and surpluses;
- identify new equilibrium after a shift;
- distinguish linked-market relationships;
- classify functions of price;
- identify certain and ambiguous outcomes from simultaneous shifts.
Shift-analysis method
- Identify the market.
- Identify whether demand or supply changes.
- Identify direction of shift.
- State the temporary disequilibrium at the original price.
- Explain price adjustment.
- State the new equilibrium price and quantity.
28. Paper 2 technique
Model four-mark answer: increase in demand
An increase in demand shifts the demand curve to the right. At the original price, quantity demanded exceeds quantity supplied, creating a shortage. This places upward pressure on price. As price rises, quantity supplied extends and quantity demanded contracts along the new demand curve until a new equilibrium is reached at a higher price and quantity.
Model six-mark answer: joint supply
Joint supply occurs when two goods are produced from the same production process. Beef and leather are jointly supplied because greater cattle production produces more of both. If demand for beef rises, cattle production may increase. This shifts the supply of leather to the right, causing the equilibrium price of leather to fall and the equilibrium quantity to rise, ceteris paribus.
Model eight-mark answer: simultaneous shifts
Question:
Explain the likely effect on the market for electric cars of an increase in consumer income and a fall in battery-production costs.
Model structure:
- if electric cars are normal goods, demand shifts right;
- lower battery costs shift supply right;
- equilibrium quantity definitely rises;
- equilibrium price is uncertain;
- price depends on relative magnitude of shifts;
- elasticity affects size of changes.
29. Active recall
- Define market equilibrium.
- Define disequilibrium.
- What creates a shortage?
- What creates a surplus?
- How does price adjust during a shortage?
- How does price adjust during a surplus?
- What happens to equilibrium after demand increases?
- What happens after demand decreases?
- What happens after supply increases?
- What happens after supply decreases?
- How does elasticity affect the magnitude of equilibrium changes?
- What happens if demand and supply both increase?
- What happens if demand rises and supply falls?
- Define joint demand.
- Define alternative demand.
- Define derived demand.
- Define joint supply.
- Give one example of each linked-market relationship.
- Explain price rationing.
- Explain price signalling.
- Explain price incentivising.
- Why can equilibrium be socially undesirable?
- Why might market adjustment take time?
- How is a shortage measured on a diagram?
- How can a change in one market affect several other markets?
30. One-minute revision
Equilibrium
Quantity demanded equals quantity supplied.
Below equilibrium price
Shortage → price rises.
Above equilibrium price
Surplus → price falls.
Single shifts
- demand right
- price up, quantity up
- demand left
- price down, quantity down
- supply right
- price down, quantity up
- supply left
- price up, quantity down.
Linked markets
- joint demand
- complements
- alternative demand
- substitutes
- derived demand
- input linked to final output
- joint supply
- products produced together.
Price functions
- rationing;
- signalling;
- incentivising.
Check you have it
Question 1
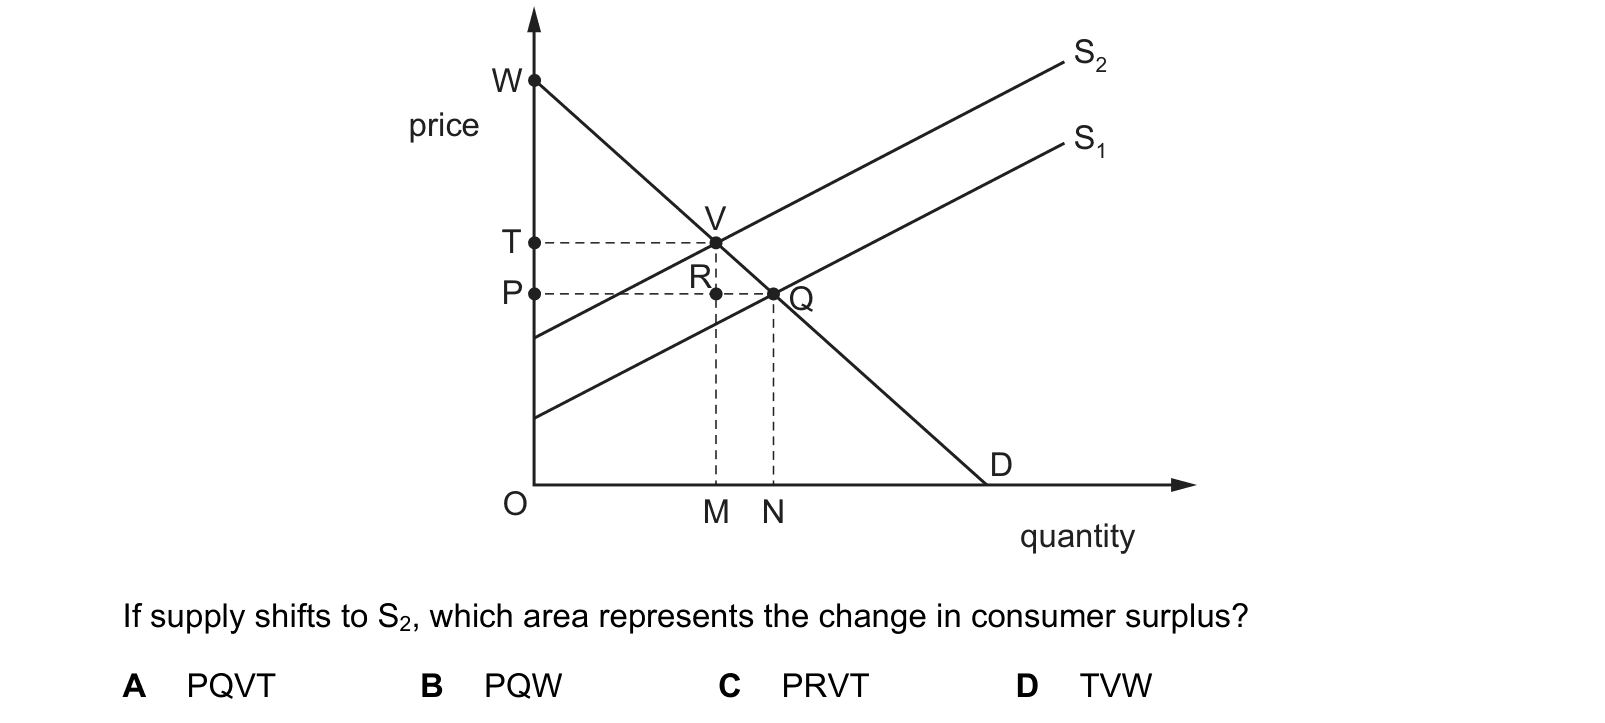
In the diagram, S1 is the original supply curve and D is the original demand curve. If supply shifts to S2, which area represents the change in consumer surplus?
Answer: A.
Explanation:
- Consumer surplus is the area between the price that consumers are willing to pay (D curve) and the actual price (P). When supply shifts from S1 to S2, the new equilibrium price will decrease from P to P2, leading to a lower price for consumers.
- The change in consumer surplus after the shift in supply can be calculated by comparing the original consumer surplus (triangle above P and under D) and the new consumer surplus after the shift (triangle above P2 and under D).
- In the given options, area PQVT represents the change in consumer surplus after the shift in supply from S1 to S2. This area captures the decrease in consumer surplus due to the decrease in price (from P to P2) resulting from the increase in supply.
- Choice B (PQW) does not represent the change in consumer surplus accurately after the shift in supply. It only captures a portion of the original consumer surplus and does not account for the full decrease in consumer surplus due to the shift.
- Choices C (PRVT) and D (TVW) are also incorrect as they do not accurately represent the change in consumer surplus after the shift in supply.
- The correct area to represent the change in consumer surplus must consider the overall decrease in consumer surplus resulting from the decrease in price caused by the increase in supply.
Best exam chain
- Shift
- disequilibrium at original price
- price pressure
- movement along the other curve
- new equilibrium.
What the syllabus asks for on this topicOfficial syllabus coverage · Product mastery map
Official syllabus coverage
Students must understand:
- 2.4.1 the definition of market equilibrium and disequilibrium;
- 2.4.2 the effects of shifts in demand and supply curves on equilibrium price and quantity;
- 2.4.3 relationships between different markets:
- joint demand (complements);
- alternative demand (substitutes);
- derived demand;
- joint supply;
- 2.4.4 the functions of price in resource allocation:
- rationing;
- signalling or transmission of preferences;
- incentivising.
Product mastery map
The official syllabus is divided into seven measurable portal skills:
- define equilibrium and disequilibrium;
- analyse shortages, surpluses and price adjustment;
- analyse demand shifts and new equilibrium;
- analyse supply shifts and new equilibrium;
- analyse simultaneous shifts and ambiguous outcomes;
- explain relationships between linked markets;
- explain the rationing, signalling and incentive functions of price.
Related CIE 9708 topics
Not the topic you were looking for? Describe what you are stuck on in your own words and we will take you to the notes that answer it.