32 past-paper questions on this unit. Three of them are below. Answer on the page: each one is marked the moment you pick, the correct option is shown whether or not you found it, and the full explanation opens either way.
CIE 9708Paper 1 MCQsFree account
Production Possibility Curves: three questions to try now
Real past-paper questions, the answer key from the mark scheme, and the explanation that goes with it. No account needed to answer them.
Question 1
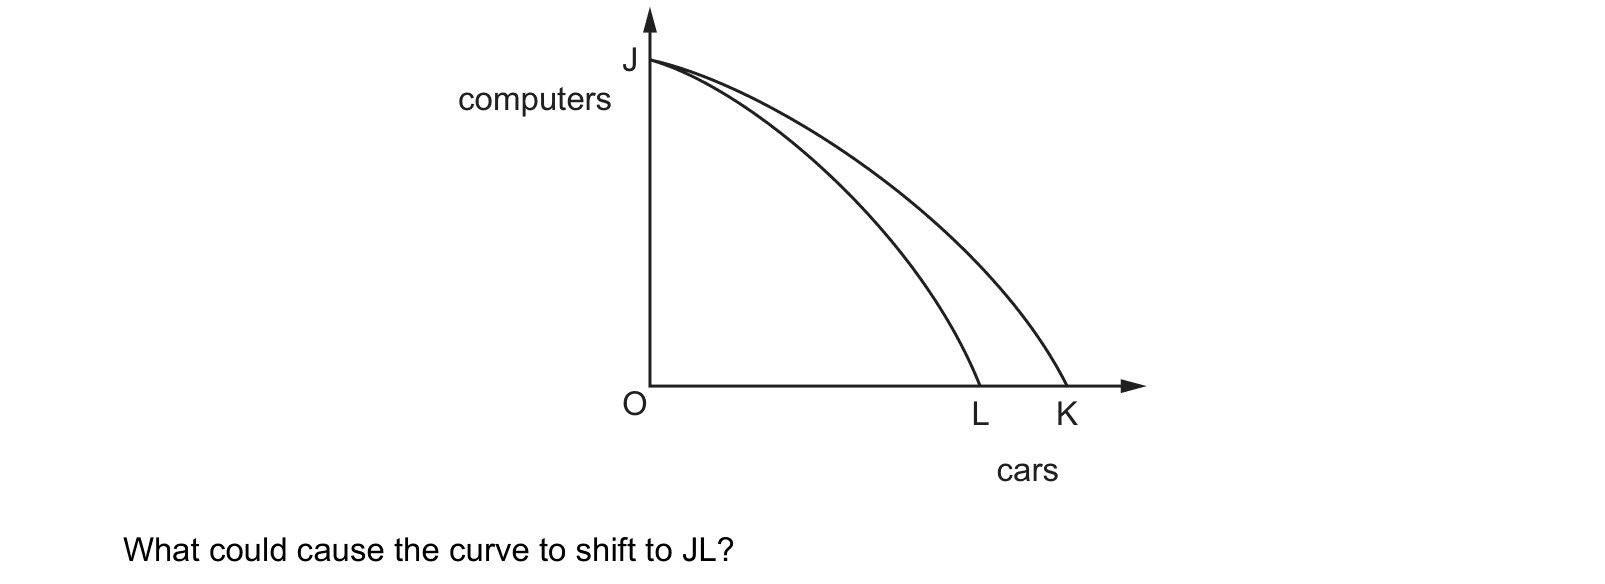
In the diagram JK is the initial production possibility curve for an economy producing computers and cars. J computers O L K cars What could cause the curve to shift to JL?
Answer: A.
The new curve JL shares the same vertical intercept at J but stops short of K on the horizontal axis, so the economy can still make just as many computers as before while its maximum output of cars has fallen. Only something that damages productive capacity in cars alone can do that, and a fall in output per worker in the car industry is precisely a fall in the productivity of the resources used to build cars. A rise in the potential workforce would add to the resources available to both industries, pulling the whole frontier outwards rather than pivoting one end of it inwards. A change in the price of cars cannot move the curve at all, because the axes measure quantities of goods and the frontier records physical capacity rather than money values; a price change shifts production to a different point on the same curve. Less competition in the car industry may leave firms producing wastefully, but that shows up as a point inside the frontier rather than as a frontier that has moved.
Question 2
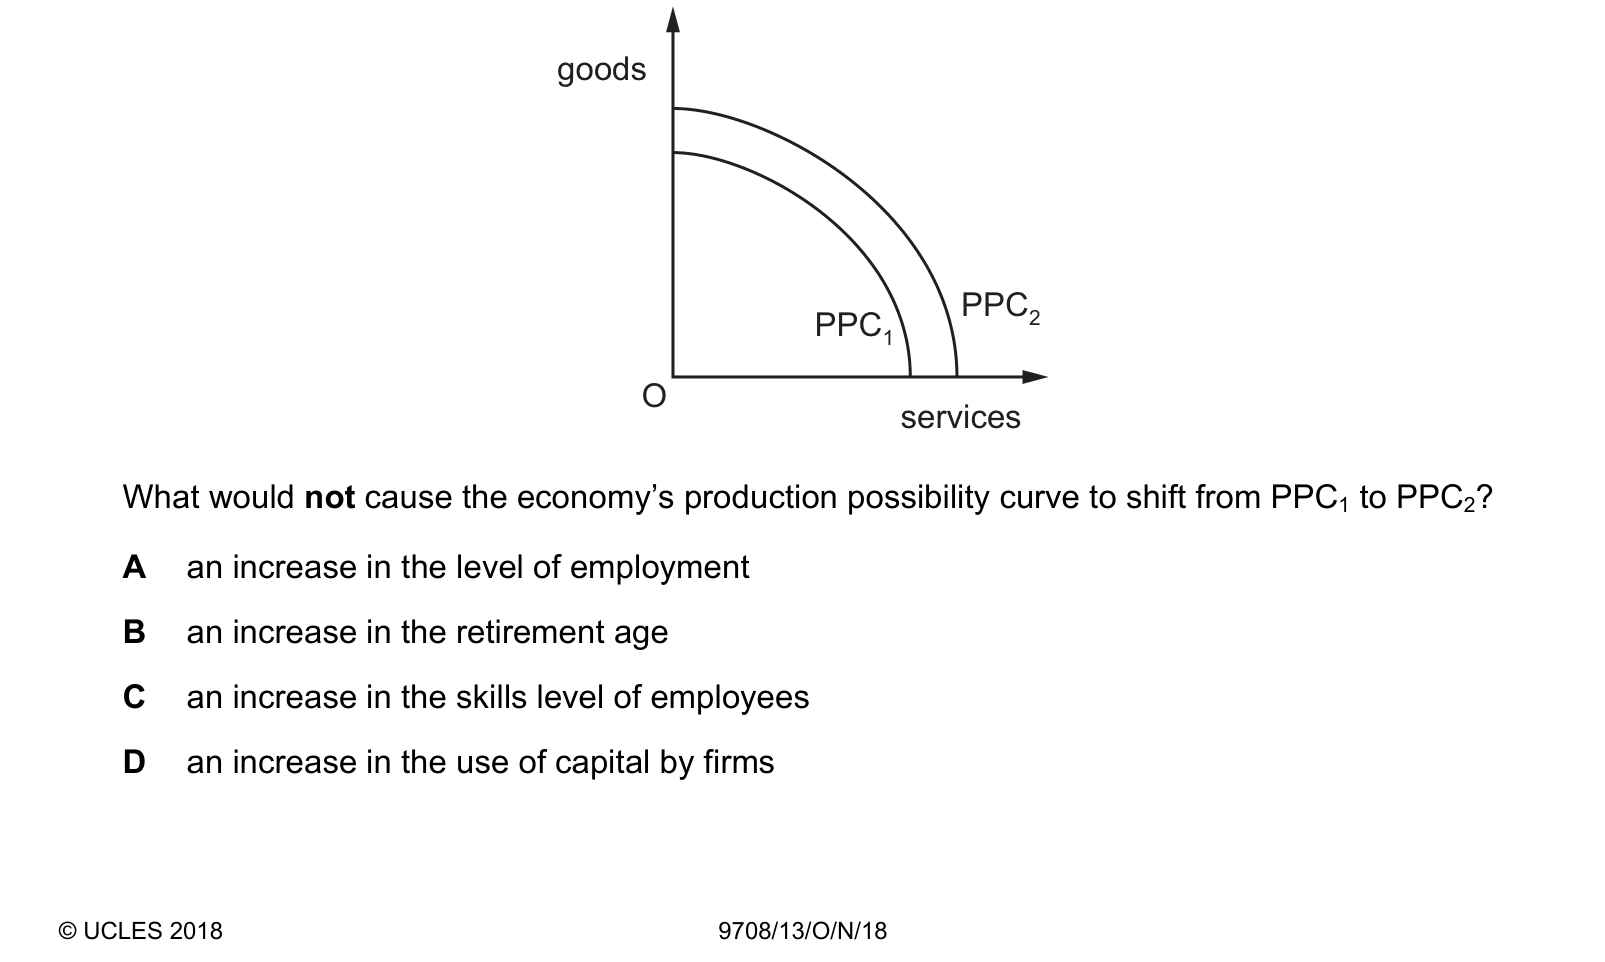
The diagram shows two production possibility curves for goods and services in an economy. What would not cause the economy’s production possibility curve to shift from PPC1 to PPC2?
Answer: A.
The curve moves outwards, so the economy can make more of everything than before, the question is which of these does NOT add to that capacity. Employing more of the workers the economy already has does not: it moves production from a point inside the curve onto the curve, closing the gap between what the economy could produce and what it actually produces, while the boundary itself stays exactly where it was. The other three each push the boundary out. A higher retirement age keeps people in the labour force for longer, better skills raise what each worker can produce in an hour, and more capital gives every worker more to work with.
Question 3
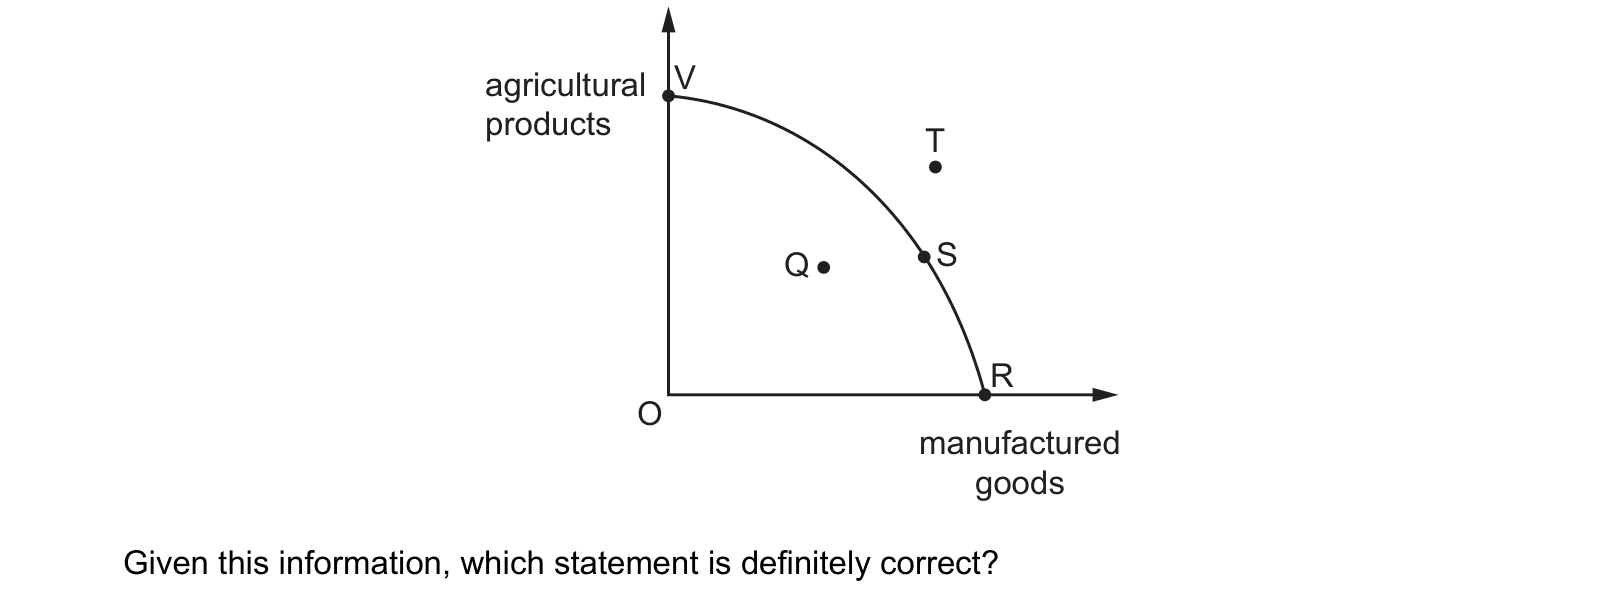
A country can produce manufactured goods and agricultural products as shown in the diagram. agricultural V products T S Q R O manufactured goods Given this information, which statement is definitely correct?
Answer: A.
Q lies inside the frontier, which means the country could produce more manufactured goods without sacrificing any agricultural products, and the only reason that is possible is that some factors are unemployed or being used inefficiently. That reading follows from the diagram alone, which is what the word definitely demands. T sits beyond the curve and so is unattainable with the current stock of resources and technology, so telling the country to produce there asks for the impossible. R and S both lie on the frontier and are therefore both productively efficient, and choosing between them depends on how society values manufactured goods against agricultural ones, a judgement the diagram cannot supply. The statement about equal monetary costs at V and R misreads what the axes measure, since a production possibility curve records opportunity cost as output forgone and carries no money values at all.
These questions are drawn from past CIE 9708 papers and filtered to production possibility curves. You answer, you find out immediately whether you were right, and you get the reasoning for the correct option and for each distractor. Wrong answers go to a mistakes locker so you can come back to exactly those.
Practice is free. You need an account only so your progress and your mistakes are still there next time.
These are the errors that cost marks on production possibility curves, taken from our own topic notes. Read them before you practise and you will recognise the traps in the questions.
Every point on the PPC is allocatively efficient. Every point is productively efficient, not necessarily socially preferred.
A point inside is unattainable. It is attainable but inefficient.
A point outside is impossible forever. It is unattainable with current resources and technology but may become attainable after growth.
Movement from inside to the curve is an outward shift. It is improved utilisation of existing capacity.
Movement along the PPC is economic growth. It is reallocation between outputs with capacity unchanged.
Outward shift always means actual output immediately rises. Capacity rises, but the economy may not use it fully.
A straight PPC shows increasing opportunity cost. A straight PPC shows constant opportunity cost.
A bowed-out PPC shows constant opportunity cost. It shows increasing marginal opportunity cost.