Firms' Costs, Revenue and Objectives: five questions to try now
Real past-paper questions, the answer key from the mark scheme, and the explanation that goes with it. No account needed to answer them.
Question 1
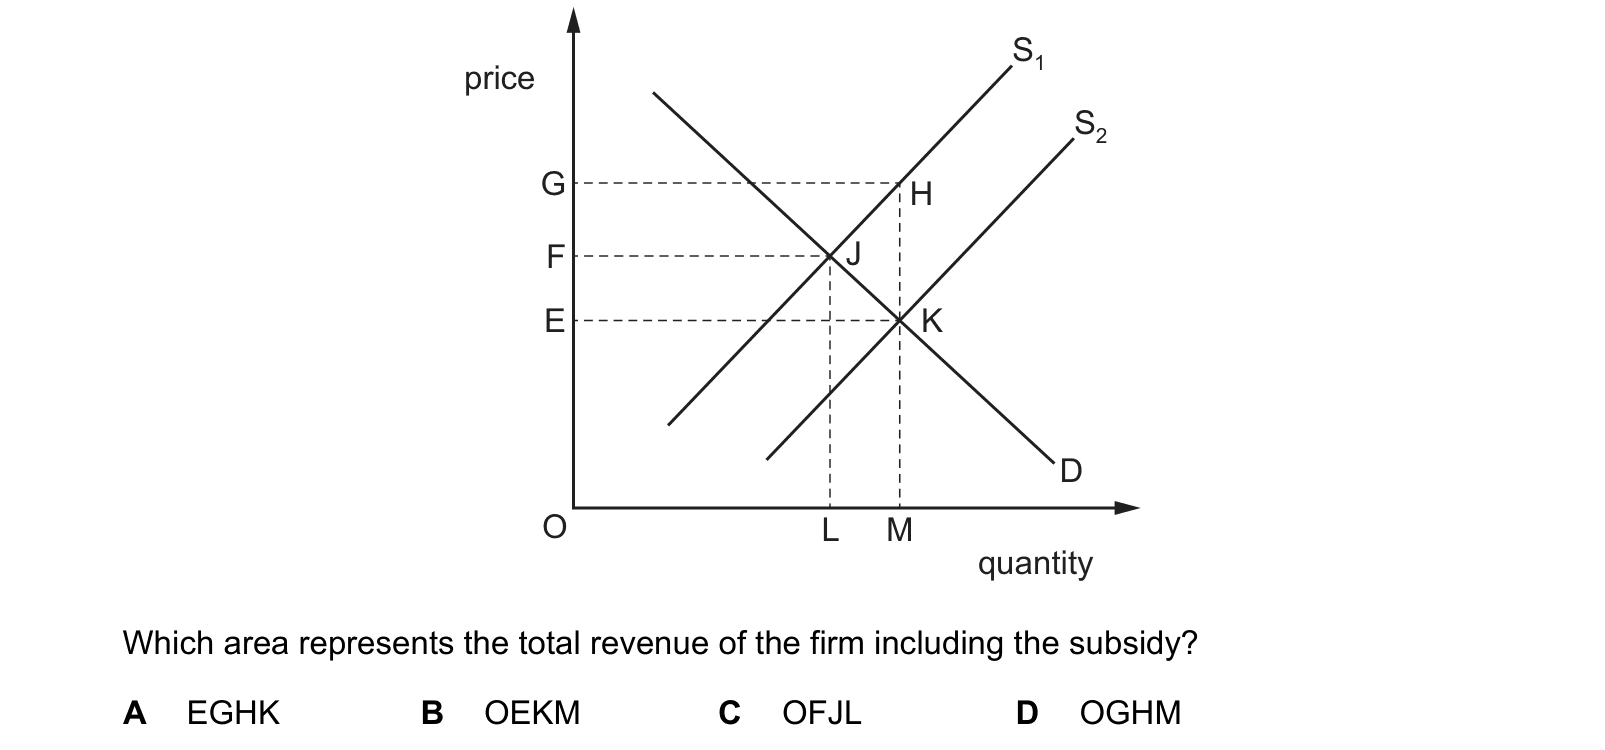
The diagram shows the imposition of a subsidy on a product supplied by a firm.
Which area represents the total revenue of the firm including the subsidy?
Answer: D.
The subsidy shifts supply from S1 to S2, so the market moves from J to K. Consumers now pay the price OE and buy the quantity OM. The firm, however, receives more than that: at the output OM the original supply curve S1 stands at OG, and the vertical gap between OG and OE is the subsidy paid on each unit. Total revenue including the subsidy is therefore the price the firm actually ends up with, OG, multiplied by the quantity sold, OM, which is the rectangle OGHM.
Why the other options are wrong:
- A, EGHK, is the subsidy itself: the payment per unit, EG, multiplied by the quantity OM. It is part of the firm's revenue but not the whole of it.
- B, OEKM, is what consumers pay, so it is revenue excluding the subsidy. Adding the subsidy area EGHK to it gives the correct answer.
- C, OFJL, is the firm's total revenue at the original equilibrium J, before the subsidy existed at all.
Question 2
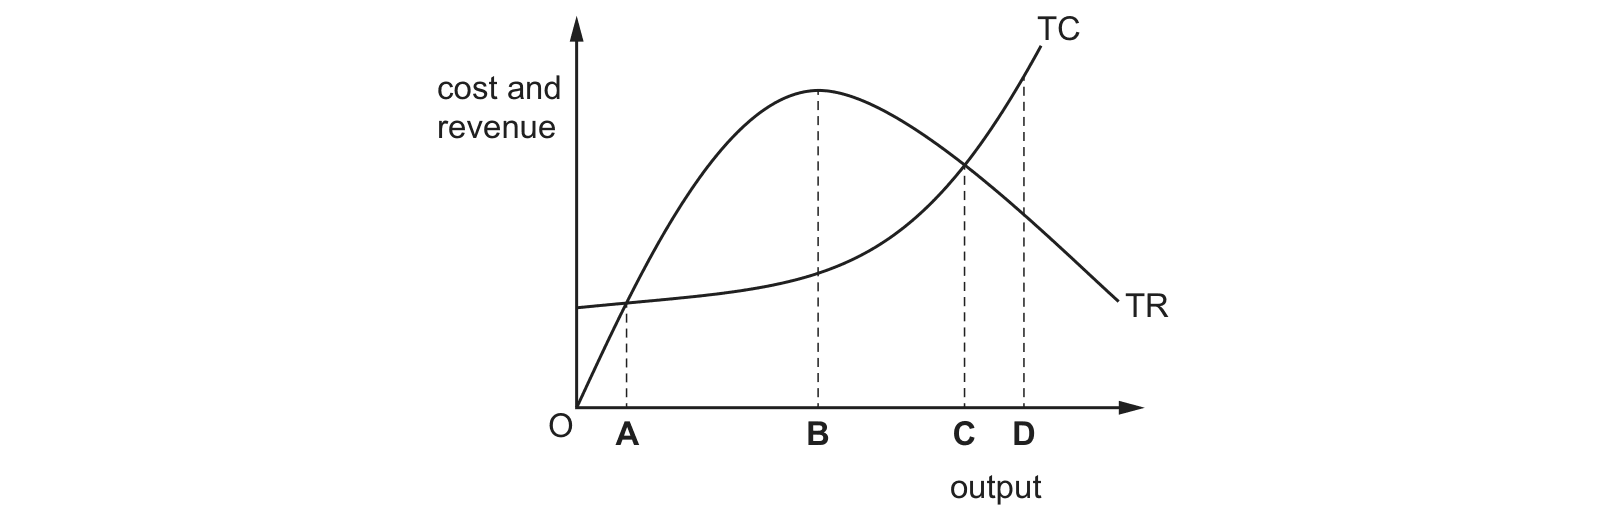
The diagram shows the total revenue (TR) and total cost (TC) of a firm in a market. At which level of output will the firm maximise profits?
Answer: B.
Question 3
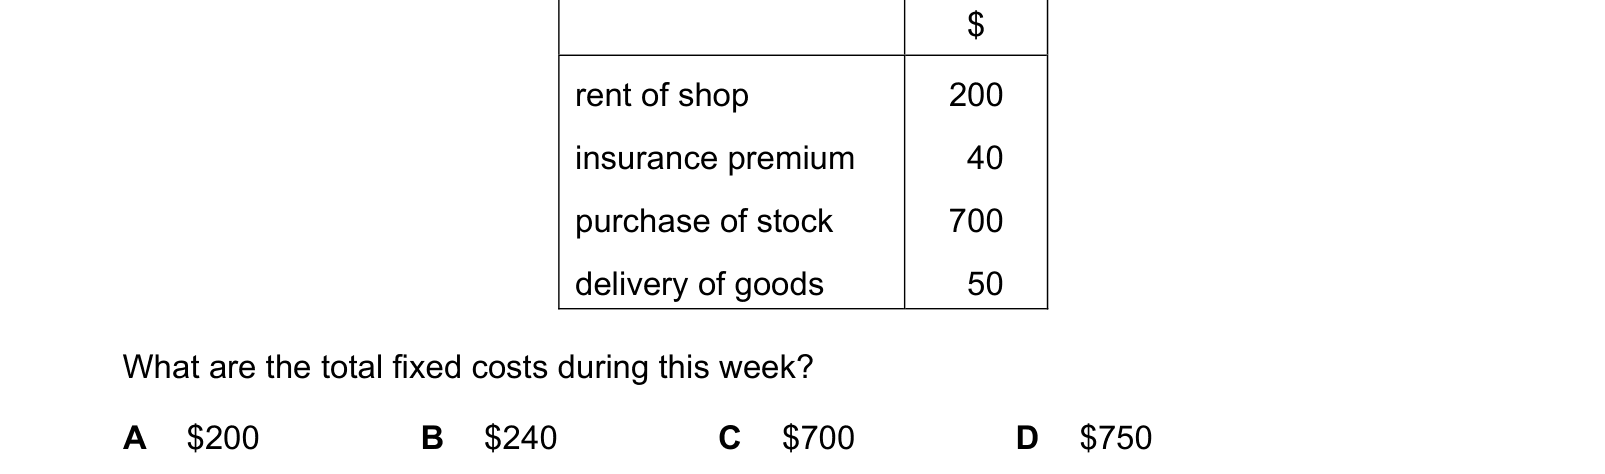
The table shows some of the costs of running a retail shop in one week.
$
rent of shop 200 insurance premium 40 purchase of stock 700 delivery of goods 50 What are the total fixed costs during this week?
Answer: B.
Question 4
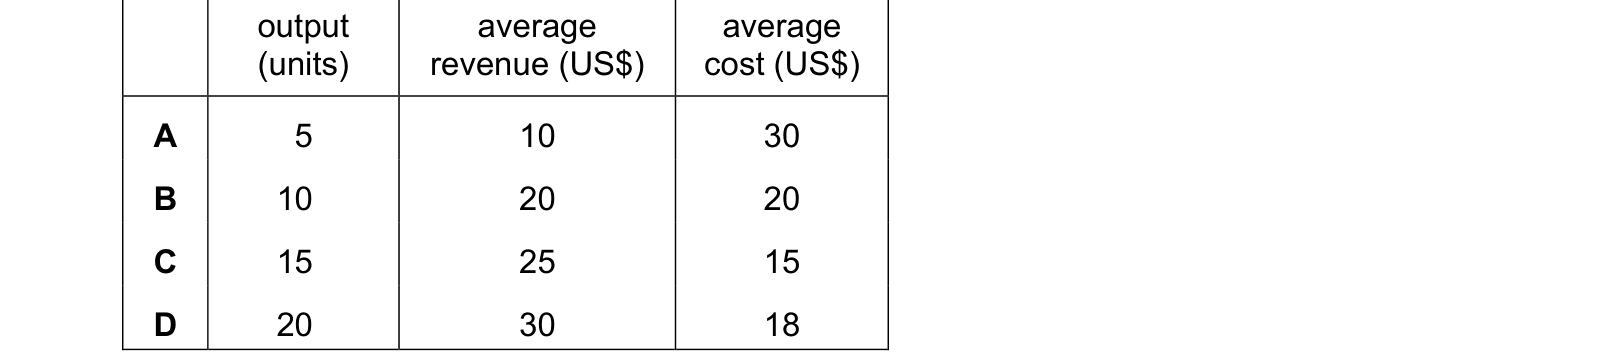
The table shows a firm’s average revenue and average cost at different levels of output. When all output is sold, which level of output gives maximum profit?
Answer: D.
Question 5
A firm imports 20 high quality bicycles into the US at a cost of $3000 each. It sells them all, making a profit of $1000 per bicycle. What is the firm’s average revenue?
Answer: D.
Average revenue is revenue per unit sold, which for a firm charging a single price is the price. So the task is to find the selling price.
Cost per bicycle: $3000
Profit per bicycle: $1000
Selling price = cost + profit = $3000 + $1000 = $4000
Average revenue therefore equals $4000. (As a check, total revenue is 20 × $4000 = $80,000, and $80,000 ÷ 20 = $4000.)
Why the other options are wrong:
- C, $3000, is the cost per bicycle, not the price received.
- A, $1000, is the profit per bicycle, the margin, not the revenue.
- B, $2000, does not follow from the figures by any consistent route.
What this practice covers
These questions are drawn from past Cambridge IGCSE papers and filtered to firms' costs, revenue and objectives. You answer, you find out immediately whether you were right, and you get the reasoning for the correct option and for each distractor. Wrong answers go to a mistakes locker so you can come back to exactly those.
Practice is free. You need an account only so your progress and your mistakes are still there next time.
What examiners see students get wrong here
These are the errors that cost marks on firms' costs, revenue and objectives, taken from our own topic notes. Read them before you practise and you will recognise the traps in the questions.
- Classifying wages as always variable. Permanent salaried staff are a fixed cost.
- Confusing total revenue with profit. Revenue is money in; profit is what is left.
- Forgetting that average revenue equals price.
- Dividing by the wrong figure when calculating average cost.
- Assuming every firm maximises profit.
- Confusing average cost with variable cost per unit.
Revise it first
If any of the above is unfamiliar, work through the notes before practising: Firms' Costs, Revenue and Objectives revision notes.