Price, Income and Cross Elasticities of Demand Exam Questions
73 past-paper questions on this unit. Five of them are below. Answer on the page: each one is marked the moment you pick, the correct option is shown whether or not you found it, and the full explanation opens either way.
CIE 9708Paper 1 MCQsFree account
Price, Income and Cross Elasticities of Demand: five questions to try now
Real past-paper questions, the answer key from the mark scheme, and the explanation that goes with it. No account needed to answer them.
Question 1
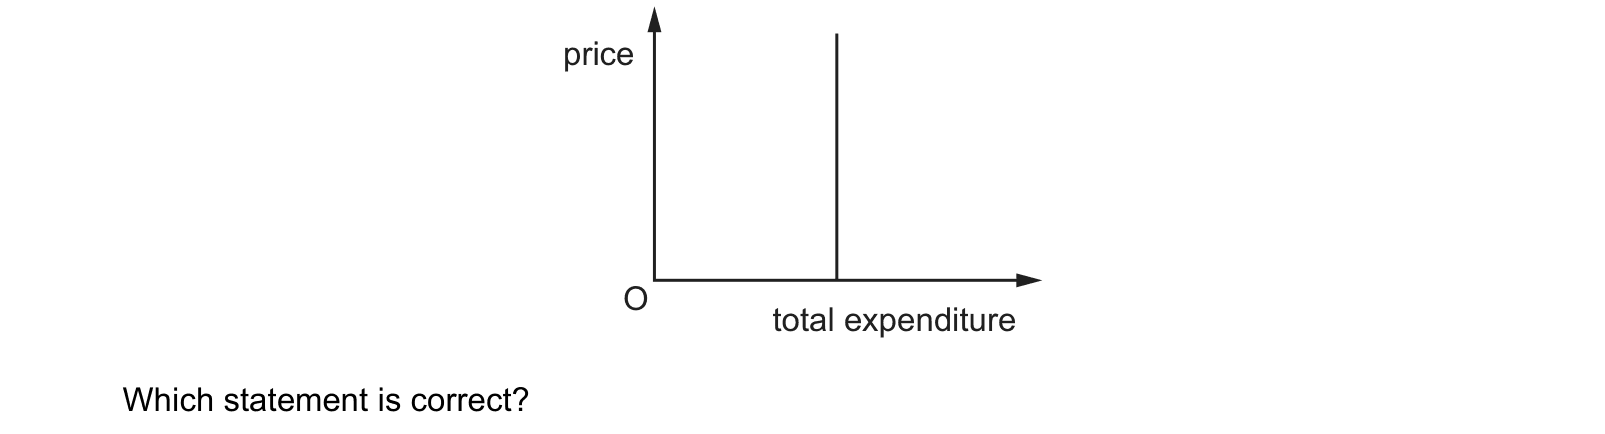
The diagram shows the relationship between the price and the total expenditure on a good. price O total expenditure Which statement is correct?
Answer: C.
The line is vertical, and with price on one axis and total expenditure on the other that means spending on the good is the same whatever the price. Total expenditure is price multiplied by quantity, so it can only stay constant if every proportionate rise in price is matched by an equal proportionate fall in quantity demanded, and that is the definition of unit price elasticity of demand. Perfectly inelastic demand, with an elasticity of zero, would leave quantity fixed, so expenditure would rise in step with price and the line would lean rather than stand upright. The two statements about income elasticity cannot be tested from this diagram at all, because neither axis measures income and nothing here tells you what happens when consumers get richer. The general rule is worth remembering in this form: constant spending as price moves means unity, spending rising with price means inelastic, spending falling with price means elastic.
Question 2
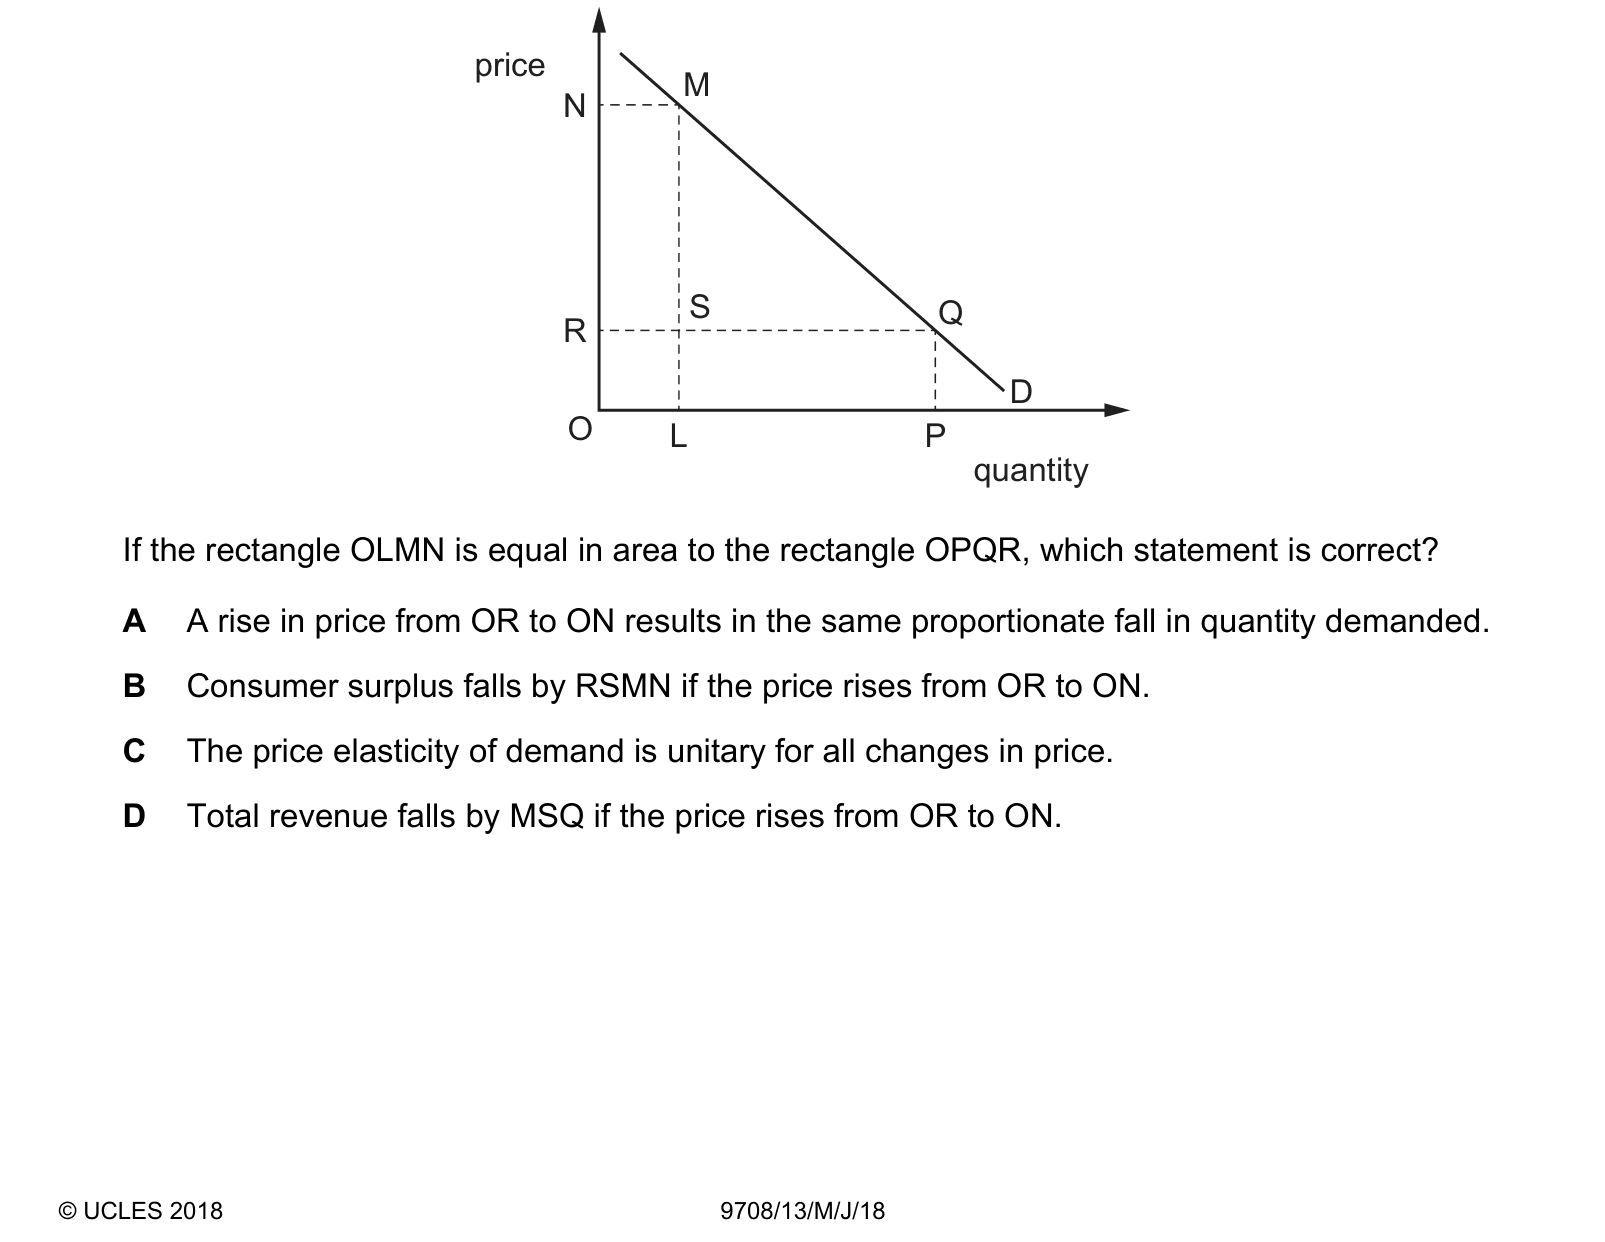
The diagram shows the demand curve for a product. If the rectangle OLMN is equal in area to the rectangle OPQR, which statement is correct?
Answer: A.
Each rectangle is a price multiplied by the quantity bought at that price, so it measures total revenue, and being told the two are equal in area is being told that revenue is unchanged between the two prices. Revenue only stays put when the proportionate fall in quantity demanded exactly matches the proportionate rise in price, which is what the first statement asserts and which is unit elasticity over that range. Saying total revenue falls by the triangle MSQ contradicts the condition the question has just supplied, since equal rectangles mean revenue does not fall at all. Claiming unitary elasticity for all price changes reads far too much into two equal areas, because a straight-line demand curve has an elasticity that falls continuously from very high near the price axis to very low near the quantity axis, and only a rectangular hyperbola gives unity everywhere. Consumer surplus does fall when the price rises, but the loss is the rectangle RSMN together with the triangle MSQ, since surplus is lost both on the units still bought and on the units no longer bought at all.
Question 3
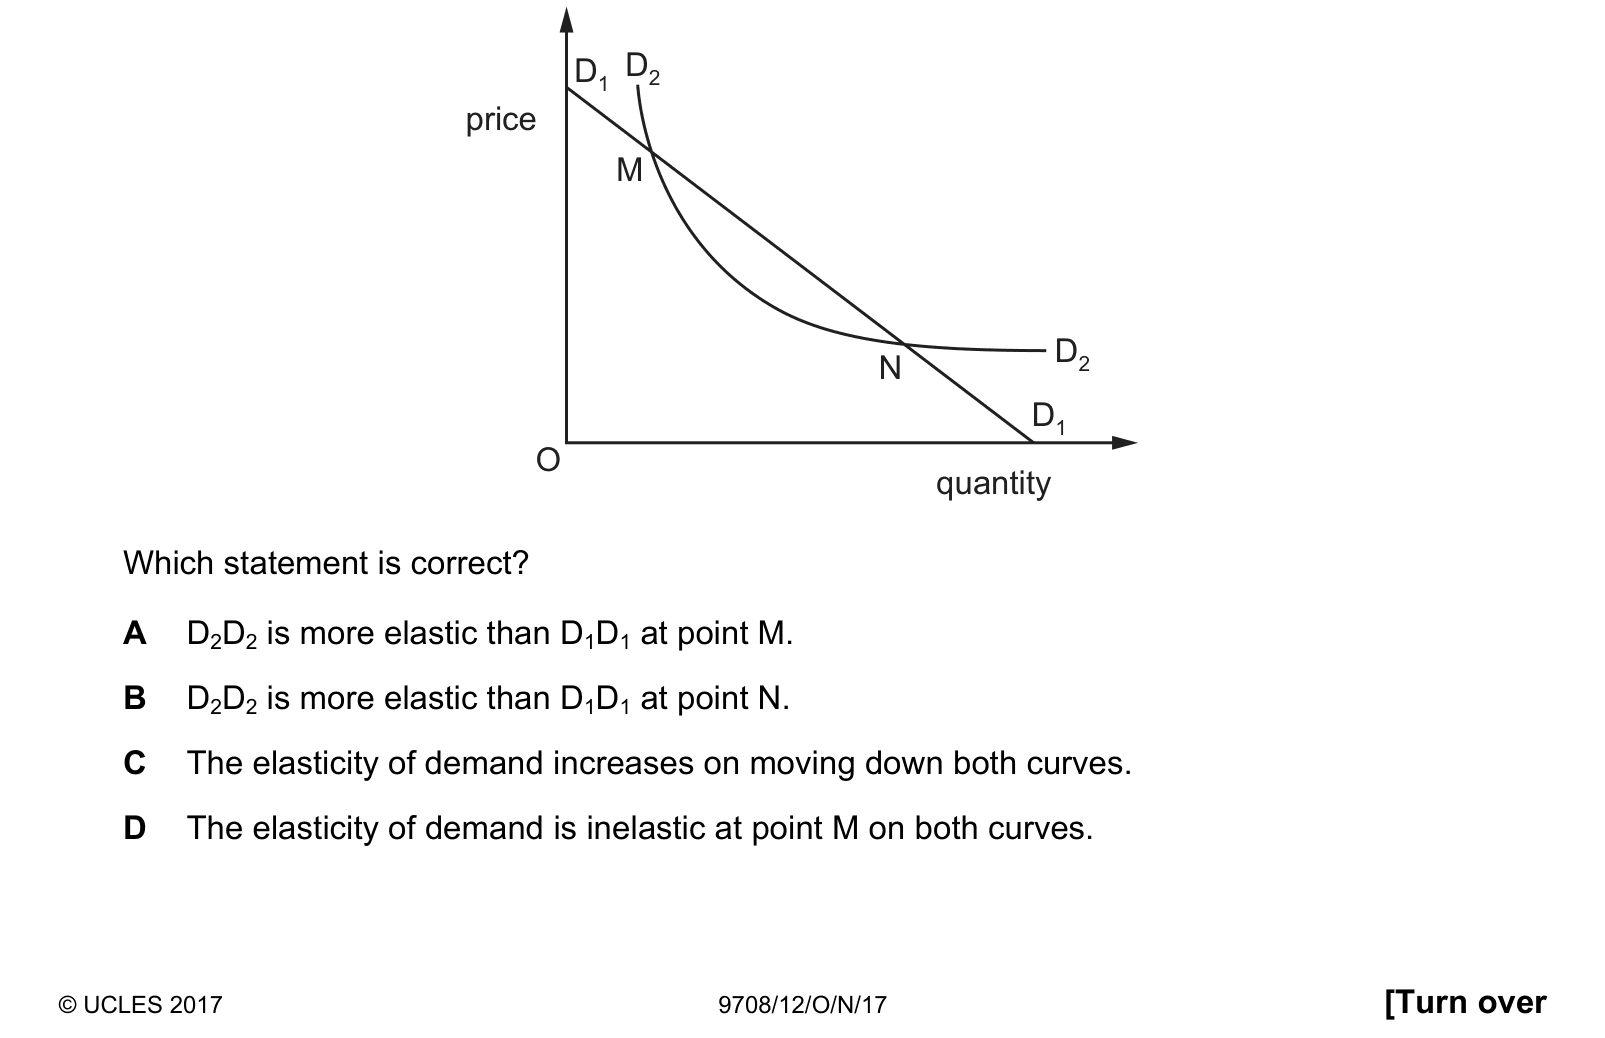
In the diagram D1D1 is a straight line demand curve and D2D2 is a rectangular hyperbola curve. Which statement is correct?
Answer: B.
D2D2 is a rectangular hyperbola, so its price elasticity of demand is 1 at every point. D1D1 is a straight line, so its elasticity falls steadily from infinity where it meets the price axis to zero where it meets the quantity axis.
M is the upper crossing and N the lower. At M the straight line is still in its elastic range, above 1, so D1D1 is the more elastic there and A is wrong. By N the straight line has passed into its inelastic range, below 1, while D2D2 is still exactly 1, so D2D2 is the more elastic at N: B.
C is wrong because elasticity FALLS moving down a straight-line demand curve, and does not change at all on the hyperbola. D is wrong because at M the hyperbola is unit elastic and the straight line is elastic, so neither is inelastic.
The trap is treating elasticity as the slope. The straight line has one constant slope and a different elasticity at every point on it.
Question 4
Good X has an income elasticity of demand (YED) value of −0.8. Its cross elasticity of demand (XED) with respect to good Y is also −0.8.
What are the characteristics of good X?
Answer: C.
The correct answer is C: an inferior good that is a complement to good Y.
Both coefficients are negative, and each negative sign classifies a different relationship.
Income elasticity of demand is –0.8. Demand falls as income rises, which defines an inferior good: consumers trade up to preferred alternatives as they become better off.
Cross elasticity of demand with respect to Y is –0.8. A rise in Y's price reduces demand for X, which means the two are consumed together; they are complements. If they were substitutes, a rise in Y's price would send consumers towards X and the coefficient would be positive.
Why the other options are wrong:
A and B call X a normal good, which requires positive income elasticity.
B and D call X a substitute for Y, which requires positive cross elasticity.
The question is deliberately built so that both figures are the same number, which invites the assumption that they must mean the same kind of thing. They do not: the sign of income elasticity separates inferior from normal, while the sign of cross elasticity separates complements from substitutes. Read each coefficient against its own classification.
Question 5
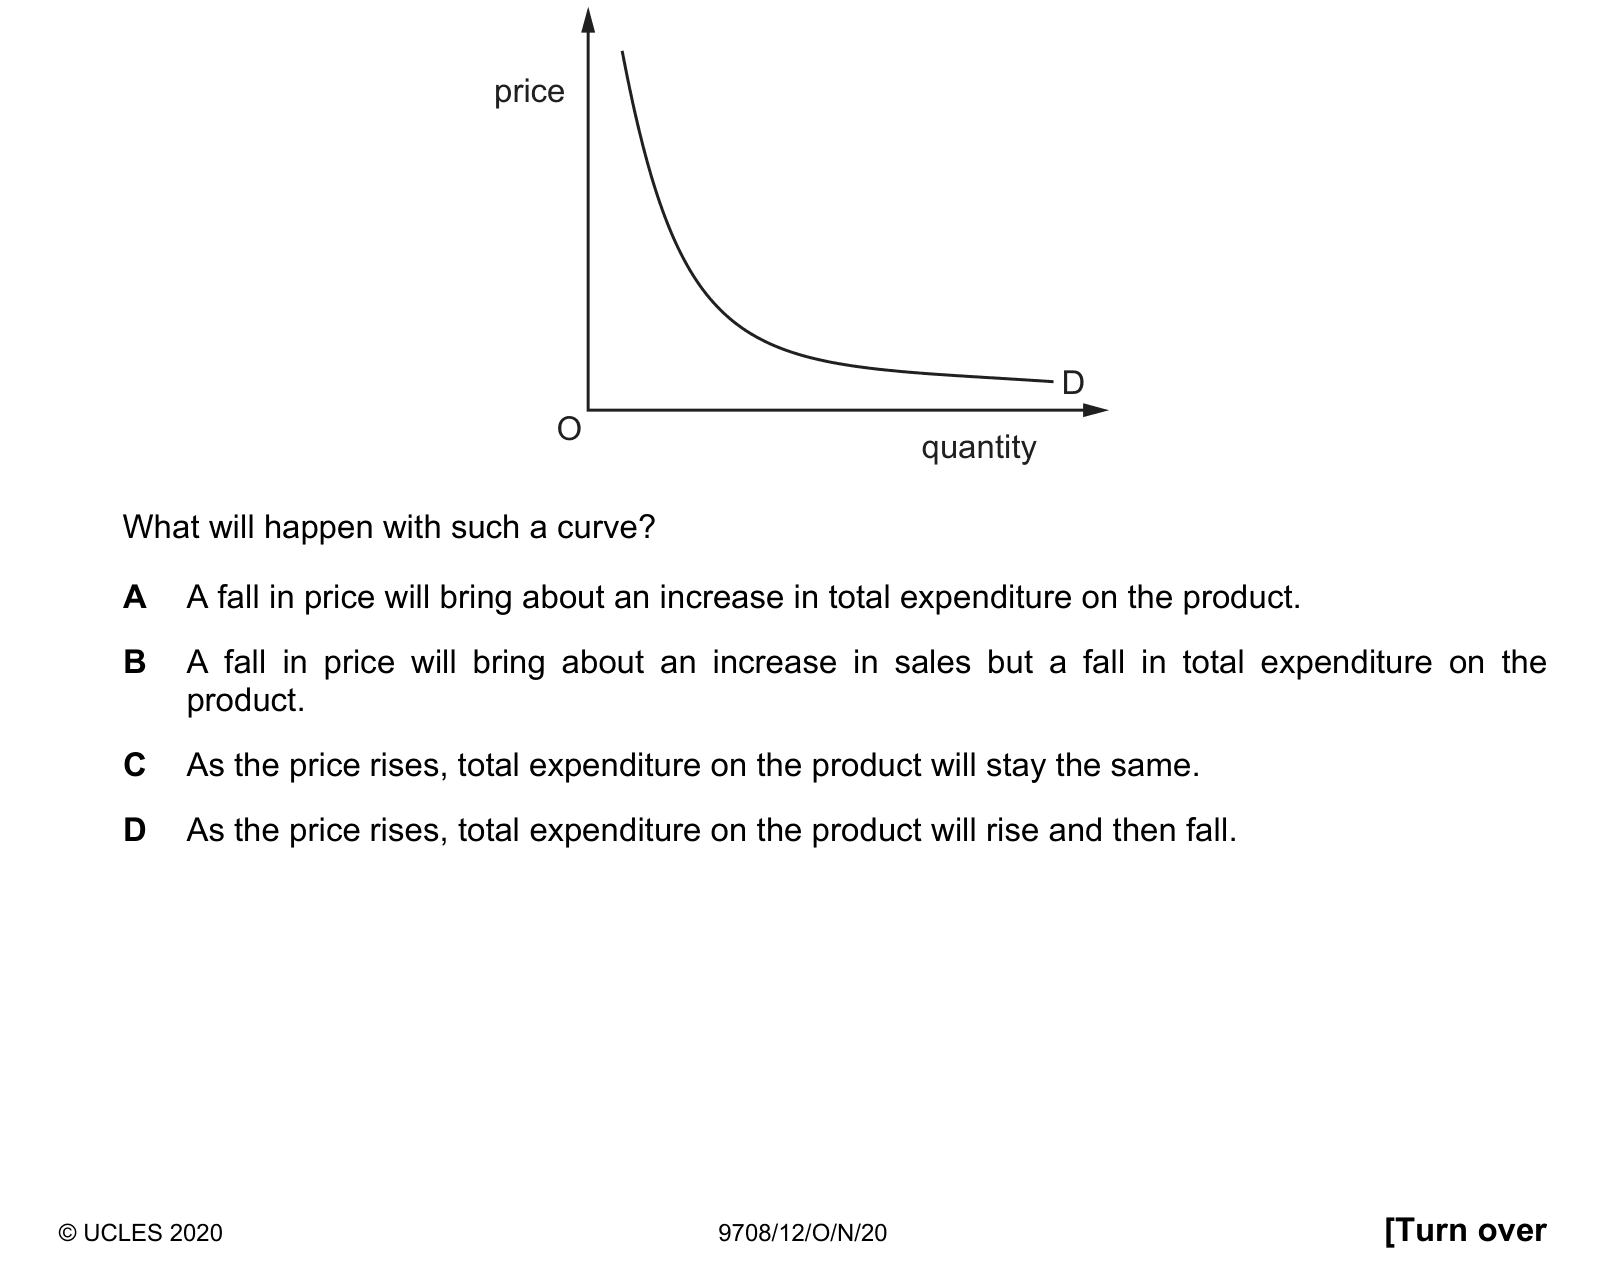
The diagram shows the demand curve for a product with unitary price elasticity. What will happen with such a curve?
Answer: C.
The curve drawn is a rectangular hyperbola, the shape unit elasticity takes, and its defining property is that price multiplied by quantity gives the same figure everywhere along it. So total expenditure on the product is constant: raise the price and the proportionate fall in quantity exactly cancels it, which is the statement the question is after. A fall in price bringing an increase in total expenditure would need the quantity gain to outweigh the price cut, and that happens only when demand is elastic, with an elasticity above one. A fall in price bringing more sales but less total expenditure is the inelastic case, where the quantity response is too weak to compensate for the lower price. Expenditure rising and then falling as price rises describes a straight-line demand curve, along which elasticity changes continuously from high to low, which is precisely what this curve avoids.
These questions are drawn from past CIE 9708 papers and filtered to price, income and cross elasticities of demand. You answer, you find out immediately whether you were right, and you get the reasoning for the correct option and for each distractor. Wrong answers go to a mistakes locker so you can come back to exactly those.
Practice is free. You need an account only so your progress and your mistakes are still there next time.
These are the errors that cost marks on price, income and cross elasticities of demand, taken from our own topic notes. Read them before you practise and you will recognise the traps in the questions.
Using absolute changes instead of percentage changes.
Forgetting that PED is normally negative.
Classifying PED using the negative sign rather than its absolute magnitude.
Forgetting the sign of YED identifies normal versus inferior goods.