Aggregate Demand and Aggregate Supply Analysis Exam Questions
67 past-paper questions on this unit. Five of them are below. Answer on the page: each one is marked the moment you pick, the correct option is shown whether or not you found it, and the full explanation opens either way.
CIE 9708Paper 1 MCQsFree account
Aggregate Demand and Aggregate Supply Analysis: five questions to try now
Real past-paper questions, the answer key from the mark scheme, and the explanation that goes with it. No account needed to answer them.
Question 1
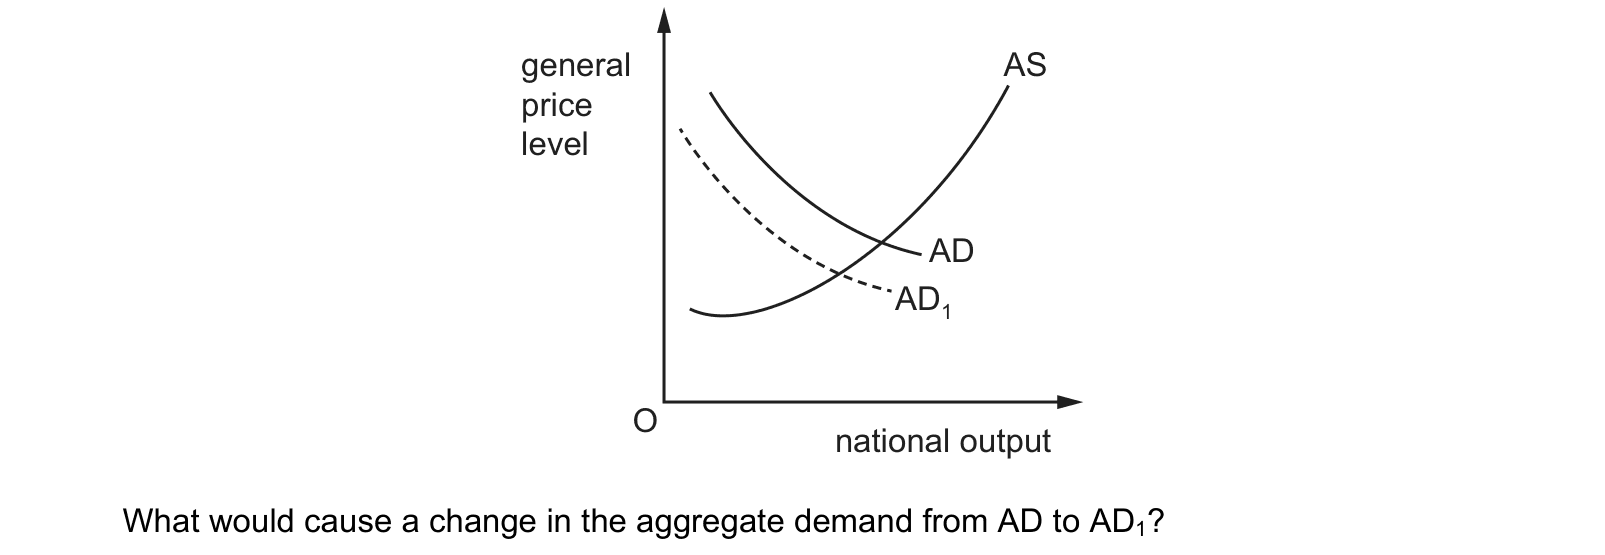
The diagram shows aggregate demand and aggregate supply curves for an economy. general price level O national output AS AD AD1 What would cause a change in the aggregate demand from AD to AD1?
Answer: C.
Only one of these four options reduces aggregate demand, and that settles it without needing to measure anything. Campaigns that persuade households to save more are campaigns to persuade them to spend less, and consumption is the largest component of AD, so AD shifts to the left. Each of the other three pushes AD the other way: a smaller budget surplus means the government is taking less out of the economy than it puts in, buying domestic goods instead of imports raises demand for home output, and investment in knowledge-based enterprises is investment, which is a component of AD in its own right. If the shift shown were to the RIGHT, three of the four options would be correct at once, which no multiple-choice question can allow, so the curve must be moving left, and C is the only answer that fits.
Question 2
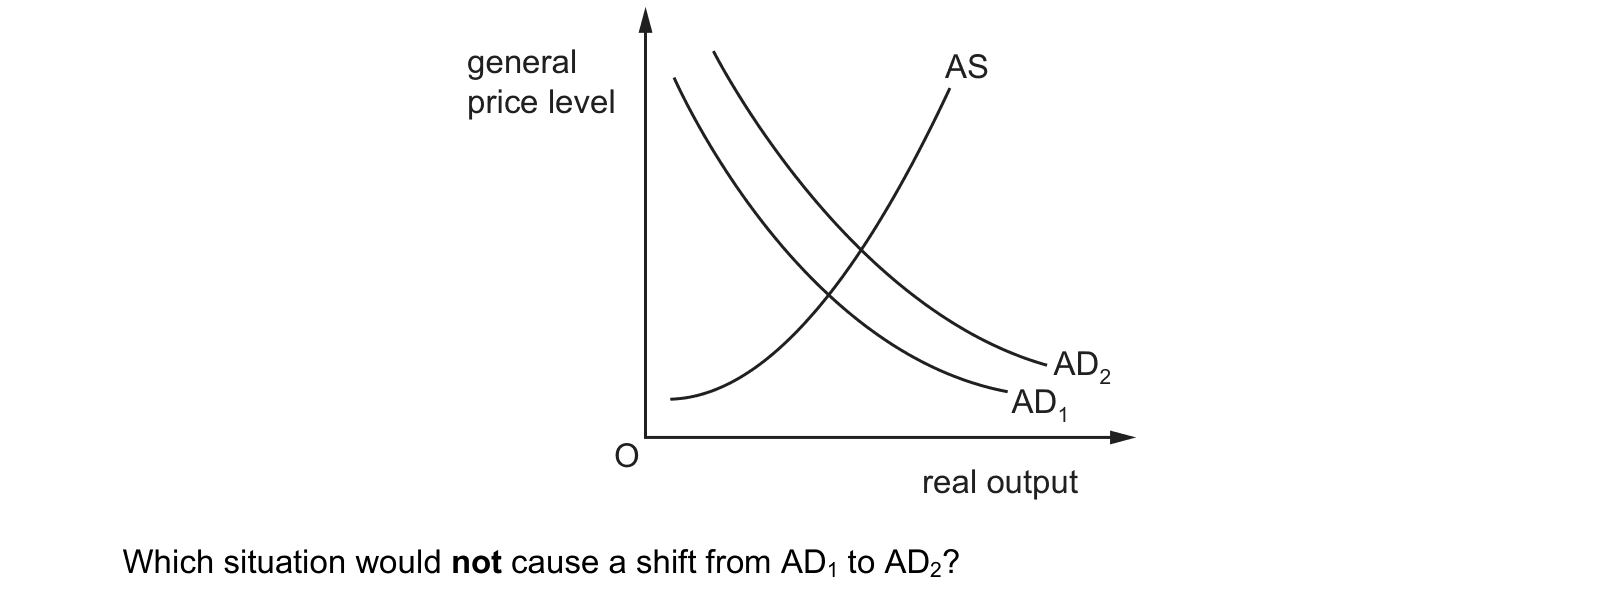
The diagram shows the aggregate demand (AD) and aggregate supply (AS) curves for an economy. general price level real output O AS AD2 AD1 Which situation would not cause a shift from AD1 to AD2?
Answer: A.
The question asks which situation would NOT shift the curve, so look for the one that cannot move AD at all. A change in the general price level never shifts the AD curve, it moves you ALONG it to a different point, because the curve already shows what is demanded at each price level. That makes A the answer, and it is doubly disqualified: the reduction in government spending it mentions would push AD in the opposite direction anyway, since government spending is a component of aggregate demand. The other three all genuinely shift the curve outwards. Easier credit lets households borrow and spend more, raising consumption. Higher earnings from high-tech exports raise the export component. More investment in computer systems raises investment. Each changes spending at every price level, which is what a shift means.
Question 3
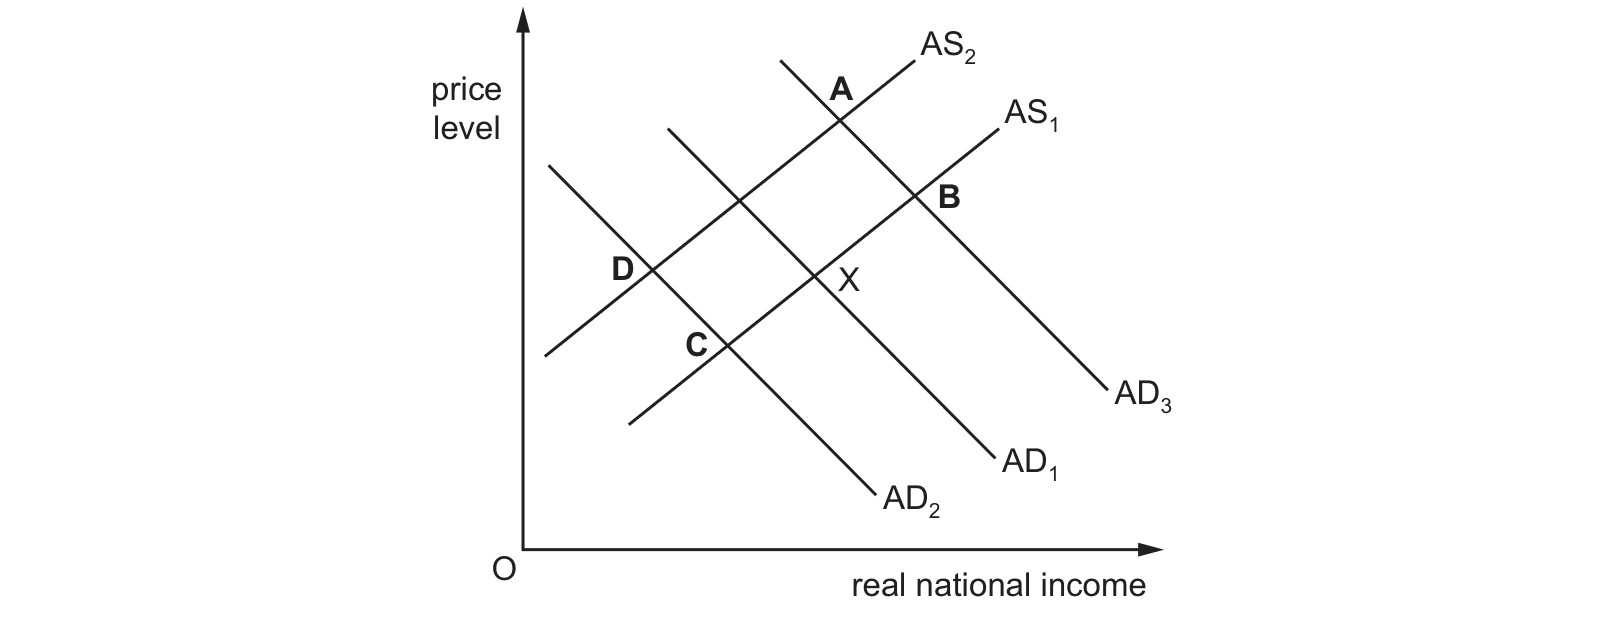
The government of a country plans to cut income tax rates. The initial equilibrium for the country is represented by point X on the diagram. Which new equilibrium point would an economist predict as the result?
Answer: B.
Work out which curve moves and in which direction, then find the point where the new pair crosses. Cutting income tax rates leaves households with more take-home pay, they spend more, and aggregate demand shifts RIGHT, from AD1 out to AD3. Nothing here shifts aggregate supply: the diagram offers AS2 as the alternative, and AS2 lies to the LEFT of AS1, which would mean supply had FALLEN, and a tax cut does not do that. So supply stays on AS1, and the new equilibrium is where AS1 meets AD3, which is B. A is where AD3 meets AS2, so it would need supply to fall at the same time. C and D both sit on AD2, which lies to the left of AD1 and so represents a FALL in aggregate demand, the opposite of what a tax cut produces.
Question 4
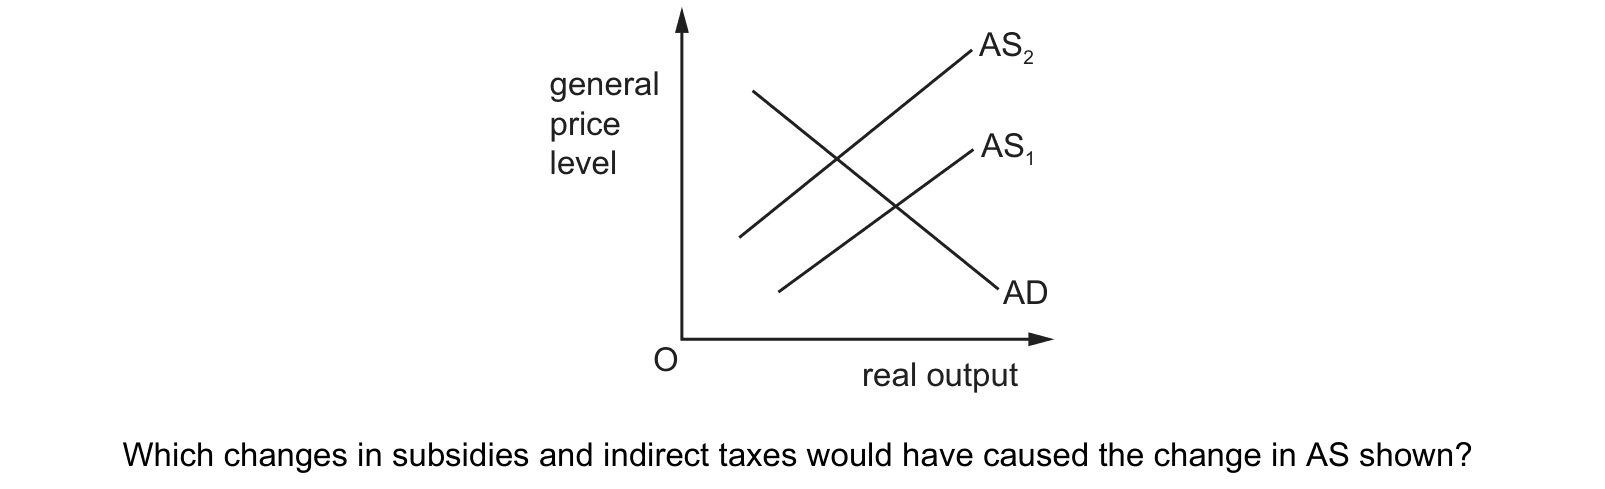
The diagram shows the aggregate demand (AD) and aggregate supply (AS) for an economy. general price level O real output AD AS1 AS2 Which changes in subsidies and indirect taxes would have caused the change in AS shown?
Answer: C.
AS2 lies above and to the left of AS1, so aggregate supply has DECREASED, at any level of output firms now need a higher price to be willing to produce. Work backwards from that: something must have pushed production costs up. A subsidy is money paid to producers, so cutting it takes support away and raises the cost of supplying. An indirect tax is a cost added to each unit sold, so raising it pushes costs up too. Lower subsidies together with higher indirect taxes therefore move AS to the left, which is what the diagram shows. B is the exact reverse and would have shifted AS right, and A and D each pull in opposite directions at once, so neither gives a clear leftward shift.
Question 5
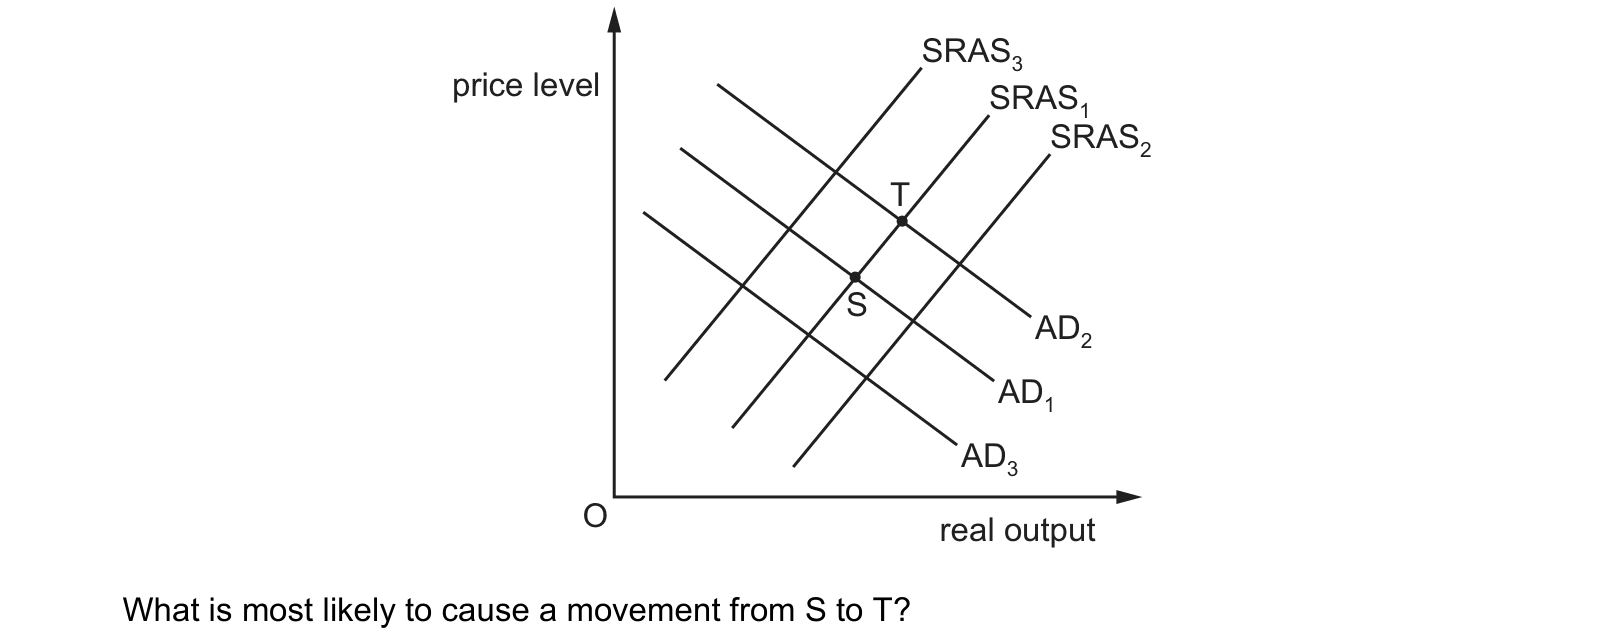
The diagram shows short-run aggregate supply and demand in an economy, where the initial equilibrium is at S. O S T SRAS3 SRAS1 SRAS2 AD2 AD1 AD3 real output price level What is most likely to cause a movement from S to T?
Answer: B.
Locate T relative to S first. T lies up and to the RIGHT of S, so both the price level and real output have risen, and it sits on the SAME supply curve, SRAS1, the move is along that curve to where it meets AD2. So aggregate demand has shifted right and aggregate supply has not moved at all. Now test the options against that. B gives two increases in demand and nothing else: higher consumer expenditure raises the consumption component, and fewer imports means more of any given spending falls on domestic output, so both push AD out while leaving costs untouched. A also raises demand, but higher productivity would shift SRAS out to SRAS2 as well, which is not what the diagram shows. C moves both curves the wrong way, education and training shift supply, and higher income tax cuts demand. D starts with a stronger exchange rate, which makes exports dearer and reduces AD.
These questions are drawn from past CIE 9708 papers and filtered to aggregate demand and aggregate supply analysis. You answer, you find out immediately whether you were right, and you get the reasoning for the correct option and for each distractor. Wrong answers go to a mistakes locker so you can come back to exactly those.
Practice is free. You need an account only so your progress and your mistakes are still there next time.
These are the errors that cost marks on aggregate demand and aggregate supply analysis, taken from our own topic notes. Read them before you practise and you will recognise the traps in the questions.
AD is simply consumer demand. Wrong. AD includes C, I, G and net exports.
Imports are added. Wrong. Imports are subtracted because they are not domestic output.
Transfer payments are directly part of G. Wrong. They are not purchases of current output.
Investment means buying financial assets. Wrong in the AD identity. Investment means expenditure on capital goods and related additions to productive capacity or inventories.
A price-level change shifts AD. Wrong. It causes movement along AD.
A higher price level shifts SRAS. Wrong. It causes movement along SRAS.
Higher AD always raises real output by the same amount. Wrong. The result depends on spare capacity and the shape of AS.
Higher AD always reduces unemployment greatly. Wrong near full employment or where supply constraints dominate.