Price Changes: three questions to try now
Real past-paper questions, the answer key from the mark scheme, and the explanation that goes with it. No account needed to answer them.
Question 1
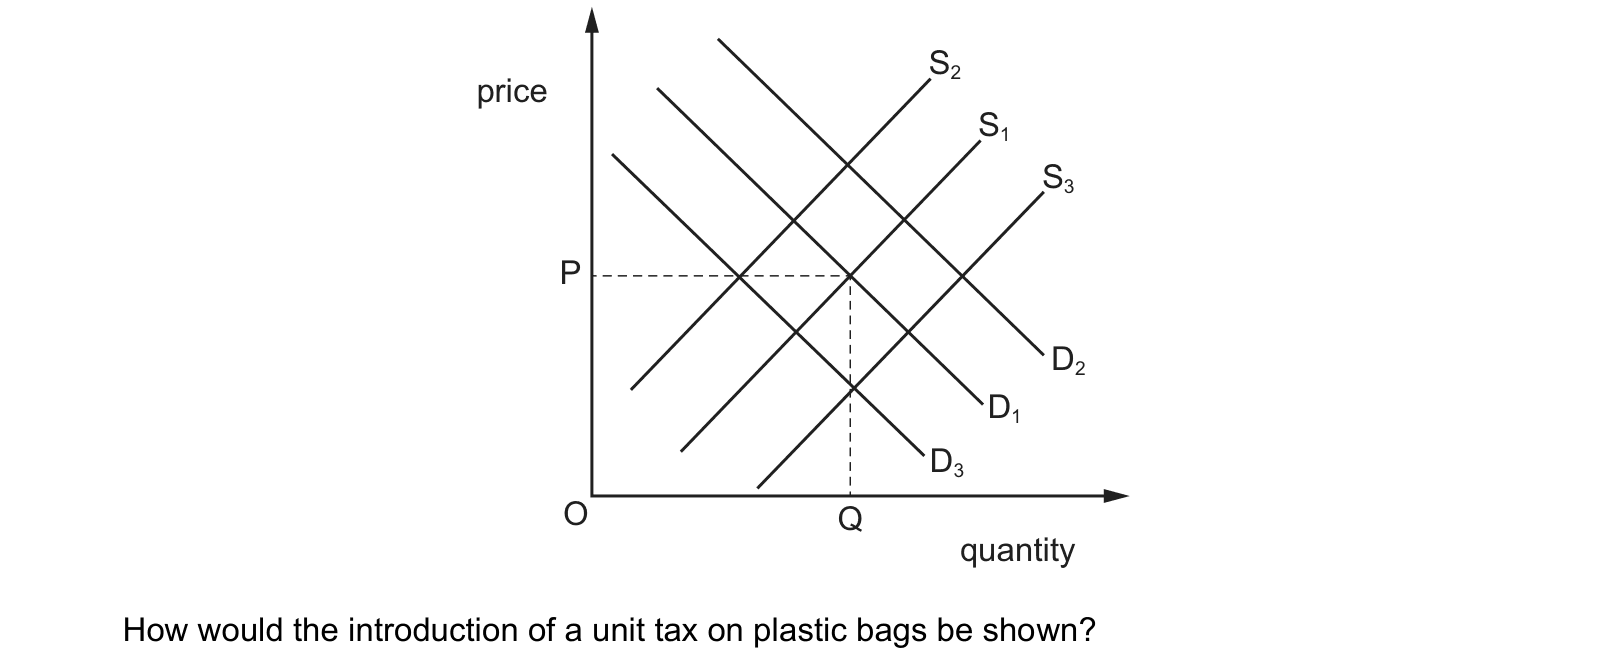
The diagram shows the demand for and supply of plastic bags. The original equilibrium price is P.
How would the introduction of a unit tax on plastic bags be shown?
Answer: C.
A unit tax is charged on each plastic bag sold, so it adds a fixed amount to the cost of supplying every bag. Producers therefore require a higher price to offer any given quantity, and the supply curve shifts upwards and to the left. On this diagram that is the move from S1 to S2. The result is a higher price for consumers and a smaller quantity traded, which is exactly the intention of a tax on plastic bags.
Why the other options are wrong:
- A, demand shifting to D2, moves the demand curve to the right, showing consumers wanting more bags at each price. A tax does not increase demand.
- B, demand shifting to D3, moves demand left. A unit tax is levied on the seller and enters the analysis as a cost of production, so it acts on supply. The fall in the quantity bought comes from the higher price, not from a shift of the demand curve.
- D, supply shifting to S3, moves supply right, which lowers the price. That is what a subsidy does, and it is the opposite of a tax.
Question 2
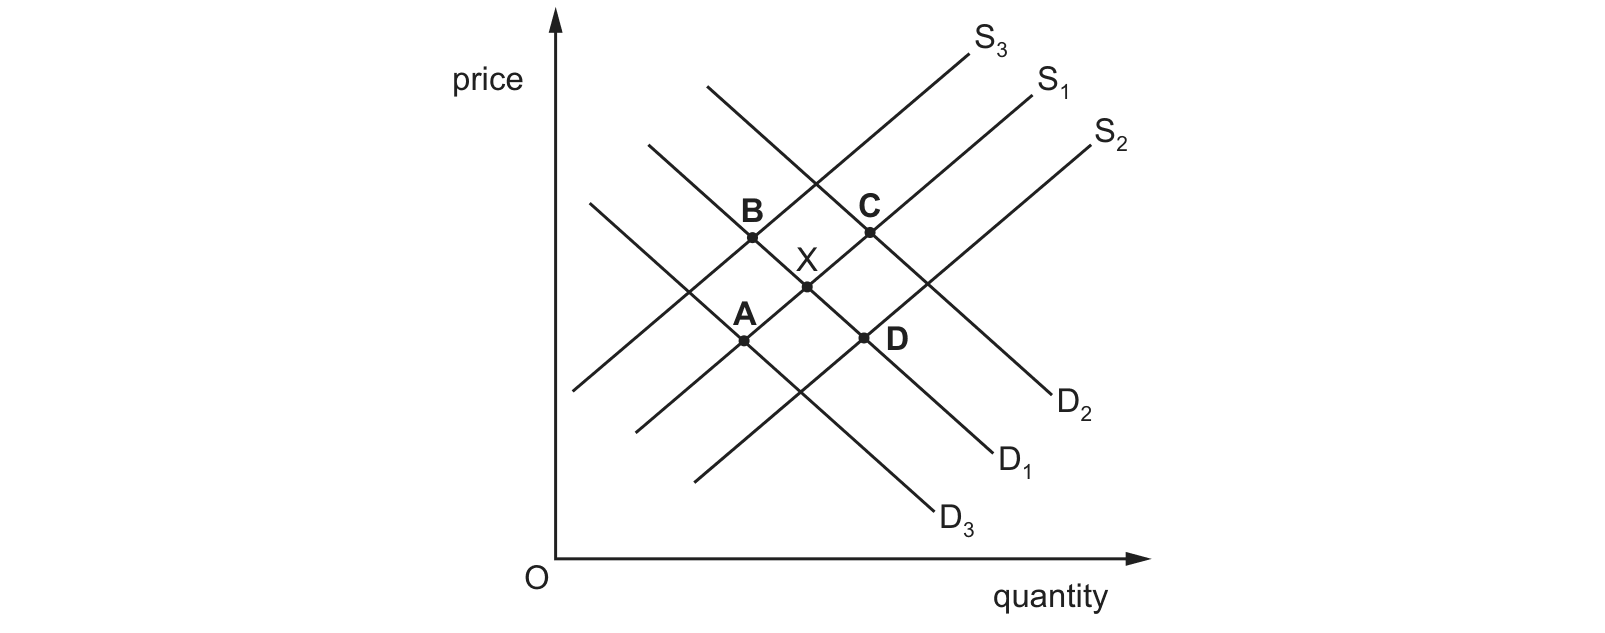
The diagram shows the market for beef in the US with the original equilibrium at X. What will be the new equilibrium position if incomes in the US rise?
Answer: C.
Beef is a normal good, so when incomes in the US rise consumers wish to buy more of it at every price and the demand curve shifts to the right, from D1 to D2. Nothing in the stem affects the cost or the ease of producing beef, so supply stays on S1. The new equilibrium is where S1 crosses D2, which is point C: both the price and the quantity traded are higher than at X.
Why the other options are wrong:
- A lies where S1 crosses D3, the demand curve furthest to the left. That is a fall in demand, which is what would follow a fall in incomes, not a rise.
- B lies where D1 crosses S3, the supply curve furthest to the left. Supply has fallen with demand unchanged, which would follow higher production costs rather than higher incomes.
- D lies where D1 crosses S2, the supply curve furthest to the right. Supply has risen with demand unchanged, again a change on the producers' side of the market.
Question 3
In the diagram, suppliers have set the price of a product at P S. Economic theory predicts that the equilibrium price of the product will rise to P E.
What is the reason for this movement in price?

Answer: C.
At the price PS the quantity demanded exceeds the quantity supplied, so there is a shortage. In a shortage, buyers compete for the limited amount available, and because the demand curve slopes downwards there are consumers further up it who value the product enough to pay more than PS. Suppliers discover this and raise the price. The rise continues, choking off some quantity demanded and drawing out more quantity supplied, until the shortage disappears at PE. The mechanism at work is rationing by price.
Why the other options are wrong:
- A says demand will increase. The demand curve does not move at all here; the market simply travels up it as the price rises, which is a contraction in the quantity demanded rather than an increase in demand.
- B says no more of the product can be supplied. The supply curve slopes upwards, so more can be supplied, and that is precisely what the higher price brings about.
- D says suppliers face rising costs. Rising costs would shift the supply curve to the left and change the equilibrium itself, whereas PE is the equilibrium the existing curves already determine.
What this practice covers
These questions are drawn from past Cambridge IGCSE papers and filtered to price changes. You answer, you find out immediately whether you were right, and you get the reasoning for the correct option and for each distractor. Wrong answers go to a mistakes locker so you can come back to exactly those.
Practice is free. You need an account only so your progress and your mistakes are still there next time.
What examiners see students get wrong here
These are the errors that cost marks on price changes, taken from our own topic notes. Read them before you practise and you will recognise the traps in the questions.
- Saying an increase in supply raises the price.
- Giving the new equilibrium without explaining the adjustment.
- Forgetting to mention quantity as well as price.
- Discussing only consumers, when the question asks about the effects on several groups.
- Ignoring elasticity when discussing what happens to producers' revenue.
- Claiming a definite outcome for both price and quantity when both curves shift.
Revise it first
If any of the above is unfamiliar, work through the notes before practising: Price Changes revision notes.