Supply
Contents: 12 sections
The law of supply
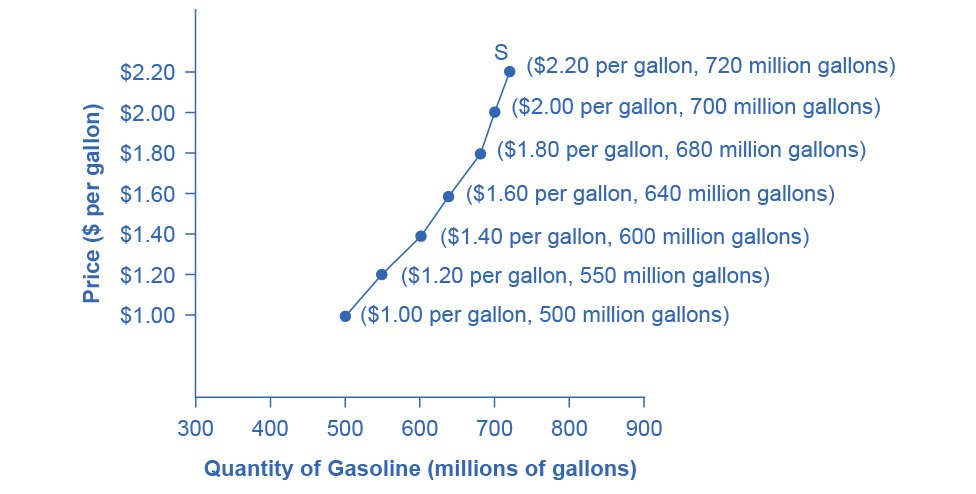
Supply is the quantity of a good producers are willing and able to sell at each price, over a period of time.
The law of supply says that as price rises, quantity supplied rises, all other things being equal. So the supply curve slopes upwards.
Two reasons explain this:
- Profit motive. A higher price, with costs unchanged, means more profit per unit. Existing firms produce more, and new firms are attracted into the market.
- Rising costs. Producing extra units often costs more, overtime pay, older machinery brought back into use, so firms need a higher price to make those extra units worth producing.
Movement along versus a shift
The same rule as demand, and it is tested just as often:
| Cause | What happens | What it is called |
|---|---|---|
| The good's own price changes | Movement along the curve | A change in quantity supplied |
| Anything else changes | The whole curve shifts | A change in supply |
- Extension: a movement up the curve when price rises.
- Contraction: a movement down the curve when price falls.
The trap examiners set most often is an indirect tax. A tax is not a price change from the producer's point of view; it is a cost, so it shifts supply left. Students who treat it as a movement along, or as a demand-side change, lose the marks for the whole question.
Causes of a change in supply (shifts)
- Costs of production. Wages, raw materials, energy, rent. Higher costs shift supply left; lower costs shift it right.
- Technology. Better technology raises output per worker, shifting supply right.
- Indirect taxes. Raise costs
- supply shifts left.
- Subsidies. Lower costs
- supply shifts right.
- Number of firms. More producers in the market shifts supply right; firms leaving shifts it left.
- Weather and natural events. Especially important for farming, drought or flood shifts supply left.
- Prices of other goods. If a farmer can grow wheat or barley and the barley price rises, land moves to barley, so the supply of wheat shifts left.
Individual and market supply
Market supply is the total of all firms' supply at each price. This is why firms entering or leaving an industry shifts market supply even when no existing firm changes what it does.
Worked example
A government gives a subsidy to solar-panel manufacturers.
- The subsidy lowers the cost of making each panel
- at every price, firms are willing to supply more
- the supply curve shifts right, from S1 to S2
- at the old price there is now more supply than demand
- the price falls and the quantity traded rises.
A second case, to show the difference. Now suppose the government instead puts a tax on the panels.
- Costs rise
- supply shifts left
- price rises and quantity falls.
Notice that in both cases the supply curve moved, because taxes and subsidies affect producers' costs, not what consumers are willing to pay.
Common exam mistakes
- Saying a price rise "increases supply", it increases quantity supplied.
- Treating an indirect tax as a demand-side change. It shifts supply.
- Shifting supply when the good's own price changed.
- Shifting supply for a change in consumer incomes or tastes; those are demand factors.
- Forgetting to label curves S1 and S2 when showing a shift.
Exam technique
Name the exact cause of a shift and its direction, "supply shifts left because energy costs have risen" rather than "supply shifts left".
Label axes price and quantity, label both curves, and mark the old and new equilibrium if the question asks about the market outcome.
When a question mentions a tax or subsidy, say clearly that it changes producers' costs, then shift supply. That one sentence shows the examiner you know which side of the market is affected.
Building an answer
Paper 2 rewards a chain of reasoning, not a list. These frames match the tariffs 0455 actually uses.
2 marks, "Define supply."
Supply is the quantity of a good that producers are willing and able to sell at each price over a given period of time.
One mark for quantity producers will sell at each price, one for willing and able. The phrase "willing and able" is what separates a full-mark definition from a half-mark one, because it rules out producers who would like to sell but cannot.
4 marks, "Explain two factors that could cause the supply of coffee to fall."
One factor is a rise in production costs. If the price of fertiliser rises, growing each sack of coffee costs more, so at any given price farmers find it less profitable and offer less. The supply curve shifts left.
>
A second factor is poor weather. Drought in a growing region reduces the yield per hectare, so even farmers willing to sell more cannot, and supply shifts left again.
Two marks per factor: one for naming it, one for the chain that ends in supply shifts left. Naming four factors without explaining any of them scores two, not four.
6 marks, "Analyse the effect of a subsidy on the market for solar panels."
Open with the mechanism: a subsidy is a payment to producers that lowers their cost per unit.
Then the shift: at every price firms are now willing to supply more, so supply shifts right from S1 to S2.
Then the market outcome: at the old price supply now exceeds demand, so price falls to a new, lower equilibrium and the quantity traded rises.
Close by naming who gains: consumers pay less, producers sell more, and the government bears the cost.
A real market to quote
Nigerian cocoa, 2024. Fertiliser costs roughly doubled after global fertiliser prices spiked, and several growing regions had unusually heavy rainfall. Both are supply-side shocks pushing the same way, costs up, yields down, so supply shifted left and world cocoa prices reached record highs.
Two things make this worth memorising. First; it is a cost change and a natural change acting together, which is exactly what a 6-mark question likes. Second, the price rise came from the supply side, so any answer claiming consumers suddenly wanted more chocolate has the wrong side of the market.
Definitions the mark scheme accepts
| Term | Definition to learn |
|---|---|
| Supply | The quantity producers are willing and able to sell at each price over a period of time |
| Quantity supplied | The amount offered for sale at one particular price |
| Extension of supply | A movement up the supply curve caused by a rise in the good's own price |
| Contraction of supply | A movement down the supply curve caused by a fall in the good's own price |
| Subsidy | A payment by government to producers that lowers their costs per unit |
| Indirect tax | A tax on spending, collected by producers, which raises their costs per unit |
Quick revision
- Supply = willing and able to sell at each price.
- The curve slopes up because of the profit motive and rising costs.
- Own price → movement along (quantity supplied). Anything else → shift (supply).
- Shifters: costs, technology, taxes, subsidies, number of firms, weather, other goods' prices.
- Indirect tax → supply left. Subsidy → supply right.
- Market supply is the total of all firms' supply, so entry and exit shift it.
Check you have it
Question 1
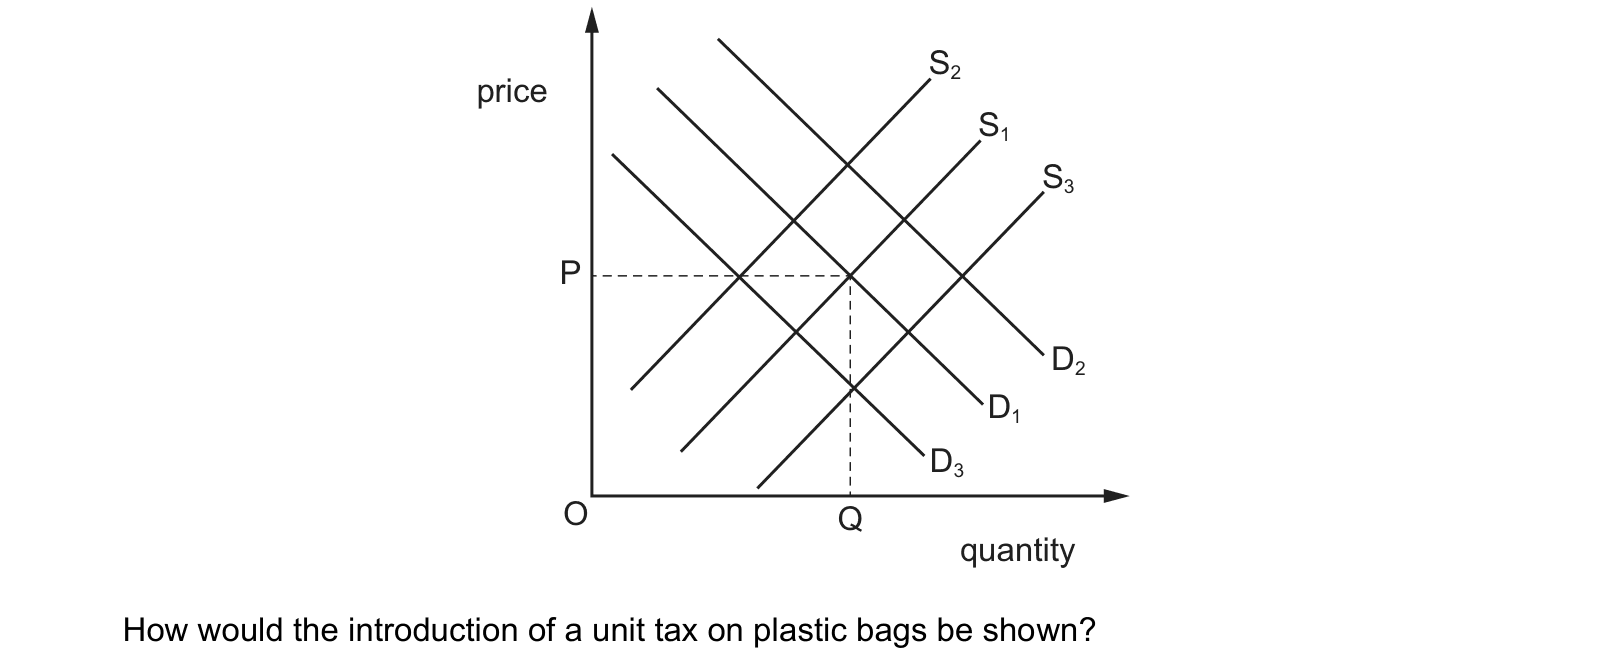
The diagram shows the demand for and supply of plastic bags. The original equilibrium price is P.
How would the introduction of a unit tax on plastic bags be shown?
Answer: C.
A unit tax is charged on each plastic bag sold, so it adds a fixed amount to the cost of supplying every bag. Producers therefore require a higher price to offer any given quantity, and the supply curve shifts upwards and to the left. On this diagram that is the move from S1 to S2. The result is a higher price for consumers and a smaller quantity traded, which is exactly the intention of a tax on plastic bags.
Why the other options are wrong:
- A, demand shifting to D2, moves the demand curve to the right, showing consumers wanting more bags at each price. A tax does not increase demand.
- B, demand shifting to D3, moves demand left. A unit tax is levied on the seller and enters the analysis as a cost of production, so it acts on supply. The fall in the quantity bought comes from the higher price, not from a shift of the demand curve.
- D, supply shifting to S3, moves supply right, which lowers the price. That is what a subsidy does, and it is the opposite of a tax.
Question 2
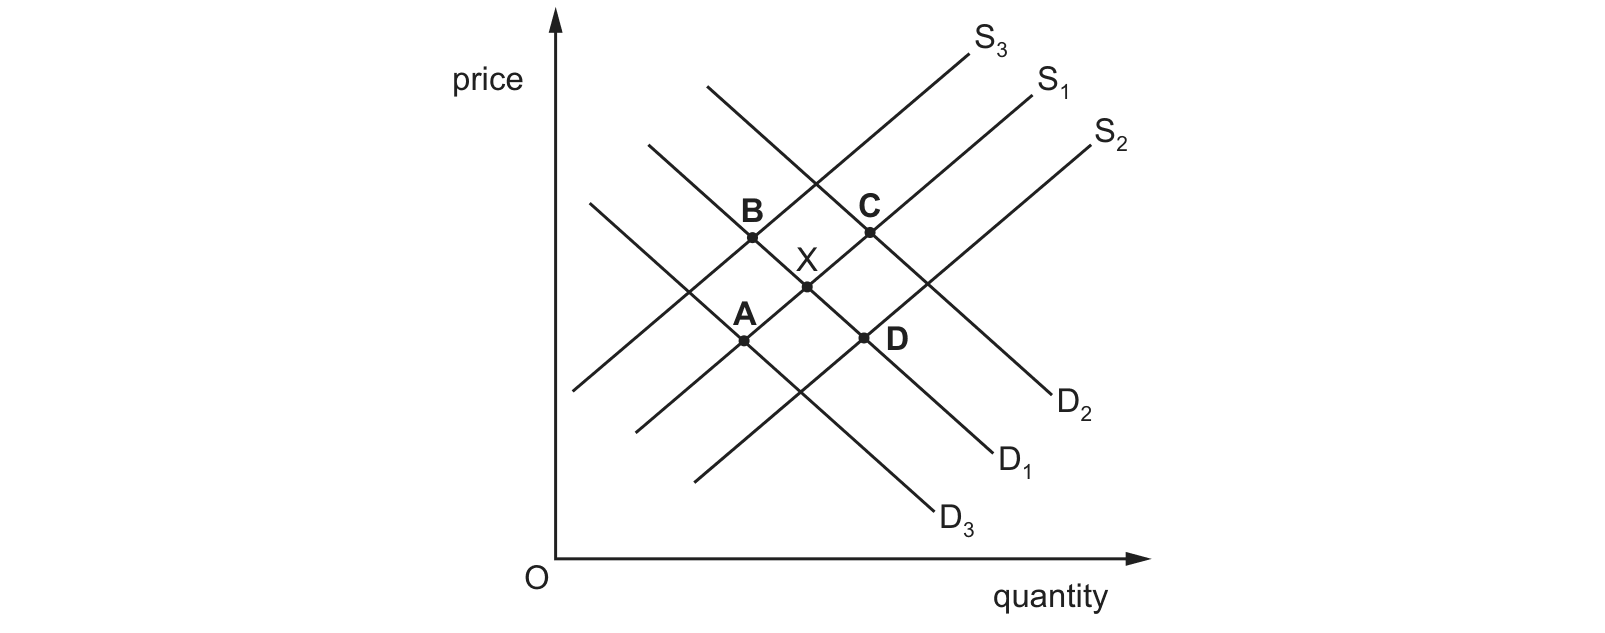
The diagram shows the market for beef in the US with the original equilibrium at X. What will be the new equilibrium position if incomes in the US rise?
Answer: C.
Beef is a normal good, so when incomes in the US rise consumers wish to buy more of it at every price and the demand curve shifts to the right, from D1 to D2. Nothing in the stem affects the cost or the ease of producing beef, so supply stays on S1. The new equilibrium is where S1 crosses D2, which is point C: both the price and the quantity traded are higher than at X.
Why the other options are wrong:
- A lies where S1 crosses D3, the demand curve furthest to the left. That is a fall in demand, which is what would follow a fall in incomes, not a rise.
- B lies where D1 crosses S3, the supply curve furthest to the left. Supply has fallen with demand unchanged, which would follow higher production costs rather than higher incomes.
- D lies where D1 crosses S2, the supply curve furthest to the right. Supply has risen with demand unchanged, again a change on the producers' side of the market.
Question 3
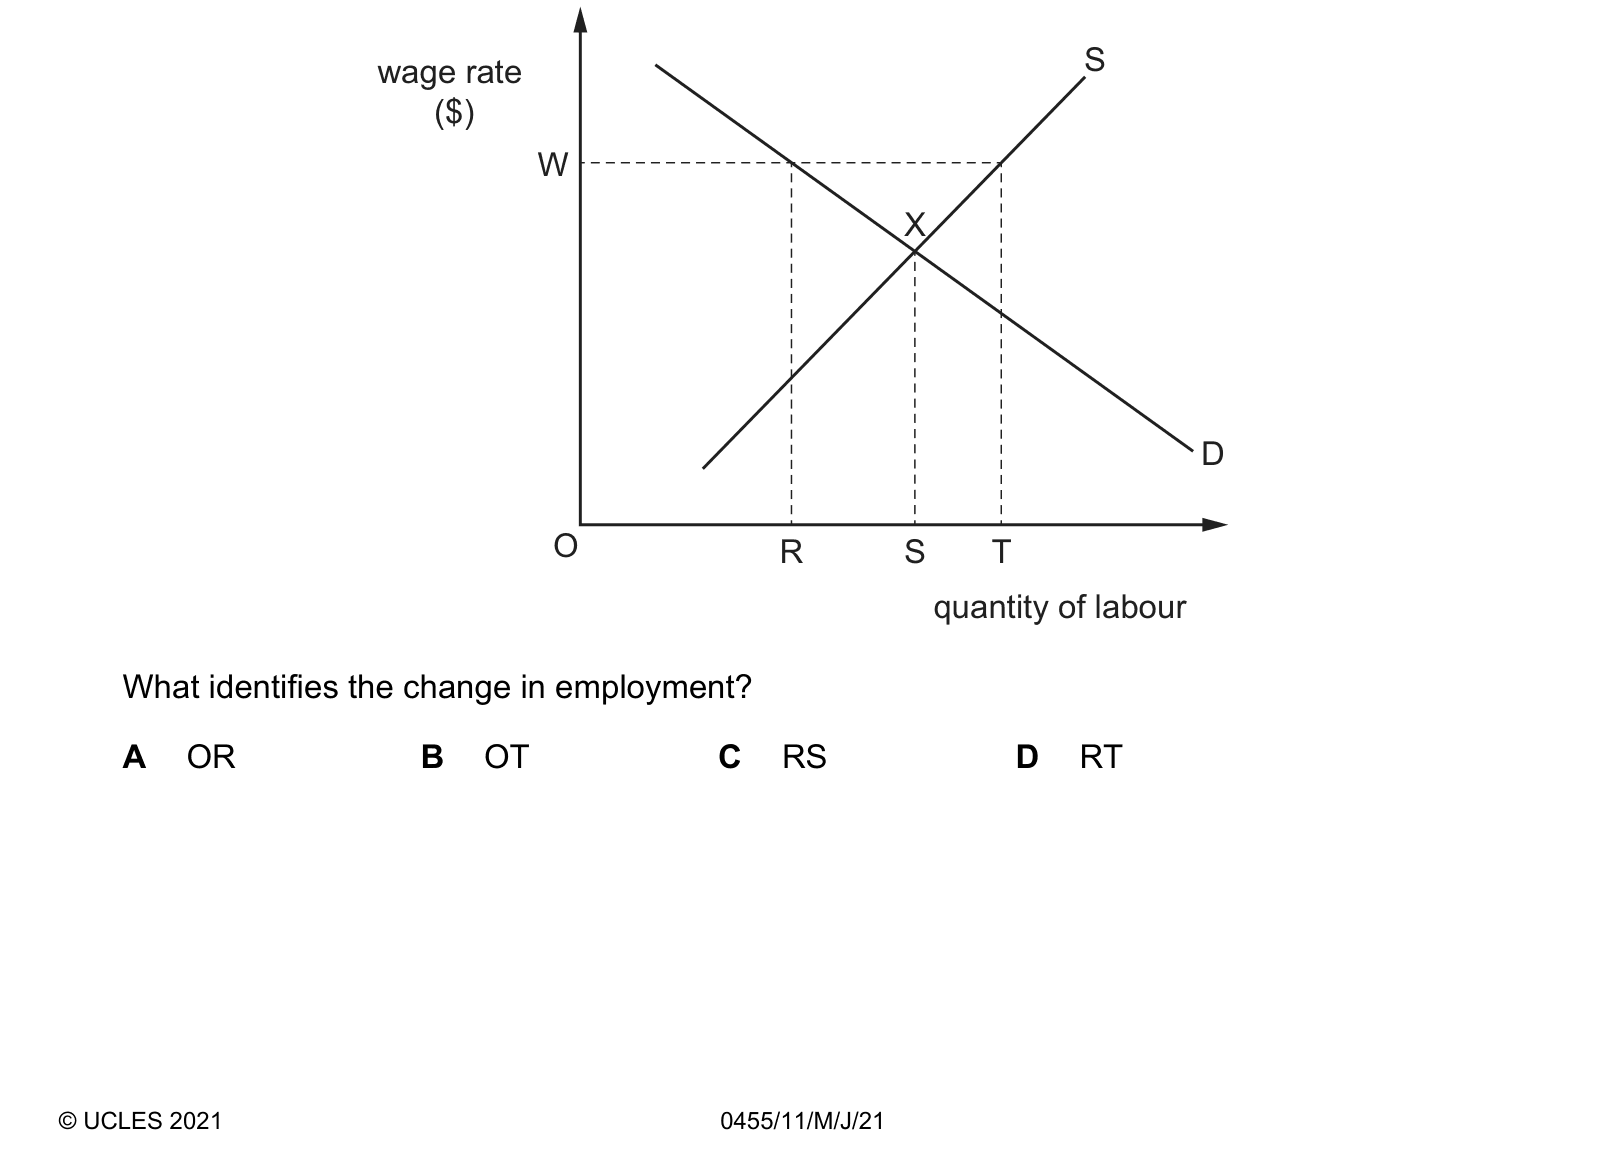
The diagram shows the demand for and supply of labour in an industry. The original equilibrium
is X.
A trade union then negotiates a wage rate of W.
R S T
What identifies the change in employment?
Answer: C.
Before the union acts, the market clears at X with employment of OS. The negotiated wage W lies above that equilibrium, and at W firms only wish to hire OR workers while OT workers want jobs. Employment is always decided by the shorter side of the market, which here is demand, so the number employed falls from OS to OR. The change in employment is therefore the distance RS.
Why the other options are wrong:
- A, OR, is the new level of employment rather than the change in it. The question asks by how much employment altered, not what it became.
- B, OT, is the quantity of labour supplied at the wage W. Those extra workers want jobs at that wage but no firm is willing to employ them, so OT is not employment at all.
- D, RT, is the gap between the quantity of labour supplied and the quantity demanded at W. That is the unemployment the higher wage creates, which is a genuine and important magnitude, but it is not the fall in the number of people working.
What the syllabus asks for on this topicSyllabus points
Syllabus points
- Define supply and explain the law of supply.
- Distinguish a movement along from a shift of the supply curve.
- Explain the causes of changes in supply.
Related Cambridge IGCSE topics
Not the topic you were looking for? Describe what you are stuck on in your own words and we will take you to the notes that answer it.