Price Determination
Contents: 11 sections
Market equilibrium
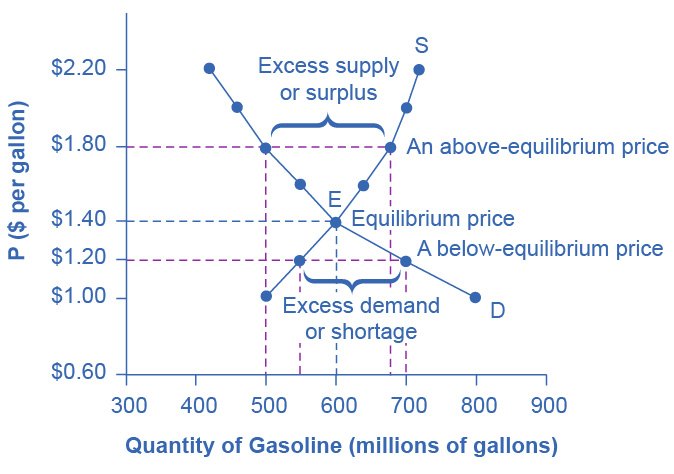
Equilibrium is where the demand and supply curves cross, the price at which the quantity consumers want to buy exactly equals the quantity producers want to sell.
At this price the market clears: there is nothing left unsold and nobody willing to pay who cannot buy. There is no pressure for the price to change, which is why it is also called the market-clearing price.
| Term | Meaning |
|---|---|
| Equilibrium price | The price where quantity demanded = quantity supplied |
| Equilibrium quantity | The quantity bought and sold at that price |
| Excess demand (shortage) | Quantity demanded > quantity supplied, at a price below equilibrium |
| Excess supply (surplus) | Quantity supplied > quantity demanded, at a price above equilibrium |
How the market reaches equilibrium
Markets correct themselves, and the exam wants the mechanism explained step by step.
If the price is too high (above equilibrium):
- Quantity supplied is greater than quantity demanded
- there is excess supply
- goods go unsold and stocks pile up
- firms cut the price to sell them
- as price falls, quantity demanded rises and quantity supplied falls
- this continues until the market clears at equilibrium.
If the price is too low (below equilibrium):
- Quantity demanded is greater than quantity supplied
- there is excess demand
- buyers compete for the limited goods and are willing to pay more
- the price is bid up
- as price rises, quantity demanded falls and quantity supplied rises
- the market clears.
Notice that in both cases the adjustment happens through movements along the curves, neither curve shifts. This is a favourite examiner trap.
What happens when a curve shifts
Once you can read the diagram, every "what happens to price and quantity" question follows the same four patterns:
| Shift | Price | Quantity |
|---|---|---|
| Demand right (increase) | Rises | Rises |
| Demand left (decrease) | Falls | Falls |
| Supply right (increase) | Falls | Rises |
| Supply left (decrease) | Rises | Falls |
The one students get wrong is supply: an increase in supply lowers the price. More of something available makes it cheaper.
Worked example
A poor harvest destroys part of a country's wheat crop.
- Bad weather means less wheat can be supplied at every price
- the supply curve shifts left, from S1 to S2
- at the old price there is now excess demand, because buyers want more than farmers can supply
- buyers bid the price up
- as the price rises, quantity demanded falls and quantity supplied rises along the new curve
- the market settles at a higher price and a lower quantity.
Who gains and who loses. Consumers pay more and get less. Farmers who still have wheat to sell may actually earn more revenue, because the price rise is large and people still need to buy food, a link to price elasticity of demand (2.7).
Common exam mistakes
- Confusing excess demand with excess supply. Remember: price too low → shortage; price too high → surplus.
- Shifting a curve to correct a shortage. Shortages are corrected by the price changing, which causes movements along the curves.
- Saying an increase in supply raises the price. It lowers it.
- Not labelling the old and new equilibrium price and quantity on the diagram.
- Describing the outcome without explaining the adjustment process.
Exam technique
Draw and label fully: axes as price and quantity, curves as D and S, and both equilibria marked with dotted lines across to the price axis and down to the quantity axis.
When explaining, always give the chain: shift → excess demand or supply at the old price → price changes → movements along the curves → new equilibrium. Examiners award marks for the steps, not just the final answer.
If the question asks what happens to both price and quantity, answer both explicitly, many students state one and forget the other.
Building an answer
2 marks, "Define equilibrium price."
The equilibrium price is the price at which quantity demanded equals quantity supplied, so there is no tendency for price to change.
The second half earns the second mark. A definition that stops at "where demand equals supply" is describing the point, not explaining why it settles there.
4 marks, "Explain what happens if price is set above equilibrium."
Above equilibrium, quantity supplied exceeds quantity demanded, so there is a surplus of unsold stock.
Producers holding stock they cannot sell cut their prices to clear it. As price falls, quantity demanded extends and quantity supplied contracts, and the surplus shrinks until the market returns to equilibrium.
The marks are for the surplus, and for the self-correction through extension and contraction, not for redrawing the diagram.
6 marks, "Analyse the effect of a rise in incomes on the market for new cars."
Cars are a normal good, so higher incomes raise demand: the demand curve shifts right from D1 to D2.
At the old price, quantity demanded now exceeds quantity supplied, creating a shortage.
The shortage bids the price up. As price rises, quantity supplied extends along the supply curve and quantity demanded contracts along the new demand curve.
A new equilibrium is reached at a higher price and a higher quantity.
Notice the discipline: one curve shifts, the other is moved along. Shifting both is the single most common way to lose these marks.
A real market to quote
Global shipping rates, 2021. Demand for consumer goods recovered faster than container capacity could be restored, so demand shifted right against a nearly vertical short-run supply. The result was a shortage and a price rise of several hundred per cent on some routes.
It is a useful example because it shows why the elasticity of supply matters to the size of the price change: when supply cannot extend, almost the whole adjustment falls on price rather than quantity.
Definitions the mark scheme accepts
| Term | Definition to learn |
|---|---|
| Equilibrium | The price and quantity at which quantity demanded equals quantity supplied |
| Disequilibrium | Any price at which quantity demanded and quantity supplied are not equal |
| Surplus (excess supply) | Quantity supplied exceeds quantity demanded at the current price |
| Shortage (excess demand) | Quantity demanded exceeds quantity supplied at the current price |
| Price mechanism | The way changes in price signal, ration and give incentives so that resources are reallocated |
Quick revision
- Equilibrium = where demand meets supply; the market clears.
- Price too low → excess demand (shortage) → price bid up.
- Price too high → excess supply (surplus) → price cut down.
- Adjustment happens by movements along the curves, not shifts.
- D right → P↑ Q↑. D left → P↓ Q↓. S right → P↓ Q↑. S left → P↑ Q↓.
- Always explain the chain, not just the outcome.
What the syllabus asks for on this topicSyllabus points
Syllabus points
- Explain market equilibrium and how it is reached.
- Explain the meaning of excess demand and excess supply.
Related Cambridge IGCSE topics
Not the topic you were looking for? Describe what you are stuck on in your own words and we will take you to the notes that answer it.