Demand
Contents: 12 sections
The law of demand
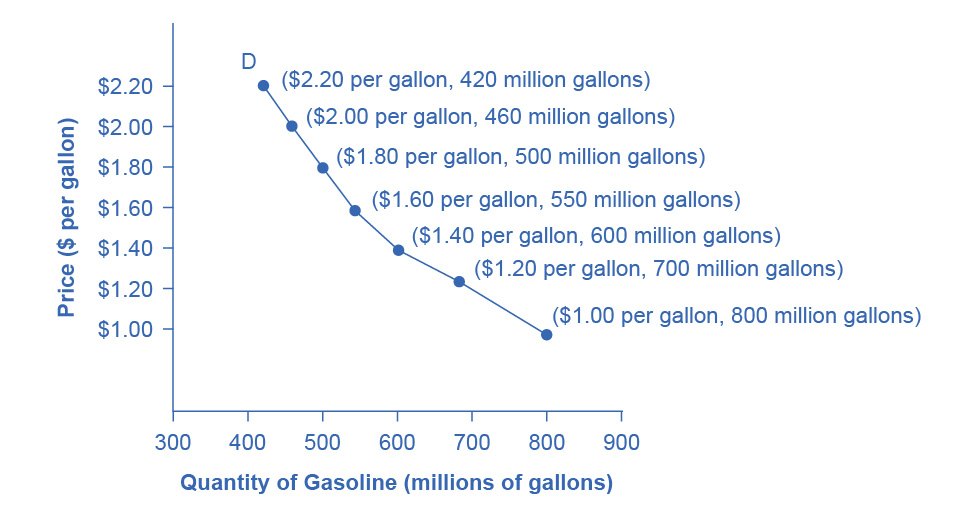
Demand is the quantity of a good consumers are willing and able to buy at each price, over a period of time.
Both words matter. Wanting a car is not demand; you must also be able to pay for it. Economists call this effective demand.
The law of demand says that as price rises, quantity demanded falls, and as price falls, quantity demanded rises, all other things being equal. So the demand curve slopes downwards.
Two reasons explain this:
- Income effect: when the price falls, your money goes further, so you can afford more.
- Substitution effect: when the price falls, the good becomes cheaper than its alternatives, so people switch to it.
Movement along versus a shift
This is the most commonly confused idea in the whole syllabus, and the rule has no exceptions:
| Cause | What happens | What it is called |
|---|---|---|
| The good's own price changes | Movement along the curve | A change in quantity demanded |
| Anything else changes | The whole curve shifts | A change in demand |
The words are not decoration. Writing "a price fall increases demand" is marked wrong, a price fall increases quantity demanded. Get into the habit of using the two phrases correctly, because examiners check exactly this.
- Extension: a movement down the curve to a larger quantity when price falls.
- Contraction: a movement up the curve to a smaller quantity when price rises.
Causes of a change in demand (shifts)
Remember them as income, related goods, tastes, population, expectations:
- Income. For a normal good, higher income raises demand. For an inferior good, higher income lowers demand, because people trade up to something better, for example bus travel or value-brand food.
- Price of substitutes. A substitute is an alternative. If the price of tea rises, demand for coffee rises.
- Price of complements. A complement is used together with the good. If the price of petrol rises, demand for large cars falls.
- Tastes and fashion. Advertising, trends, and health information, demand for sugary drinks fell as health warnings spread.
- Population. More consumers means higher demand. Changes in the age structure matter too: an ageing population raises demand for healthcare.
- Expectations. If people expect prices to rise soon, demand rises now.
- Interest rates and credit. For things usually bought on credit, cars, houses, cheaper borrowing raises demand.
Government policy can also shift demand: a subsidy to consumers raises it, an indirect tax passed on as a higher price causes a movement along instead.
Individual and market demand
Market demand is the total of all individual demands at each price, you add up the quantities every consumer would buy. This is why a rise in population shifts market demand right even though no single person changed their behaviour.
Worked example
The price of petrol rises sharply. What happens in the market for large cars?
- Petrol and large cars are complements, you need one to use the other
- running a large car now costs more overall
- at every price, fewer people are willing and able to buy one
- the demand curve for large cars shifts left.
This is a shift, not a movement, because the price of cars has not changed, the price of petrol has, and that is a non-price factor for the car market.
Follow it through: with supply unchanged, a leftward shift in demand means the equilibrium price of large cars falls and the quantity sold falls too.
Common exam mistakes
- Saying a price change "increases demand", it changes quantity demanded.
- Shifting the curve when the good's own price changed.
- Confusing substitutes with complements.
- Confusing an inferior good with a cheap or poor-quality good. An inferior good is defined by what happens when income rises.
- Forgetting to label the axes as price and quantity.
- Not labelling the curves D1 and D2 when showing a shift.
Exam technique
Label the axes price and quantity, and always label the original curve D1 and the new one D2 with an arrow showing the direction.
State the cause as well as the direction: "demand shifts right because incomes have risen and this is a normal good" earns the explanation mark that "demand shifts right" does not.
If the question describes a change, decide first: is it the good's own price (movement along) or something else (shift)? That single decision usually determines whether the whole answer is right.
Building an answer
2 marks, "Define demand."
Demand is the quantity of a good consumers are willing and able to buy at each price over a given period of time.
"Willing and able" is the mark. Wanting a Ferrari is not demand; wanting one and being able to pay for it is.
4 marks, "Explain two factors that could increase the demand for bicycles."
A rise in the price of petrol makes driving more expensive. Bicycles are a substitute for short car journeys, so some drivers switch and demand for bicycles rises at every price.
A government campaign on the health benefits of cycling changes tastes, so more people want bicycles at any given price and demand shifts right.
Each factor needs the chain ending in demand shifts right, naming four factors without chains scores two.
6 marks, "Analyse the effect of a rise in incomes on the market for bus travel."
Bus travel is, for many consumers, an inferior good: as income rises they switch to cars or taxis.
Demand for bus travel therefore shifts left, not right.
At the old fare there is now excess supply, so operators cut fares or reduce services, and both price and quantity fall.
The result depends entirely on whether the good is normal or inferior, which is why identifying the type of good is the first step in the answer.
The determinants, and which way each shifts demand
| Determinant | Change | Demand shifts |
|---|---|---|
| Income (normal good) | Rises | Right |
| Income (inferior good) | Rises | Left |
| Price of a substitute | Rises | Right |
| Price of a complement | Rises | Left |
| Tastes and fashion | Move towards the good | Right |
| Population | Rises | Right |
| Expectations of future price | Expected to rise | Right (buy now) |
| Interest rates | Fall | Right for goods bought on credit |
A real case to quote
Second-hand clothing during the 2022 cost-of-living squeeze. Real incomes fell and demand for second-hand clothes rose sharply, the defining behaviour of an inferior good. It is a better example than the textbook's usual one because students can see it happening, and because it shows income affecting demand in the opposite direction to instinct.
Quick revision
- Demand = willing and able to buy at each price.
- The curve slopes down because of the income and substitution effects.
- Own price → movement along (quantity demanded). Anything else → shift (demand).
- Shifters: income, substitutes, complements, tastes, population, expectations, credit.
- Normal good: income up → demand up. Inferior good: income up → demand down.
- Substitutes move demand the same way as their price; complements the opposite way.
Check you have it
Question 1
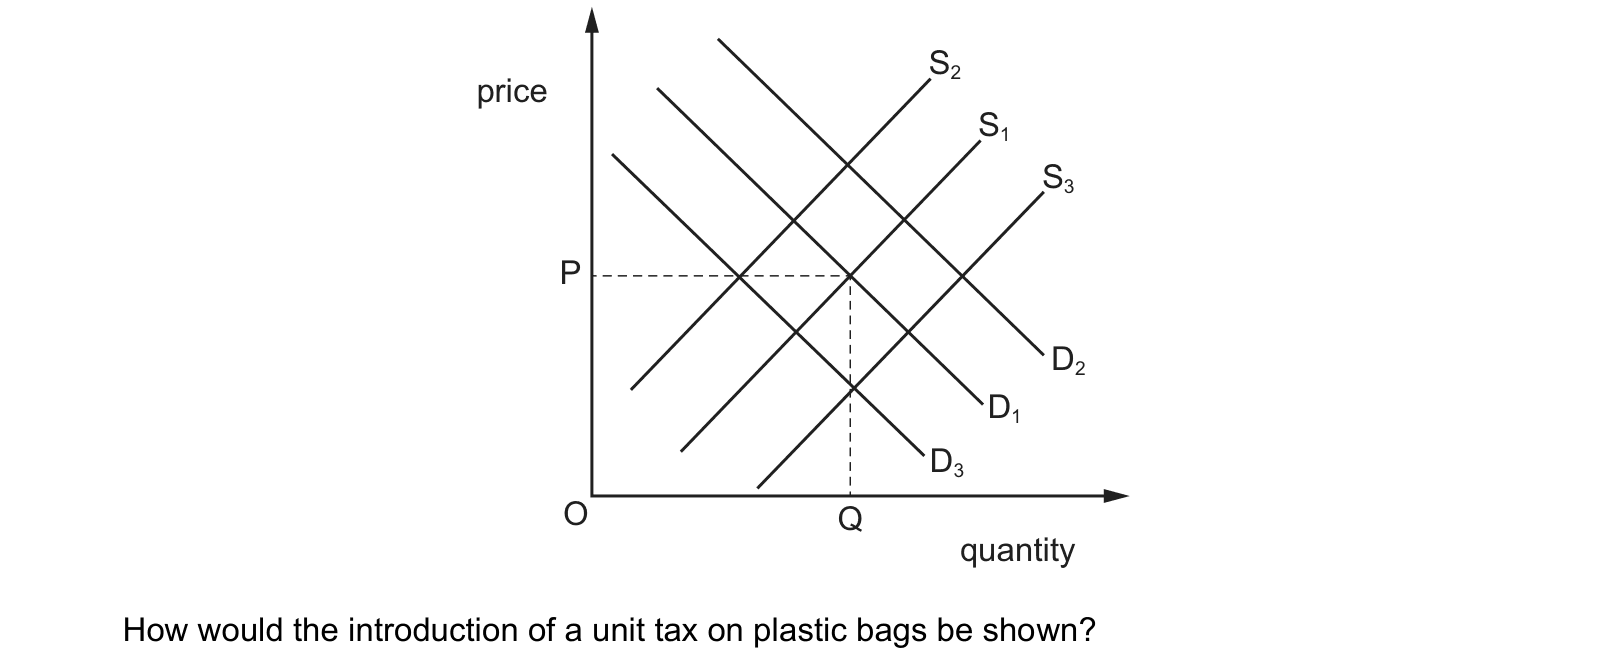
The diagram shows the demand for and supply of plastic bags. The original equilibrium price is P.
How would the introduction of a unit tax on plastic bags be shown?
Answer: C.
A unit tax is charged on each plastic bag sold, so it adds a fixed amount to the cost of supplying every bag. Producers therefore require a higher price to offer any given quantity, and the supply curve shifts upwards and to the left. On this diagram that is the move from S1 to S2. The result is a higher price for consumers and a smaller quantity traded, which is exactly the intention of a tax on plastic bags.
Why the other options are wrong:
- A, demand shifting to D2, moves the demand curve to the right, showing consumers wanting more bags at each price. A tax does not increase demand.
- B, demand shifting to D3, moves demand left. A unit tax is levied on the seller and enters the analysis as a cost of production, so it acts on supply. The fall in the quantity bought comes from the higher price, not from a shift of the demand curve.
- D, supply shifting to S3, moves supply right, which lowers the price. That is what a subsidy does, and it is the opposite of a tax.
Question 2
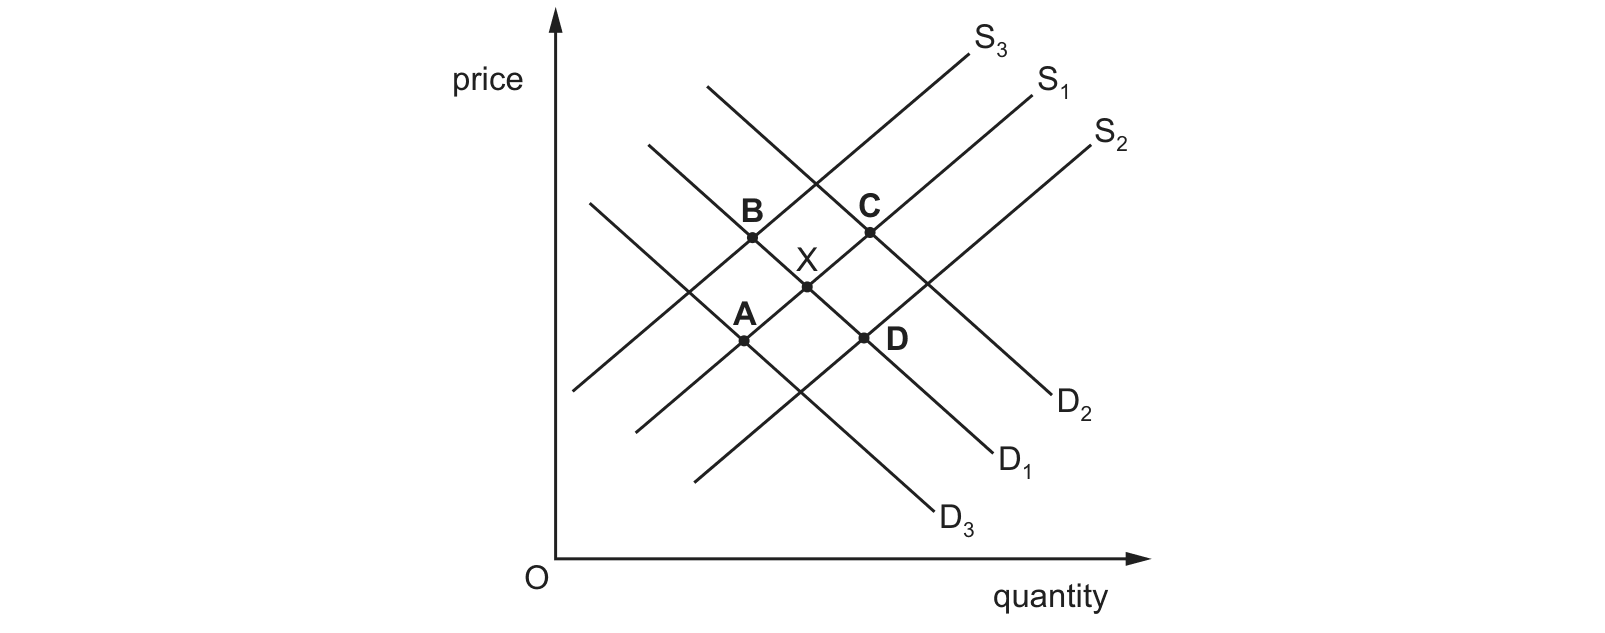
The diagram shows the market for beef in the US with the original equilibrium at X. What will be the new equilibrium position if incomes in the US rise?
Answer: C.
Beef is a normal good, so when incomes in the US rise consumers wish to buy more of it at every price and the demand curve shifts to the right, from D1 to D2. Nothing in the stem affects the cost or the ease of producing beef, so supply stays on S1. The new equilibrium is where S1 crosses D2, which is point C: both the price and the quantity traded are higher than at X.
Why the other options are wrong:
- A lies where S1 crosses D3, the demand curve furthest to the left. That is a fall in demand, which is what would follow a fall in incomes, not a rise.
- B lies where D1 crosses S3, the supply curve furthest to the left. Supply has fallen with demand unchanged, which would follow higher production costs rather than higher incomes.
- D lies where D1 crosses S2, the supply curve furthest to the right. Supply has risen with demand unchanged, again a change on the producers' side of the market.
Question 3
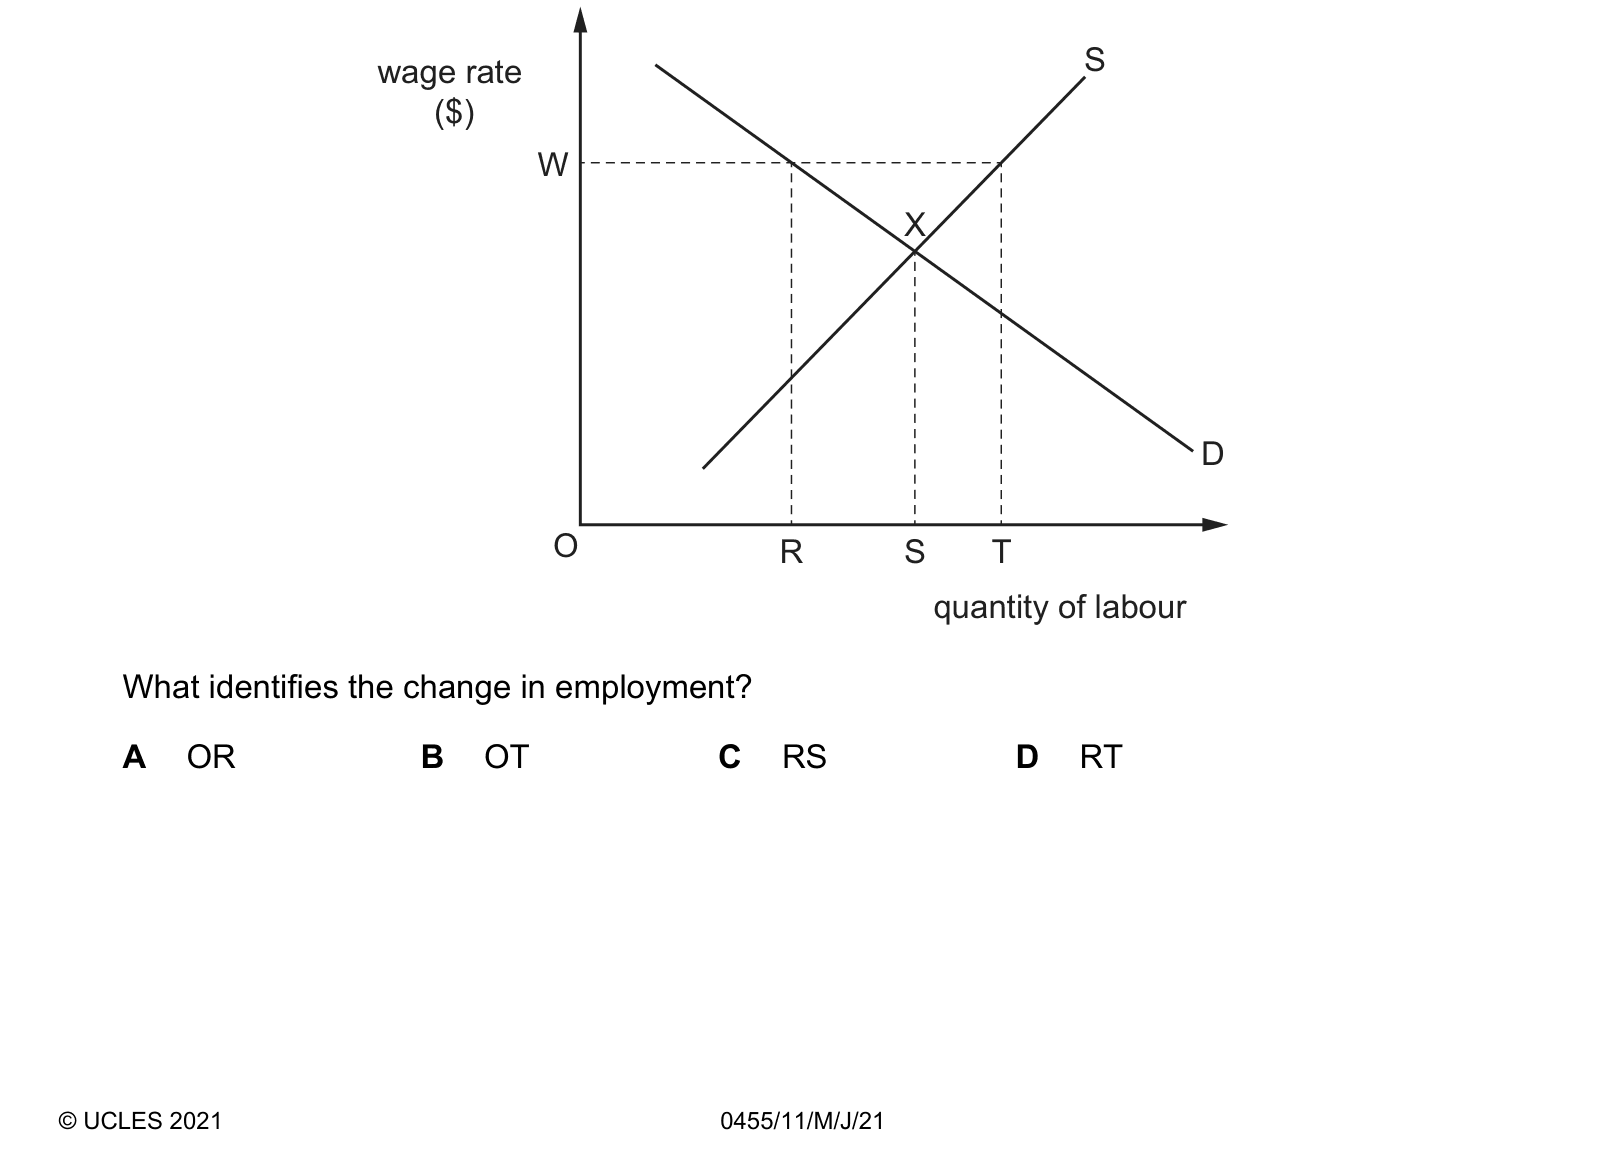
The diagram shows the demand for and supply of labour in an industry. The original equilibrium
is X.
A trade union then negotiates a wage rate of W.
R S T
What identifies the change in employment?
Answer: C.
Before the union acts, the market clears at X with employment of OS. The negotiated wage W lies above that equilibrium, and at W firms only wish to hire OR workers while OT workers want jobs. Employment is always decided by the shorter side of the market, which here is demand, so the number employed falls from OS to OR. The change in employment is therefore the distance RS.
Why the other options are wrong:
- A, OR, is the new level of employment rather than the change in it. The question asks by how much employment altered, not what it became.
- B, OT, is the quantity of labour supplied at the wage W. Those extra workers want jobs at that wage but no firm is willing to employ them, so OT is not employment at all.
- D, RT, is the gap between the quantity of labour supplied and the quantity demanded at W. That is the unemployment the higher wage creates, which is a genuine and important magnitude, but it is not the fall in the number of people working.
What the syllabus asks for on this topicSyllabus points
Syllabus points
- Define demand and explain the law of demand.
- Distinguish a movement along from a shift of the demand curve.
- Explain the causes of changes in demand.
Related Cambridge IGCSE topics
Not the topic you were looking for? Describe what you are stuck on in your own words and we will take you to the notes that answer it.