Price Changes
Contents: 11 sections
How the equilibrium changes
When demand or supply shifts, the market moves to a new equilibrium. There are only four basic cases, and every question is one of them:
| Shift | Price | Quantity |
|---|---|---|
| Demand increases (right) | Rises | Rises |
| Demand decreases (left) | Falls | Falls |
| Supply increases (right) | Falls | Rises |
| Supply decreases (left) | Rises | Falls |
The one students invert is supply: more supply means a lower price. More of something available makes it cheaper.
The steps to explain
Never just state the outcome. Marks are awarded for the process:
- The cause
- which curve shifts and in which direction
- excess demand or excess supply at the old price
- price rises or falls
- movements along both curves
- the new equilibrium price and quantity.
When both curves shift
Sometimes demand and supply both change. Then one outcome is certain and the other depends on which shift is bigger.
For example, if demand and supply both increase, the quantity definitely rises, but the price could rise, fall, or stay the same, depending on which curve moved more. Saying "it depends on the relative size of the shifts" is the correct answer, not a dodge.
Consequences of price changes
This is the second half of the topic and often carries the most marks. Always think about three groups.
Consumers
- A higher price means a lower standard of living, because income buys less. It hurts most when the good is a necessity, since buyers cannot easily go without.
- A lower price means consumers can buy more, or have money left for other goods.
- The impact depends on price elasticity of demand (2.7): if demand is inelastic, consumers cannot avoid the higher price.
Producers
- A higher price usually means higher revenue and profit, so firms may expand and invest.
- A lower price squeezes profit margins; some firms may leave the market.
- Again elasticity matters: if demand is elastic, a higher price loses so many sales that revenue falls.
Workers
- If firms expand because prices and profits rise, they hire more workers, employment rises and wages may rise.
- If prices fall and firms contract, workers may lose their jobs.
- Because demand for labour is derived from demand for the product, changes in a product market pass through to the labour market.
Also worth mentioning where relevant: the government (tax revenue changes) and other countries (if the good is exported).
Worked example
New technology sharply reduces the cost of making solar panels.
- Lower production costs
- supply shifts right, from S1 to S2
- at the old price there is now excess supply
- firms cut prices to sell their output
- as the price falls, quantity demanded rises and quantity supplied falls along the curves
- the new equilibrium has a lower price and a higher quantity.
Consequences:
- Consumers gain: solar panels are cheaper and more households can afford them.
- Producers face a lower price per panel, but sell many more. Whether revenue rises depends on elasticity, for a good with elastic demand, the extra sales more than make up for the lower price.
- Workers in the solar industry benefit as firms expand and hire. But workers in competing industries, for example coal, may lose jobs as demand shifts away from them.
That last point, about a related market, is the kind of detail that lifts an answer.
Common exam mistakes
- Saying an increase in supply raises the price.
- Giving the new equilibrium without explaining the adjustment.
- Forgetting to mention quantity as well as price.
- Discussing only consumers, when the question asks about the effects on several groups.
- Ignoring elasticity when discussing what happens to producers' revenue.
- Claiming a definite outcome for both price and quantity when both curves shift.
Exam technique
Draw the diagram with axes labelled price and quantity, both curves labelled, and both equilibria marked with dotted lines.
Then write the chain in words. Examiners award marks for each link, so "supply shifts left, causing excess demand at the old price, so the price is bid up" scores better than "the price rises".
When the question asks about consequences, organise your answer by group, consumers, producers, workers, and use elasticity to judge how big each effect is.
Building an answer
4 marks, "Explain the effect of a fall in the price of a substitute on the market for tea."
If coffee becomes cheaper, some tea drinkers switch to coffee, so demand for tea falls at every price and the tea demand curve shifts left.
With supply unchanged, there is a surplus at the old price, so the price of tea falls and the quantity traded falls.
Two marks for the shift and its cause, two for the market outcome. Note that coffee's price change shifts tea's demand, the price of the good itself never shifts its own curve.
6 marks, "Analyse the effect on the market for petrol cars of a fall in the price of electric cars."
Electric cars are a substitute, so a lower price for them makes them relatively more attractive and demand for petrol cars shifts left.
At the existing price there is now excess supply of petrol cars, so price falls and quantity traded falls.
The size of the effect depends on cross elasticity of demand: the closer the substitutes, the larger the shift.
There is also a complement effect worth noting, falling demand for petrol cars reduces demand for petrol itself, which is a complementary good, so that market contracts too.
Substitutes and complements, and the direction each moves
| Change | Effect on the related good's demand | Direction of the shift |
|---|---|---|
| Price of a substitute falls | Demand for our good falls | Left |
| Price of a substitute rises | Demand for our good rises | Right |
| Price of a complement falls | Demand for our good rises | Right |
| Price of a complement rises | Demand for our good falls | Left |
The pattern to remember: substitutes move demand the same way as their own price; complements move it the opposite way.
A real case to quote
Streaming and cinema tickets. As subscription streaming became cheaper and more comprehensive, cinema admissions fell in many markets, a substitute becoming cheaper shifting demand left. At the same time, demand for large televisions and home sound systems rose, because those are complements to streaming. One price change, two markets moving in opposite directions.
Quick revision
- D right → P↑ Q↑. D left → P↓ Q↓. S right → P↓ Q↑. S left → P↑ Q↓.
- Explain the chain: cause → shift → excess demand/supply → price change → new equilibrium.
- Both curves shift → one outcome is uncertain; say which and why.
- Consumers: higher prices lower living standards, especially for necessities.
- Producers: revenue depends on elasticity, not just price.
- Workers: demand for labour is derived, so product prices affect jobs.
Check you have it
Question 1
The diagram shows the demand for and supply of plastic bags. The original equilibrium price is P.
How would the introduction of a unit tax on plastic bags be shown?
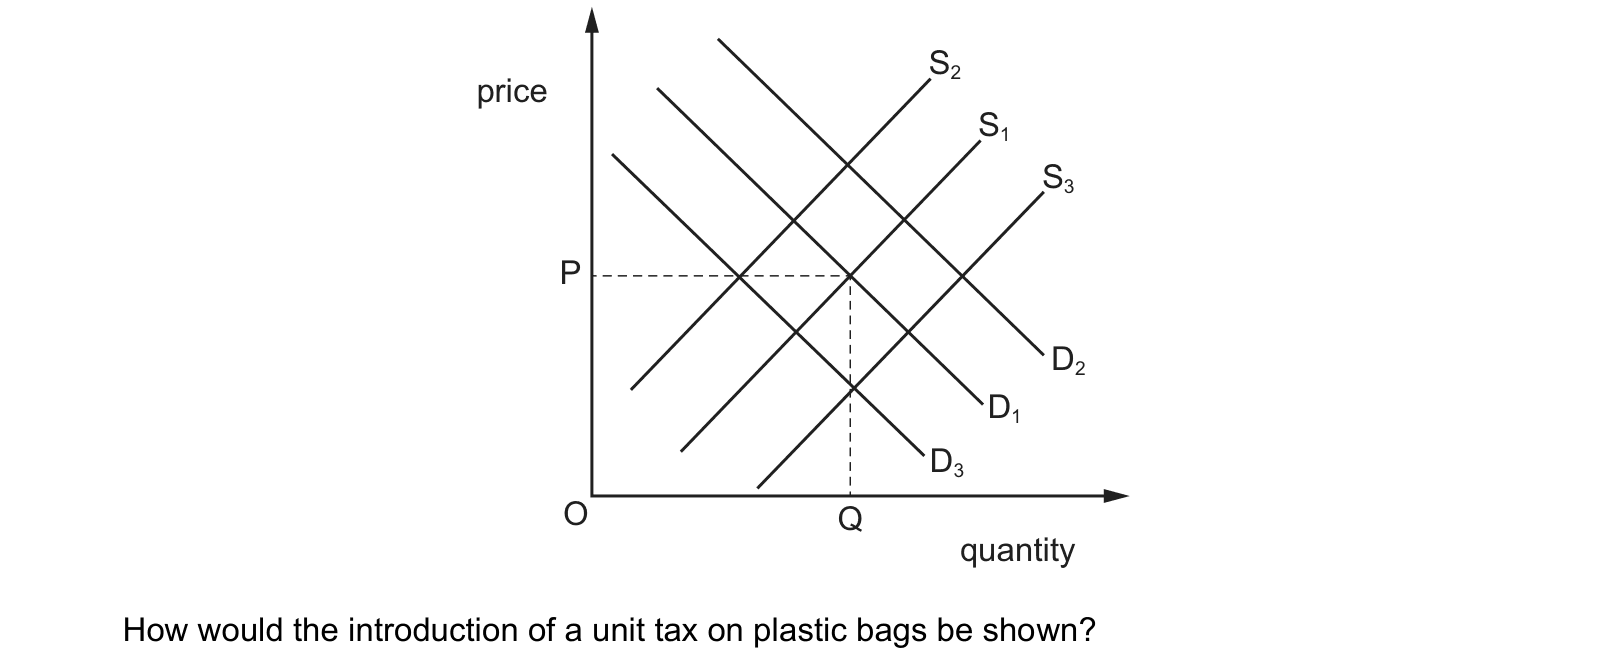
Answer: C.
A unit tax is charged on each plastic bag sold, so it adds a fixed amount to the cost of supplying every bag. Producers therefore require a higher price to offer any given quantity, and the supply curve shifts upwards and to the left. On this diagram that is the move from S1 to S2. The result is a higher price for consumers and a smaller quantity traded, which is exactly the intention of a tax on plastic bags.
Why the other options are wrong:
- A, demand shifting to D2, moves the demand curve to the right, showing consumers wanting more bags at each price. A tax does not increase demand.
- B, demand shifting to D3, moves demand left. A unit tax is levied on the seller and enters the analysis as a cost of production, so it acts on supply. The fall in the quantity bought comes from the higher price, not from a shift of the demand curve.
- D, supply shifting to S3, moves supply right, which lowers the price. That is what a subsidy does, and it is the opposite of a tax.
Question 2
The diagram shows the market for beef in the US with the original equilibrium at X. What will be the new equilibrium position if incomes in the US rise?
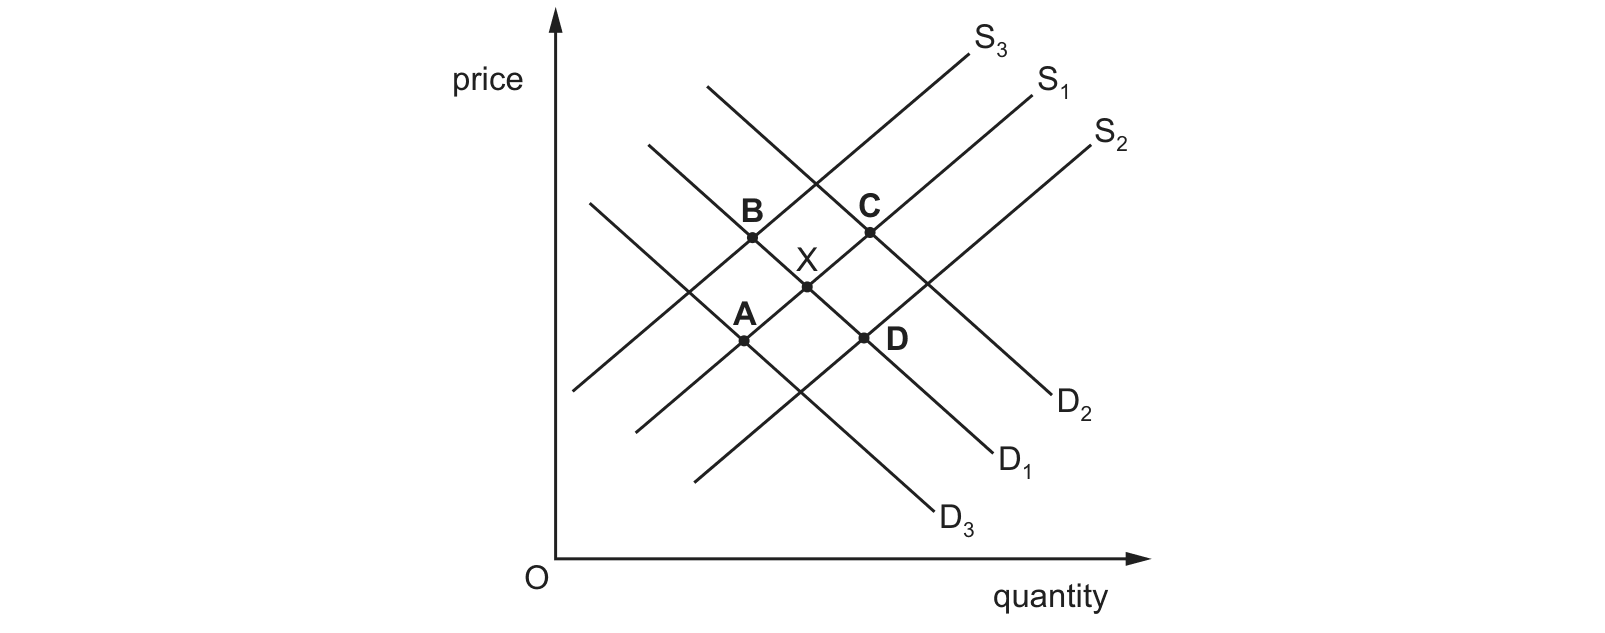
Answer: C.
Beef is a normal good, so when incomes in the US rise consumers wish to buy more of it at every price and the demand curve shifts to the right, from D1 to D2. Nothing in the stem affects the cost or the ease of producing beef, so supply stays on S1. The new equilibrium is where S1 crosses D2, which is point C: both the price and the quantity traded are higher than at X.
Why the other options are wrong:
- A lies where S1 crosses D3, the demand curve furthest to the left. That is a fall in demand, which is what would follow a fall in incomes, not a rise.
- B lies where D1 crosses S3, the supply curve furthest to the left. Supply has fallen with demand unchanged, which would follow higher production costs rather than higher incomes.
- D lies where D1 crosses S2, the supply curve furthest to the right. Supply has risen with demand unchanged, again a change on the producers' side of the market.
Question 3
In the diagram, suppliers have set the price of a product at P S. Economic theory predicts that the equilibrium price of the product will rise to P E.
What is the reason for this movement in price?

Answer: C.
At the price PS the quantity demanded exceeds the quantity supplied, so there is a shortage. In a shortage, buyers compete for the limited amount available, and because the demand curve slopes downwards there are consumers further up it who value the product enough to pay more than PS. Suppliers discover this and raise the price. The rise continues, choking off some quantity demanded and drawing out more quantity supplied, until the shortage disappears at PE. The mechanism at work is rationing by price.
Why the other options are wrong:
- A says demand will increase. The demand curve does not move at all here; the market simply travels up it as the price rises, which is a contraction in the quantity demanded rather than an increase in demand.
- B says no more of the product can be supplied. The supply curve slopes upwards, so more can be supplied, and that is precisely what the higher price brings about.
- D says suppliers face rising costs. Rising costs would shift the supply curve to the left and change the equilibrium itself, whereas PE is the equilibrium the existing curves already determine.
What the syllabus asks for on this topicSyllabus points
Syllabus points
- Analyse how shifts in demand and supply cause the equilibrium to change.
- Explain the consequences of price changes for consumers, producers and workers.
Related Cambridge IGCSE topics
Not the topic you were looking for? Describe what you are stuck on in your own words and we will take you to the notes that answer it.