Indifference Curves and Budget Lines: three questions to try now
Real past-paper questions, the answer key from the mark scheme, and the explanation that goes with it. No account needed to answer them.
Question 1
The graph shows the budget line for a household as used in indifference curve analysis. R S T O good Y good X What can be concluded about the amount of income that could be spent by the household?
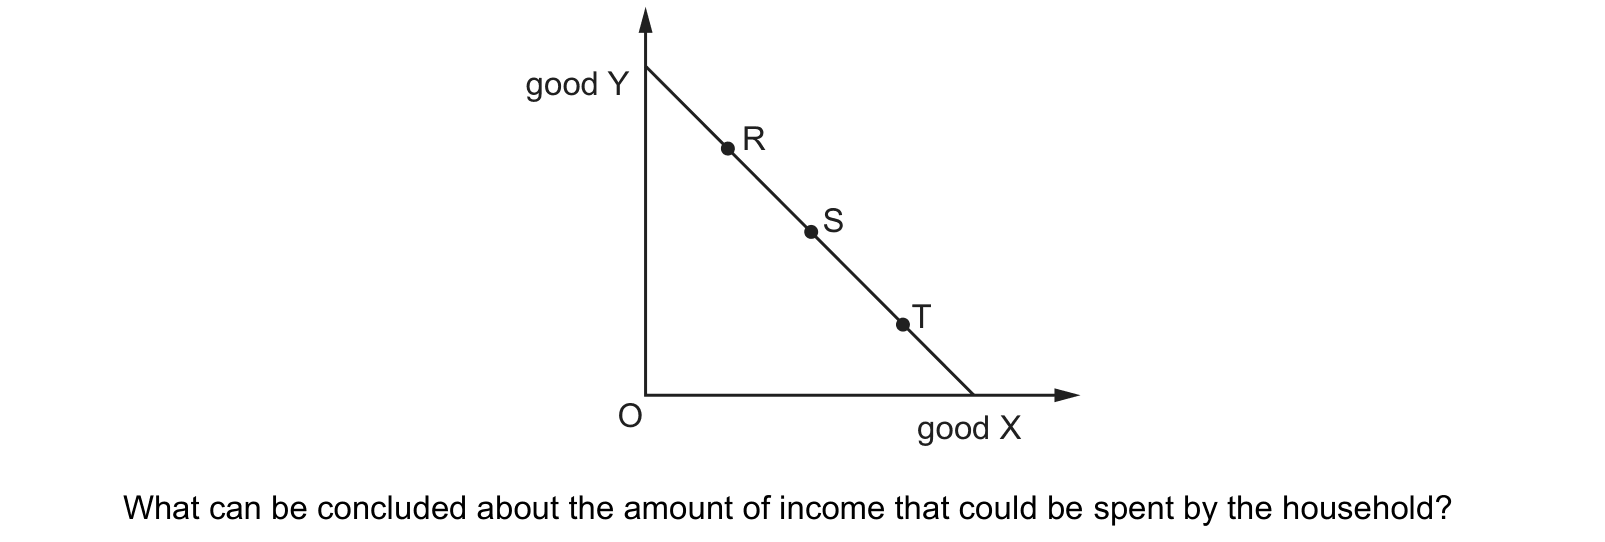
Answer: D.
Question 2
The diagram shows an individual’s indifference curve, I1, for apples and pears. 0 0 2 4 pears 19 12 apples X Y I1 What can be concluded from the movement from point X to point Y on this curve?
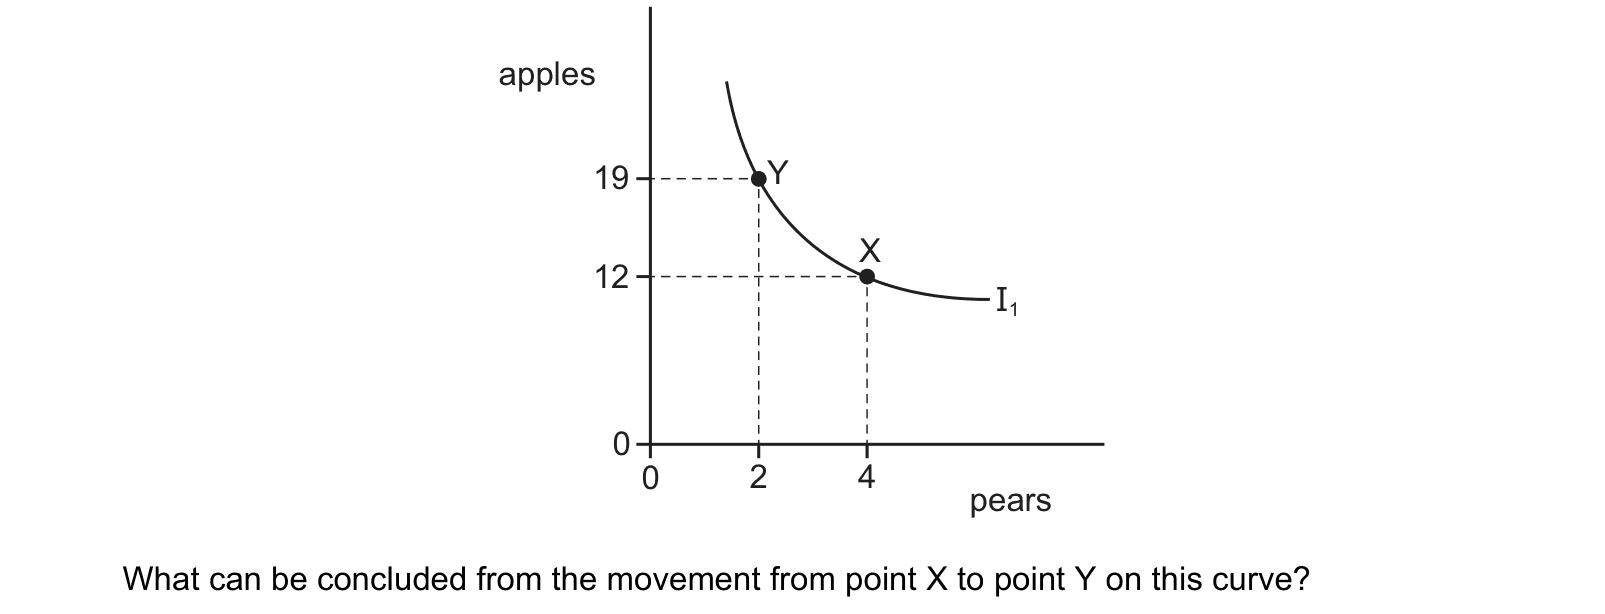
Answer: B.
The other options misread the diagram. Utility rises by moving to a HIGHER curve, not by sliding along one (D). Preference between the two goods (C) shows in the slope at a point rather than in the move itself. Affordability (A) depends on the budget line, which is not drawn here at all.
Question 3
To analyse a consumer’s preferences, an indifference curve represents possible combinations of goods X and Y.
The diagram shows a consumer’s indifference curve for good X and good Y. What can be concluded from the diagram?
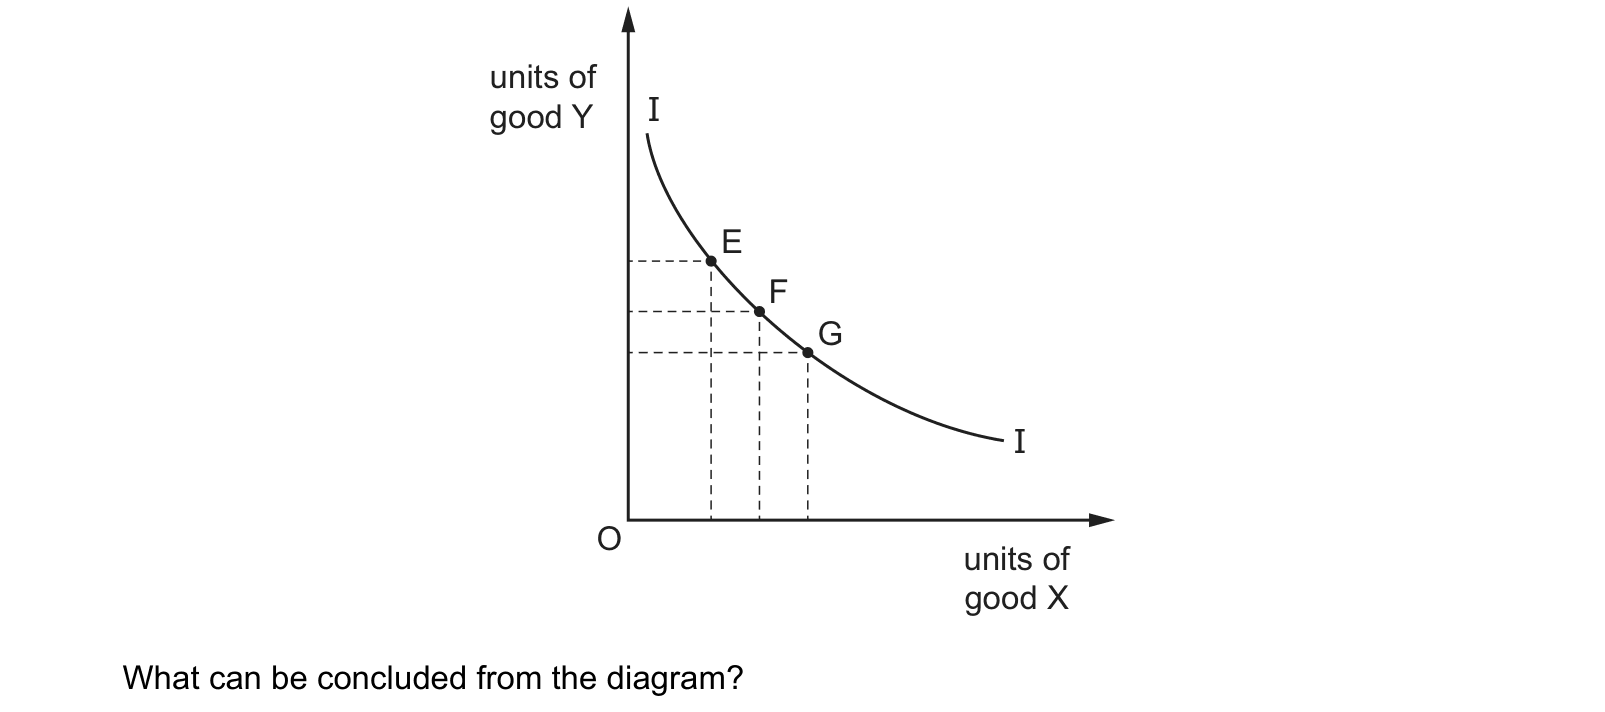
Answer: D.
What this practice covers
These questions are drawn from past CIE 9708 papers and filtered to indifference curves and budget lines. You answer, you find out immediately whether you were right, and you get the reasoning for the correct option and for each distractor. Wrong answers go to a mistakes locker so you can come back to exactly those.
Practice is free. You need an account only so your progress and your mistakes are still there next time.
What examiners see students get wrong here
These are the errors that cost marks on indifference curves and budget lines, taken from our own topic notes. Read them before you practise and you will recognise the traps in the questions.
- Drawing two indifference curves that cross. Crossing curves break transitivity, so the map is invalid.
- Treating the numbers on indifference curves as measured utility. The ranking is ordinal, so only the order matters.
- Putting the optimum where an indifference curve cuts the budget line. The consumer can always reach a higher curve, so the optimum is the tangency.
- Reading the budget line slope as a statement about preferences. It is the ratio of the two prices.
- Reading the slope of an indifference curve as prices. It is the marginal rate of substitution, which reflects preferences.
- Pivoting the budget line when income changes. A change in income shifts it parallel; only a price change pivots it.
- Changing both intercepts when only one price changes.
- Calling the whole price effect the substitution effect, when it is the substitution effect plus the income effect.
Revise it first
If any of the above is unfamiliar, work through the notes before practising: Indifference Curves and Budget Lines revision notes.