Financial Sector
Contents: 11 sections
Money
The three functions, and the exam does ask which one a given example illustrates:
- Medium of exchange: accepted in payment, so trade does not require a double coincidence of wants.
- Unit of account: a common measure prices are quoted in, making values comparable.
- Store of value: purchasing power can be held over time. Inflation erodes this function specifically, which is why high inflation drives people out of money and into real assets.
Commodity money has value in its own right (gold, cigarettes in a prison economy). Fiat money has value only because a government declares it legal tender and people accept it. Modern money is fiat.
Measures: M1 is currency in circulation, demand deposits and other checkable deposits. M2 is M1 plus savings deposits, small time deposits and retail money market funds. M1 is the more liquid, narrower measure; M2 is broader.
What is not money. A credit card is not money; it is a short-term loan that creates a liability, not an asset you hold. Stocks and bonds are not money either: they are financial assets that must be converted into money before they can be spent.
Money's liquidity is what distinguishes it from other assets. Bonds pay interest but must be sold to be spent; money can be spent immediately but pays none. That trade-off is exactly what the money demand curve captures.
Financial assets and bond prices
A bond is a loan to a government or firm: the holder receives fixed payments and the face value at maturity. A stock is a share of ownership in a firm, paying an uncertain return.
The examinable relationship is the inverse one between bond prices and interest rates:
When market interest rates rise, existing bonds paying the old, lower fixed payment become less attractive, so their price falls. When interest rates fall, existing bonds become more attractive and their price rises.
The logic is worth being able to state, because AP asks it both directions. A bond paying \$50 a year costs \$1,000 when the market rate is 5%. If the market rate rises to 10%, nobody will pay \$1,000 for a \$50 payment they could get from a new \$500 bond, so the old bond's price falls until its return matches the market. Bond prices and interest rates are two ways of saying the same thing.
This also explains why open market operations work: when the central bank buys bonds, it bids their price up, which is the same event as interest rates coming down.
Nominal and real interest rates
The distinction runs through the whole unit and into Unit 5:
Real interest rate ≈ nominal interest rate − inflation rate
equivalently, nominal ≈ real + expected inflation
The nominal rate is the stated, contracted rate. The real rate is what the lender actually earns in purchasing power, and it is the one that determines borrowing and investment decisions.
The distinction between expected and actual inflation is where the marks are:
- Loan contracts are written using expected inflation.
- If actual inflation turns out higher than expected, the real rate paid is lower than either party planned: borrowers gain and lenders lose.
- If actual inflation is lower than expected, the real rate is higher than planned: lenders gain and borrowers lose.
Unanticipated inflation therefore redistributes wealth from lenders to borrowers, a standard exam conclusion, and the reason fixed-rate debtors benefit from surprise inflation.
Fractional reserve banking
Banks hold a fraction of deposits as reserves and lend the rest. Lending puts new deposits into the system, which is how the banking system creates money.
Required reserves = deposits × required reserve ratio (rr)
Excess reserves = actual reserves − required reserves
Money multiplier = 1 ÷ rr
Maximum change in the money supply = excess reserves × money multiplier
Read the question carefully: a \$1,000 deposit with rr = 0.2 creates \$800 of excess reserves, so the money supply can expand by \$800 × 5 = \$4,000, and total money including the original deposit is \$5,000. Whether the answer wanted is \$4,000 or \$5,000 depends on the wording, and AP exploits that.
Where the expansion actually comes from. It is worth tracing the first rounds once, because the multiplier then stops being a formula to memorise:
| Round | Deposit | Held as reserves (20%) | Lent out |
|---|---|---|---|
| 1 | \$1,000 | \$200 | \$800 |
| 2 | \$800 | \$160 | \$640 |
| 3 | \$640 | \$128 | \$512 |
| … | … | … | … |
Each loan is spent and redeposited, becoming the next bank's deposit. The deposits sum to \$1,000 × (1 ÷ 0.2) = \$5,000, of which \$4,000 is newly created.
A simplified T-account:
| Assets | Liabilities |
|---|---|
| Required reserves | Demand deposits |
| Excess reserves | |
| Loans |
Assets and liabilities must balance. A new deposit adds to reserves on the asset side and to demand deposits on the liability side; making a loan converts excess reserves into loans, leaving the total unchanged.
The multiplier is a maximum, and two leakages reduce it in practice:
- Banks may hold excess reserves voluntarily rather than lending them, which is common in a recession when lending looks risky.
- The public may hold cash rather than redepositing, which removes funds from the banking system altogether.
The money market
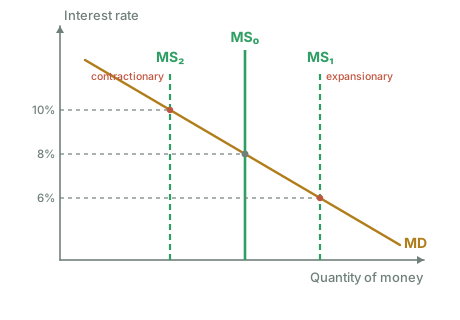
This is an AP-specific construction, and the details are point-scoring.
- Vertical axis: the NOMINAL interest rate. Horizontal axis: the quantity of money.
- Money supply (MS) is VERTICAL: set by the central bank, and independent of the interest rate.
- Money demand (MD) slopes downward, because the interest rate is the opportunity cost of holding money. When rates are high, holding non-interest-bearing money is expensive, so people hold less of it and more interest-bearing assets.
What shifts MD, anything that changes the quantity of money people want to hold at a given interest rate:
- The price level. Higher prices mean more money is needed for the same real transactions, so MD shifts right.
- Real GDP. More output means more transactions, so MD shifts right.
- Changes in transaction technology. Wider use of cards and instant transfer reduces the money needed, shifting MD left.
What shifts MS: central bank action, and nothing else. If a question has the central bank doing something; you are shifting supply.
Equilibrium sets the nominal interest rate where MD = MS. Above it, people hold more money than they want, buy bonds, bid bond prices up and rates down; below it, the reverse.
The loanable funds market
A separate market with a different axis, and confusing the two is the single most common error in this unit.
- Vertical axis: the REAL interest rate. Horizontal axis: the quantity of loanable funds.
- Supply of loanable funds = saving, sloping upward: a higher real return encourages more saving.
- Demand for loanable funds = borrowing for investment, sloping downward: a higher real cost makes fewer projects profitable.
Shifters of supply: private saving behaviour, foreign financial capital inflows, government budget surpluses (public saving).
Shifters of demand: business investment demand and expected profitability, and government borrowing to finance a deficit.
When the government runs a deficit, it borrows, demand for loanable funds shifts right, the real interest rate rises, and private investment falls. This is crowding out, and it is the standard link between Unit 4 and fiscal policy.
The international connection. A higher domestic real interest rate attracts financial capital from abroad. That inflow increases the supply of loanable funds, partly offsetting the rate rise, and at the same time raises demand for the domestic currency, appreciating it and reducing net exports. Unit 6 develops the currency side.
Keeping the two markets apart
| Money market | Loanable funds market | |
|---|---|---|
| Vertical axis | Nominal interest rate | Real interest rate |
| Horizontal axis | Quantity of money | Quantity of loanable funds |
| Supply | Vertical, set by the central bank | Upward-sloping, from saving |
| Demand | Holding money for transactions | Borrowing to invest |
| Shifted by government borrowing? | No | Yes: demand right |
| Shifted by central bank? | Yes: supply | Only indirectly |
The rule to carry into the exam: money market → nominal rate; loanable funds → real rate.
Monetary policy
| Tool | Expansionary | Contractionary |
|---|---|---|
| Open market operations | Buy bonds | Sell bonds |
| Reserve requirement | Lower | Raise |
| Discount rate | Lower | Raise |
Open market operations are the primary tool. A useful mnemonic: Buy bonds → Bigger money supply.
The reserve requirement is the bluntest tool and is rarely altered in practice, a small change in it moves the money multiplier sharply. Modern central banks steer the policy rate mainly by paying interest on the reserves banks hold, which sets a floor under the rate at which banks are willing to lend to each other. The money multiplier model remains the one AP examines for money creation, but it is worth knowing that changing reserve requirements is not how policy is conducted day to day.
The transmission mechanism, which FRQs ask you to trace link by link:
- The central bank buys bonds
- bond prices rise
- bank reserves rise
- the money supply increases
- MS shifts right
- the nominal interest rate falls
- borrowing is cheaper
- investment and interest-sensitive consumption rise
- AD shifts right
- real output and employment rise, with upward pressure on the price level depending on the output gap.
There is also an exchange-rate channel: a lower domestic interest rate reduces financial capital inflows → the currency depreciates → exports become cheaper and imports dearer → net exports rise → AD rises further. AP expects this channel in open-economy questions.
Contractionary policy runs every link in reverse: sell bonds → reserves fall → MS shifts left → the nominal rate rises → investment falls → AD shifts left.
What limits monetary policy
Evaluation marks live here:
- Interest-inelastic investment. In a deep recession, firms may not invest however cheap borrowing becomes, because they expect no demand for the output. The rate falls and little happens.
- Banks may not lend. If banks hold the new reserves as excess reserves, the money supply expands by far less than the multiplier suggests.
- The zero lower bound. Nominal rates cannot fall far below zero, so once rates are near zero there is little room left to cut.
- Long-run limits. In the long run, money is neutral: the expansion raises the price level and leaves real output at Yf. Monetary policy manages the short run; it does not raise potential output.
Its advantage over fiscal policy is speed: a central bank committee can act quickly and reverse itself, whereas fiscal policy carries a long decision lag.
Worked example
The required reserve ratio is 0.10, and the central bank buys \$1 million of bonds from commercial banks.
Money multiplier = 1 ÷ 0.10 = 10
The purchase adds \$1m directly to reserves, all of it excess → maximum money supply expansion = \$1m × 10 = \$10 million
Then the transmission:
- MS shifts right
- the nominal interest rate falls
- investment rises
- AD shifts right by the spending multiplier times the change in investment
- real GDP and employment rise.
Note carefully that two different multipliers appear in this chain. The money multiplier turns reserves into money supply. The spending multiplier turns the resulting change in investment into a change in AD. Using one where the other belongs is a frequent and expensive error.
The qualifications that earn evaluation points. If banks hold excess reserves rather than lending, the expansion is smaller. If investment demand is interest-inelastic, as in a deep recession when confidence is low, the fall in rates produces little extra investment. And if the economy is already at Yf, the effect is mostly on the price level rather than output.
Second worked example: real returns
A saver is offered a nominal interest rate of 6% and expects inflation of 2%.
Expected real interest rate = 6% − 2% = 4%
Inflation then turns out to be 5%.
Actual real interest rate = 6% − 5% = 1%
The saver expected to gain 4% in purchasing power and gained 1%. The borrower expected to pay 4% and paid 1%. Unanticipated inflation transferred wealth from the lender to the borrower, and neither party's contract changed, only the price level did.
Common exam mistakes
- Drawing the money supply curve as upward-sloping. It is vertical.
- Putting the real rate on the money market axis, or the nominal rate on loanable funds.
- Using the money multiplier when the question asks for the spending multiplier.
- Applying the multiplier to the whole deposit rather than to excess reserves.
- Getting open market operations backwards, buying bonds is expansionary.
- Forgetting that the multiplier is a maximum, and that leakages reduce it.
- Shifting money demand when the central bank acts; the bank shifts supply.
- Saying bond prices and interest rates move together. They move inversely.
- Treating a credit card as money.
- Forgetting that it is expected inflation in the contract but actual inflation that decides who gains.
Exam technique
Label the money market axes Nominal Interest Rate and Quantity of Money, and draw MS vertical. Label the loanable funds axes Real Interest Rate and Quantity of Loanable Funds. Getting either label wrong usually costs the whole graph, because the examiner cannot tell which market you have drawn.
Many FRQs chain three graphs, money market → AD/AS → loanable funds. Draw them in that order and carry the change through explicitly, stating the direction of each shift and the reason for it. The rubric almost always awards the shift and the consequence as separate points.
Show reserve calculations step by step: required reserves, then excess reserves, then the multiplier, then the expansion. A single final number with no working scores badly even when it is correct, and working lets you keep marks when one step slips.
When a question mentions the central bank and the government, slow down and identify which market each acts on. The central bank shifts money supply; the government shifts loanable funds demand.
Quick revision
- Money's functions: medium of exchange, unit of account, store of value. Inflation attacks the third.
- M1 = currency + checkable deposits; M2 = M1 + savings and near-money. Credit cards are not money.
- Bond prices and interest rates move inversely.
- Real ≈ nominal − inflation. Unanticipated inflation helps borrowers, hurts lenders.
- Money multiplier = 1 ÷ rr, applied to excess reserves, and it is a maximum.
- Money market: nominal rate, vertical MS, MD down because interest is the opportunity cost of holding money.
- MD shifts with the price level and real GDP; MS shifts only with the central bank.
- Loanable funds: real rate, supply = saving, demand = investment plus government borrowing.
- Government deficits → LF demand right → real rate up → crowding out.
- Buy bonds → bigger money supply → lower nominal rate → investment up → AD right.
- Lower rates also depreciate the currency → net exports rise.
- Monetary policy is fast but limited by interest-inelastic investment, bank behaviour and the zero lower bound.
Check you have it
Cross-board concept practice · originally a CIE 9708 question, used here because the concept is the same. It is not AP Economics past-paper material.
Question 1
In which context relevant to growth in the money supply is the term total currency flow used?
Answer: C.
What the syllabus asks for on this topicWhat this unit covers
What this unit covers
- Money: its functions, the forms it takes, and how it is measured.
- Financial assets, and why bond prices move inversely to interest rates.
- Nominal and real interest rates, and the relationship between them.
- Fractional reserve banking and the money multiplier.
- The money market and the nominal interest rate.
- The loanable funds market and the real interest rate.
- Monetary policy tools and the transmission mechanism.
This unit is 18–23% of the multiple-choice section, and it carries an unusually high density of diagram and calculation marks. Two graphs dominate it, the money market and the loanable funds market, and they are the two students most often merge into one. Keeping them apart is most of the work.
Related AP Economics topics
Not the topic you were looking for? Describe what you are stuck on in your own words and we will take you to the notes that answer it.