Market Failure and the Role of Government
Contents: 10 sections
Efficient and inefficient outcomes
The benchmark this unit measures everything against comes from Unit 3: a competitive market with no externalities maximises total surplus, producing where P = MC. That is allocative efficiency, the last unit produced is worth exactly what it cost to make.
Market failure is any situation where a free market fails to reach that outcome. This unit covers four sources: externalities, public goods, common resources, and market power. In each case the diagnosis is the same shape, identify the quantity the market produces, identify the socially optimal quantity, and the gap between them generates deadweight loss.
Externalities
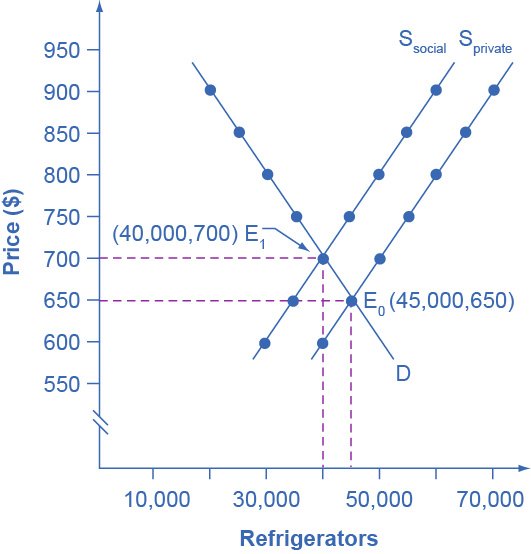
An externality is a cost or benefit falling on someone outside the transaction. Because the market responds only to private costs and benefits, it produces the wrong quantity.
The whole topic rests on one gap:
- Negative externality: MSC > MPC
- the market over-produces.
- Positive externality: MSB > MPB
- the market under-produces.
The socially optimal quantity is where MSB = MSC. The market equilibrium is where MPB = MPC. The distance between them is what generates deadweight loss.
Say it in words as well as shading it:
Every unit produced beyond the socially optimal quantity costs society more than it is worth to the buyer. Those units make society worse off, and the accumulated loss is the triangle.
Which curve splits depends on where the externality arises:
| Case | Curve that splits | Market outcome |
|---|---|---|
| Negative production externality (pollution) | MSC above MPC | Over-production |
| Positive production externality | MSC below MPC | Under-production |
| Negative consumption externality (smoking) | MSB below MPB | Over-consumption |
| Positive consumption externality (vaccination) | MSB above MPB | Under-consumption |
Check whether the third-party effect comes from making the good or from using it. That decides which curve moves.
Corrective policy
- Per-unit (Pigouvian) tax for a negative externality, set equal to the marginal external cost at the socially optimal quantity. Not "a tax", the exact size is the point.
- Per-unit subsidy for a positive externality, equal to the marginal external benefit at the optimum.
- Tradable permits, which cap total pollution and let firms trade the right to emit, achieving the reduction at least cost, firms that can cut cheaply do so and sell their permits to firms that cannot.
- Regulation: standards and limits, blunter but enforceable where measurement is hard.
The Coase theorem is AP-specific and worth knowing: where property rights are clearly defined and transaction costs are low, the parties can bargain to the efficient outcome without government intervention, and the efficient quantity is the same regardless of who initially holds the right. Only the distribution of the gains changes. In practice, high transaction costs and many affected parties limit its applicability.
Public goods
A public good is both:
- Non-rival: one person's consumption does not reduce what is available to others.
- Non-excludable: non-payers cannot be prevented from consuming.
Both conditions are required. "Public good" describes the good's characteristics, not who supplies it: public schools are rival and excludable, so they are not public goods.
The free-rider problem: because non-payers cannot be excluded, each person waits for others to pay. No revenue is collected, so no private firm supplies it, the market produces zero, not merely too little. That is a complete market failure, and the standard response is government provision funded from taxation, which makes contribution compulsory.
The difficulty is knowing how much to provide: with no market price, there is no signal of how much society values the good, so the quantity must be estimated through cost–benefit analysis.
The classification grid
| Excludable | Non-excludable | |
|---|---|---|
| Rival | Private good | Common resource |
| Non-rival | Club good | Public good |
Common resources are rival but non-excludable, fisheries, groundwater, clean air. Because access is free, each user ignores the cost their use imposes on everyone else, so the resource is over-used: the tragedy of the commons.
Note the failures run in opposite directions. Public goods are under-provided because nobody will pay; common resources are over-used because everybody can take. Confusing the two is the most damaging error in this unit.
The link to externalities is worth making explicit: a common resource is over-used because each user's consumption imposes a negative externality on every other user. It is the same failure in a different setting, which is why the remedy is the same in spirit, make the user face the full social cost.
The standard remedy is to establish property rights, individual transferable quotas, licences, or ownership, so the user bears the cost of depletion.
Government intervention across market structures
The effect of an intervention depends on the market it lands in, and AP tests this by moving the same policy between structures.
Price ceilings. In a competitive market, a binding ceiling below equilibrium creates a shortage and deadweight loss. In a monopoly, a ceiling set at the socially optimal price, where demand crosses MC, can raise output to the efficient level and reduce deadweight loss, because it removes the monopolist's ability to restrict quantity to raise price. The same policy is harmful in one structure and corrective in the other.
Minimum wages. Exactly the same reversal appears in factor markets, covered in Unit 5: harmful in a competitive labour market, potentially raising both wages and employment under monopsony.
Antitrust policy targets market power directly, blocking mergers that would concentrate a market, and prohibiting collusion and price-fixing among oligopolists. The economic justification is the deadweight loss from P > MC established in Unit 4.
Lump-sum versus per-unit taxes on a firm behave differently, and the reason returns to Unit 3. A per-unit tax raises marginal cost, so it changes the profit-maximising quantity. A lump-sum tax is a fixed cost: it raises ATC, reduces profit, and leaves MC, and therefore output and price, completely unchanged.
The general lesson to carry into evaluation: intervention corrects a failure only when it is aimed at the actual source of that failure. Identify the failure first, then judge the policy.
Income inequality
Measurement:
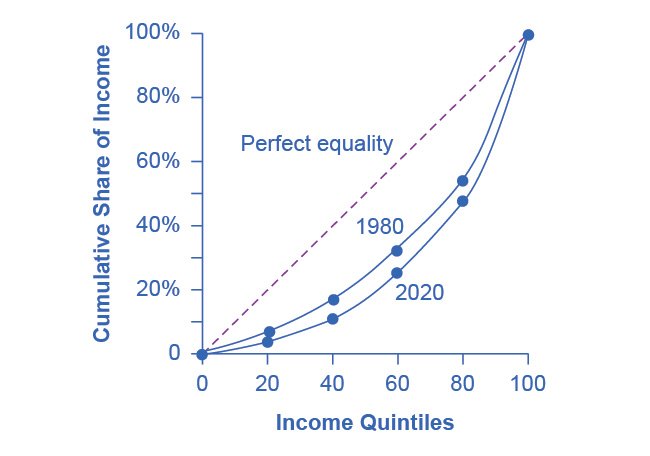
- The Lorenz curve plots cumulative percentage of income against cumulative percentage of households, ranked poorest to richest. The 45° line is perfect equality; the further the curve bows away, the greater the inequality.
- The Gini coefficient is the area between the 45° line and the Lorenz curve, divided by the total area under the 45° line. It runs from 0 (perfect equality) to 1 (perfect inequality).
Reading the curve is a common exam task. A point on the curve at (40, 15) means the poorest 40% of households receive 15% of total income. Always cumulative, always poorest-first. Two Lorenz curves that cross cannot be ranked unambiguously, which is one of the measure's real limitations.
Sources: differences in human capital, inherited wealth, discrimination, unequal access to education, and returns to capital exceeding wage growth.
Redistribution:
- Progressive tax: the average rate rises with income.
- Proportional tax: the average rate is constant.
- Regressive tax: the average rate falls as income rises. Sales and excise taxes are regressive, because lower-income households spend a larger share of income.
- Transfer payments and in-kind benefits.
Note that regressivity is about the average rate relative to income, not the amount paid. A flat 10% sales tax takes the same proportion of spending from everyone, but because poorer households spend a larger share of their income, it takes a larger share of their income, which is what makes it regressive.
The recurring trade-off is equity against efficiency: redistribution may weaken incentives to work, save and invest. But note that spending on education improves both, so the trade-off is not universal, a point worth making whenever a question invites a blanket claim.
Worked example
Producing a chemical generates pollution valued at \$4 per unit of external cost. The market equilibrium is 1,000 units; the socially optimal quantity is 800.
- The firm faces only private cost
- MSC lies \$4 above MPC
- the market produces where MPC = MPB, at 1,000
- but at every unit between 800 and 1,000 the social cost exceeds the social benefit
- deadweight loss = ½ × \$4 × (1,000 − 800) = \$400.
The corrective policy is a per-unit tax of \$4, the marginal external cost at the optimum, which raises the firm's private cost to the social cost and cuts output to 800, eliminating the deadweight loss.
Evaluation. The tax must be measured accurately, which requires valuing health and environmental damage. If demand is inelastic, output falls less than intended. And the burden falls partly on consumers as a higher price, which is regressive if the good is a necessity.
Second worked example: a positive externality
Vaccination generates an external benefit of \$6 per dose, because a vaccinated person reduces others' risk of infection. The market provides 500 doses; the socially optimal quantity is 700.
- Buyers weigh only their private benefit
- MSB lies \$6 above MPB
- the market settles at 500, where MPB = MPC
- but every dose between 500 and 700 is worth more to society than it costs
- deadweight loss = ½ × \$6 × (700 − 500) = \$600.
The corrective policy is a per-unit subsidy of \$6, which lowers the price buyers pay until they choose the socially optimal 700 doses.
Note the two differences from the negative case, which is where marks are won and lost: the failure is under-provision rather than over-provision, and the deadweight loss triangle sits to the right of the market quantity rather than the left. The arithmetic is identical; the direction is reversed.
Common exam mistakes
- Shifting the wrong curve. Check whether the externality arises in production or consumption.
- Marking only one quantity. Both the market quantity and the socially optimal quantity must appear.
- Recommending "a tax" without stating that it equals the marginal external cost at the optimum.
- Putting the deadweight loss triangle on the wrong side of the market quantity in a positive-externality question.
- Calling a common resource a public good. Common resources are rival.
- Saying the market under-provides a public good when it provides none.
- Assuming a price ceiling is always harmful, in a monopoly it can raise output.
- Letting a lump-sum tax change the firm's output. It shifts ATC, not MC.
- Reading the Gini backwards, higher means more unequal.
- Confusing progressive with proportional taxation, or judging regressivity by the amount paid rather than the share of income.
Exam technique
Draw MSB and MSC explicitly, label both quantities (market and socially optimal), and shade the deadweight loss triangle between them. Every one of those is a separate point.
State the size of the corrective tax or subsidy, not just its direction. "A tax equal to the marginal external cost of \$4 at the optimal quantity" is a complete answer; "tax the firm" is not.
For public goods, apply both characteristics to the specific good in the question rather than reciting the definition, that application is what earns the mark.
When a question puts a familiar policy into an unfamiliar market structure, treat that as the point of the question. Identify the structure first, then reason from its diagram, rather than importing the competitive-market conclusion.
Quick revision
- Negative externality → over-production; positive → under-production.
- Socially optimal quantity is where MSB = MSC.
- Optimal tax or subsidy = the marginal external cost or benefit at the optimum.
- Coase: with clear property rights and low transaction costs, bargaining reaches efficiency without government.
- Public good = non-rival and non-excludable → free riding → the market supplies zero.
- Common resource = rival and non-excludable → over-use → assign property rights.
- A price ceiling harms a competitive market but can correct a monopoly.
- Per-unit taxes change output; lump-sum taxes do not.
- Lorenz curve bows from the 45° line; Gini runs 0 to 1, higher = more unequal.
- Progressive: average rate rises. Regressive: average rate falls, sales taxes are regressive.
Check you have it
Cross-board concept practice · originally a CIE 9708 question, used here because the concept is the same. It is not AP Economics past-paper material.
Question 1
Which government policy is intended to correct ‘market failure’?
Answer: B.
Correct Answer: B
Explanation: Market failure occurs when the free market does not allocate resources efficiently, leading to a misallocation of resources. In the case of factories releasing pollutants into rivers, the cost of pollution is not borne by the factory, resulting in negative externalities (such as polluted waterways) that are not accounted for in the market price. By imposing taxes on these factories for their pollution, the government aims to internalise the external costs and correct the market failure by making them accountable for the harm caused. This policy helps ensure that the true cost of production, including environmental impact, is reflected in the market price, encouraging factories to reduce pollution and allocate resources more efficiently.
Cross-board concept practice · originally a IGCSE Economics question, used here because the concept is the same. It is not AP Economics past-paper material.
Question 2
To reduce traffic congestion, a government decides to build a new road. There is a toll charge on
the new road.
What is the main purpose of this government intervention?
Answer: A.
Cross-board concept practice · originally a CIE 9708 question, used here because the concept is the same. It is not AP Economics past-paper material.
Question 3
Which policy is not designed to correct a market failure?
Answer: D.
What the syllabus asks for on this topicWhat this unit covers
What this unit covers
- Efficient and inefficient market outcomes.
- Externalities and the socially optimal quantity.
- Public goods and the free-rider problem.
- Common resources and the tragedy of the commons.
- Government intervention across different market structures.
- Income inequality, its measurement and redistribution.
Related AP Economics topics
Not the topic you were looking for? Describe what you are stuck on in your own words and we will take you to the notes that answer it.