Aggregate Demand
Contents: 10 sections
Aggregate demand
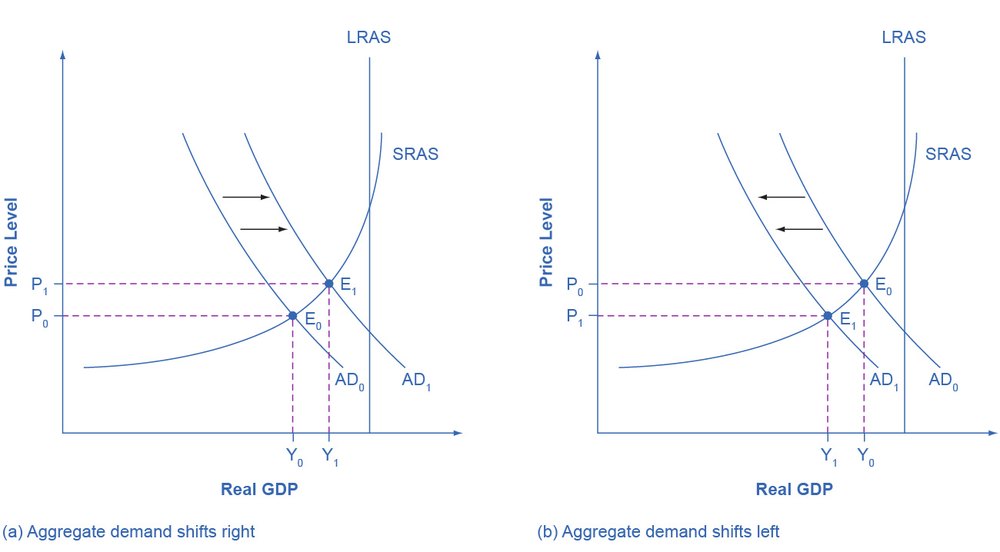
Aggregate demand is total planned expenditure on an economy's output at each price level.
AD = C + I + G + (X − M)
Typical UK shares: consumption around 60%, investment 15–18%, government spending around 20%, and net exports usually slightly negative. Because consumption dominates, anything that moves consumer confidence moves AD.
Why AD slopes downwards, three effects Edexcel expects named:
- The wealth (real balance) effect: a lower price level raises the real value of money holdings, so spending rises.
- The interest rate effect: a lower price level reduces the demand for money, lowering interest rates and stimulating C and I.
- The trade (international substitution) effect: a lower domestic price level makes exports more competitive and imports dearer, raising net exports.
A change in the price level causes a movement along AD; a change in anything else shifts it.
Consumption
Determinants:
- Real disposable income: the dominant influence.
- Interest rates: higher rates raise the return to saving, the cost of borrowing, and mortgage payments.
- Consumer confidence: expectations of future income and job security.
- Wealth effects: house and share prices.
- Availability of credit.
- Taxation: income tax changes disposable income directly.
- The distribution of income: poorer households have a higher MPC, so redistribution towards them raises consumption.
The marginal propensity to consume (MPC) is the fraction of each extra pound that is spent. It is higher at lower incomes, which is why targeted transfers deliver more demand per pound than tax cuts for high earners.
The savings ratio is the counterpart: it rises in recessions as households build precautionary balances, which is one reason recessions are self-reinforcing.
Investment
Investment is firms' spending on capital goods, and it is the most volatile component of AD, which is why it drives the economic cycle.
Determinants:
- Interest rates: the cost of borrowing and the opportunity cost of using retained profit.
- Business confidence: Keynes's "animal spirits"; expectations of future demand.
- Retained profit, the main source of investment finance.
- Technological change, creating new opportunities.
- Corporation tax and investment allowances.
- Spare capacity: firms already below capacity have no reason to invest.
- Government regulation and the general business environment.
The accelerator states that investment depends on the rate of change of national income, not its level, so a mere slowdown in demand growth can cause investment to fall absolutely, amplifying the cycle.
Government spending and net exports
G is determined by policy priorities, the stage of the cycle (automatic stabilisers raise benefit spending in a recession), and political choices about the size of the state.
Net exports depend on: the exchange rate; relative inflation rates and international competitiveness; productivity and non-price competitiveness; incomes abroad (export demand) and incomes at home (import demand); and protectionism.
The multiplier
The multiplier is the process by which an initial injection leads to a larger eventual increase in national income, because one person's spending is another's income.
- An injection of £100m
- recipients spend a fraction
- that becomes income for others
- who spend a fraction again
- each round is smaller
- the total increase exceeds the original injection.
Calculating it:
k = 1 ÷ (1 − MPC) = 1 ÷ MPW, where MPW = MPS + MPT + MPM
Worked arithmetic: MPC = 0.8 → MPW = 0.2 → k = 5. An injection of £100m raises national income by £500m.
The multiplier is larger when leakages are small, a low propensity to save, low tax rates, a low propensity to import, and, critically, when there is spare capacity, so extra demand raises output rather than prices.
It works in reverse. A withdrawal, such as a spending cut, causes a larger fall in national income, the core argument against sharp fiscal contraction in a recession.
Worked example
A government increases infrastructure spending by £10bn. The economy has a negative output gap; MPS = 0.1, MPT = 0.2, MPM = 0.1.
- MPW = 0.4
- k = 1 ÷ 0.4 = 2.5
- national income rises by £25bn.
- The government pays construction firms
- they hire workers and buy materials
- those workers spend 60p of each extra pound domestically
- that becomes income for retailers and suppliers
- who spend again
- the increments sum to £25bn.
On the diagram, AD shifts right by £25bn, not £10bn. With spare capacity, real output rises substantially and the price level rises only modestly.
Evaluation.
- The multiplier is smaller in practice than the formula suggests, because it assumes stable propensities. In an open economy like the UK, a high MPM makes it modest.
- With little spare capacity, the extra demand raises the price level rather than real output, and the real multiplier approaches zero.
- Crowding out: government borrowing may raise interest rates, reducing private investment. Much weaker when rates are at their floor and private demand is depressed.
- Time lags: recognition, decision, implementation and impact, mean the stimulus may arrive after recovery has begun.
- The accelerator may reinforce it: rising demand encourages firms to invest, adding a second injection.
- Financing matters: a spending rise funded by higher taxation has a much smaller net effect.
Judgement: the multiplier makes fiscal stimulus more powerful than its headline cost, but only where spare capacity exists and leakages are limited. The same logic makes fiscal contraction in a recession more damaging than its headline saving.
Common exam mistakes
- Forgetting that imports are subtracted in AD.
- Confusing a movement along AD with a shift.
- Using 1 ÷ MPS where the economy has taxes and imports; it must be 1 ÷ MPW.
- Shifting AD by the initial injection rather than the multiplied amount.
- Ignoring spare capacity, which determines the real effect entirely.
- Treating investment as stable; it is the most volatile component.
- Confusing the multiplier with the accelerator.
Exam technique
Show the multiplier calculation whenever the data allows. State MPW, compute k, apply it. That is often several KAA marks on its own.
Shift AD by the multiplied amount on the diagram and comment on how the split between output and prices depends on the slope of AS at that point.
For evaluation, the reliable angles are the size of the output gap, leakages (especially MPM), crowding out, and time lags.
Quick revision
- AD = C + I + G + (X − M); C is roughly 60%.
- AD slopes down via the wealth, interest rate and trade effects.
- Consumption: real disposable income, interest rates, confidence, wealth, credit, tax, income distribution.
- Investment is the most volatile; the accelerator links it to the rate of change of income.
- k = 1 ÷ (1 − MPC) = 1 ÷ MPW; MPW = MPS + MPT + MPM.
- MPC = 0.8 → k = 5.
- Bigger multiplier with small leakages and spare capacity; it works in reverse.
- Limits: crowding out, time lags, high MPM, no spare capacity.
Check you have it
Question 1
Which one of the following would be most likely to cause aggregate demand to increase? A fall in:
Answer: D.
What the syllabus asks for on this topicSpecification points
Specification points
- The components of aggregate demand (AD) and the aggregate demand curve (AD curve).
- The factors that shift AD.
- The multiplier process.
Related Edexcel A-Level topics
Not the topic you were looking for? Describe what you are stuck on in your own words and we will take you to the notes that answer it.