Economic Growth
Contents: 10 sections
Actual and potential growth
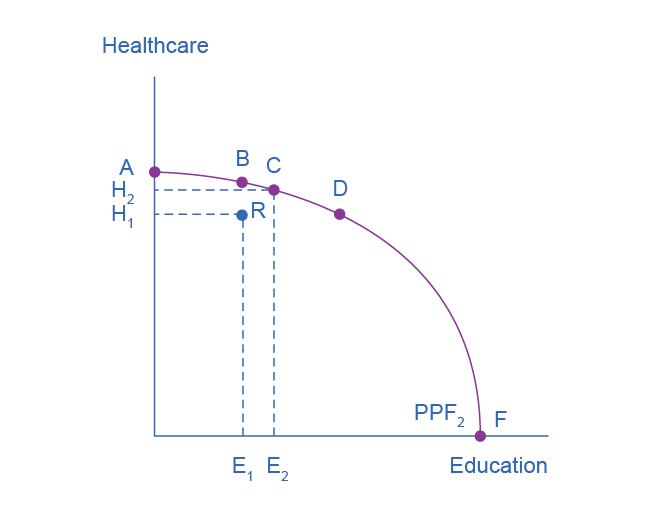
The whole distinction is visible on one diagram. A point inside the frontier means idle resources, so moving towards the curve raises output without any new capacity, actual growth. Shifting the whole frontier outward is potential growth. Drawing the first when the question asks for the second is the most common error in this topic.
Two distinctions Edexcel tests directly:
- Actual growth: an increase in real GDP, moving the economy towards or along the PPF. It can be achieved by raising AD when spare capacity exists.
- Potential growth: an increase in the economy's productive capacity, shifting the PPF and LRAS outward. It requires more or better factors of production.
Only potential growth is sustainable indefinitely. Actual growth beyond capacity produces inflation, not lasting output.
Causes of actual growth: anything that raises AD, rising consumer confidence and consumption, an investment boom, higher government spending, a depreciation raising net exports, or looser monetary policy.
Causes of potential growth: investment in physical capital and infrastructure; technological progress; growth in the size and skills of the labour force, including net migration; the discovery of natural resources; improved institutions and competition; and rising productivity, the single most important long-run driver.
Export-led growth is worth naming separately: growth driven by rising net exports rather than domestic demand, which avoids the current account deterioration that usually accompanies consumption-led growth.
The output gap
The output gap is the difference between actual and potential output.
- Negative output gap: actual output below potential. Spare capacity, unemployment above the natural rate, downward pressure on inflation.
- Positive output gap: actual output above potential. Labour and material shortages, demand-pull inflationary pressure, unemployment below the natural rate.
The output gap is the key diagnostic for policy: a negative gap calls for demand stimulus, a positive gap for restraint. Its practical weakness is that potential output cannot be observed; it is estimated, and estimates are revised substantially after the event. That is a strong evaluation point against fine-tuning, and Edexcel rewards it.
Working the numbers
Edexcel sets growth as a calculation, and the arithmetic decides the answer.
Real growth from nominal. Nominal GDP rises from £2,100bn to £2,205bn while the GDP deflator rises from 100 to 103.
Real GDP now = (2,205 ÷ 103) × 100 = £2,140.8bn
Real growth = (2,140.8 − 2,100) ÷ 2,100 × 100 = 1.9%
Nominal GDP grew 5%; real GDP grew 1.9%. Most of the headline was price, not output, which is why quoting nominal growth as growth loses the mark outright.
Then per capita. If population grew 0.7%:
Real GDP per capita growth ≈ 1.9% − 0.7% = 1.2%
The average person is better off, but by well under half the headline figure. Where population grows faster than real GDP, output per person falls even as the economy expands.
And the output gap. If potential output is £2,180bn while actual is £2,140.8bn:
Output gap = (2,140.8 − 2,180) ÷ 2,180 × 100 = −1.8%
A negative gap of about 1.8%, spare capacity, so demand stimulus would raise output rather than prices. That single figure is what turns a description into a policy recommendation.
The economic cycle
The economic (business) cycle is the fluctuation of actual output around the underlying trend.
| Phase | Characteristics |
|---|---|
| Boom | Output above trend, low unemployment, rising inflation, high confidence, current account deteriorating, positive output gap |
| Downturn / slowdown | Growth slowing, confidence falling, investment postponed |
| Recession | Two consecutive quarters of negative real GDP growth; rising unemployment, falling inflation, spare capacity |
| Recovery | Growth resuming, unemployment falling, confidence returning |
Causes: swings in confidence ("animal spirits") driving C and I; the multiplier and accelerator interacting; credit cycles, where easy lending fuels a boom and its reversal deepens the bust; external shocks such as energy prices or a pandemic; and policy errors.
Benefits of growth
- Higher incomes and living standards, and more goods and services per person.
- Employment rises as firms expand.
- Higher tax revenue at unchanged tax rates, funding public services and reducing the deficit.
- Lower absolute poverty: historically the main driver of poverty reduction.
- Investment and dynamic efficiency: profitable firms invest, raising future capacity, a virtuous circle.
- Business confidence improves, reinforcing investment.
- Growth can fund environmental protection; richer countries can afford cleaner technology.
Costs of growth
- Inflation, if demand outruns capacity, a positive output gap.
- Environmental damage: pollution, congestion, resource depletion: negative externalities (1.3).
- Resource depletion, imposing costs on future generations.
- Inequality may widen if the gains accrue to capital owners and the highly skilled.
- Current account deficit, as rising incomes pull in imports.
- Structural unemployment: growth is disruptive, and new industries displace old ones whose workers cannot transfer.
- Opportunity cost: growth through investment means forgoing present consumption (1.1).
Sustainable growth meets present needs without compromising future generations' ability to meet theirs. Distinguishing growth that depletes natural capital from growth built on productivity is the strongest evaluative frame available here.
Worked example
An economy has been in recession with a negative output gap of 3% and unemployment well above the natural rate. The government raises infrastructure spending.
- Higher G raises AD
- with substantial spare capacity, firms respond by raising output rather than prices
- real GDP rises and unemployment falls
- the multiplier amplifies the injection as the newly employed spend their incomes (2.2)
- the negative output gap closes with only modest inflation.
- The infrastructure itself raises productive capacity
- LRAS shifts right
- so the policy delivers actual growth now and potential growth later, raising the sustainable non-inflationary growth rate.
Evaluation.
- The outcome depends critically on the size of the output gap. If it is smaller than believed, and estimates are unreliable, the same stimulus is largely inflationary.
- Time lags are long. Infrastructure takes years to plan and build, so the demand stimulus may arrive after recovery has begun.
- The spending must be financed: higher borrowing widens the deficit and adds to future debt interest. If it causes crowding out, private investment falls and the net effect is smaller, though that is weak when rates are at their floor.
- The multiplier's size is uncertain, and leakages into saving, tax and imports reduce it. The more open the economy, the smaller it is.
- Whether growth is sustainable depends on what is built. Transport and broadband raise long-run capacity; projects with no productive return raise debt without shifting LRAS.
- Environmental cost: construction and the growth it enables generate emissions and land use with external costs that do not appear in GDP.
Judgement: with a genuine negative output gap, demand stimulus raises output at little inflationary cost, and capacity-raising spending is the best form of it. The main risks are lags and the unreliability of the output gap estimate itself.
Common exam mistakes
- Using nominal GDP to discuss growth. Always specify real.
- Confusing actual growth (towards the PPF) with potential growth (shifting it).
- Saying one quarter of negative growth is a recession, it requires two consecutive quarters.
- Getting the output gap sign backwards. Negative = spare capacity; positive = overheating.
- Saying growth always raises living standards, ignoring population growth and distribution.
- Treating growth as automatically unsustainable, without distinguishing productivity-driven growth from resource depletion.
- Listing costs and benefits without a judgement on which dominates and for whom.
Exam technique
Use an AD/AS diagram for any growth question: a rightward AD shift for actual growth and a rightward LRAS shift for potential growth. The two carry different implications for the price level, and showing both distinguishes a top answer.
Anchor every judgement in the output gap, the same policy has opposite effects depending on whether spare capacity exists.
For "do the benefits outweigh the costs", organise by stakeholder, households, firms, government, future generations, the environment, and conclude on sustainability and distribution rather than on growth in the abstract.
Quick revision
- Actual growth moves output towards the PPF; potential growth shifts it outward.
- Actual growth comes from rising AD; potential growth from investment, technology, skills, labour force, productivity.
- Negative output gap = spare capacity, deflationary pressure. Positive = overheating, demand-pull inflation.
- Potential output is estimated, not observed.
- Cycle: boom → downturn → recession (two consecutive quarters) → recovery.
- Driven by confidence, the multiplier and accelerator, credit cycles and shocks.
- Benefits: incomes, employment, tax revenue, lower poverty, investment.
- Costs: inflation, environmental damage, resource depletion, inequality, current account deficit, structural unemployment.
- Sustainable growth does not compromise future generations.
Check you have it
Question 1
Which one of the following is most likely to lead to an increase in potential economic growth? An increase in:
Answer: D.
Question 2
Which one of the following would be most likely to result from lower base interest rates? A fall in:
Answer: B.
Question 3
Which one of the following is most likely to decrease as a result of CETA?
Answer: D.
What the syllabus asks for on this topicSpecification points
Specification points
- Causes of growth: actual and potential growth; the output gap.
- The economic (business) cycle.
- The benefits and costs of growth.
Related Edexcel A-Level topics
Not the topic you were looking for? Describe what you are stuck on in your own words and we will take you to the notes that answer it.