National Income
Contents: 8 sections
The circular flow of income
The circular flow models the economy as a continuous movement of income between households and firms.
- Households supply factors of production to firms and receive factor incomes, wages, rent, interest and profit
- they spend that income on the goods and services firms produce
- that spending becomes firms' revenue, which pays for factors again.
In this closed two-sector model, national income = national output = national expenditure. All three are measures of the same flow viewed from different angles, which is why GDP can be calculated by the income, output or expenditure method and should give the same figure.
The real economy is not closed, so the model adds:
Injections (J), spending entering the flow that does not come from household income:
- Investment (I): firms' spending on capital goods.
- Government spending (G).
- Exports (X): foreign spending on domestic output.
Withdrawals / leakages (W), income not passed on as spending on domestic output:
- Saving (S): income not spent.
- Taxation (T): income taken by the government.
- Imports (M): spending that goes abroad.
Equilibrium national income
Equilibrium occurs where injections equal withdrawals: J = W, or I + G + X = S + T + M.
At that point, planned spending equals planned output, so there is no tendency for national income to change.
Disequilibrium and how it corrects:
| Condition | Effect |
|---|---|
| J > W | More is entering than leaving → AD rises → national income expands, magnified by the multiplier (2.2) |
| J < W | More is leaving than entering → AD falls → national income contracts, magnified in reverse |
Note carefully that equilibrium does not mean full employment. On the Keynesian view (2.3), the economy can settle at an equilibrium well below full capacity, a deflationary gap, and stay there, because nothing in the mechanism forces it back. That is the whole case for demand management.
An inflationary gap is the opposite: planned spending exceeds what the economy can produce at full employment, so the excess raises the price level rather than output.
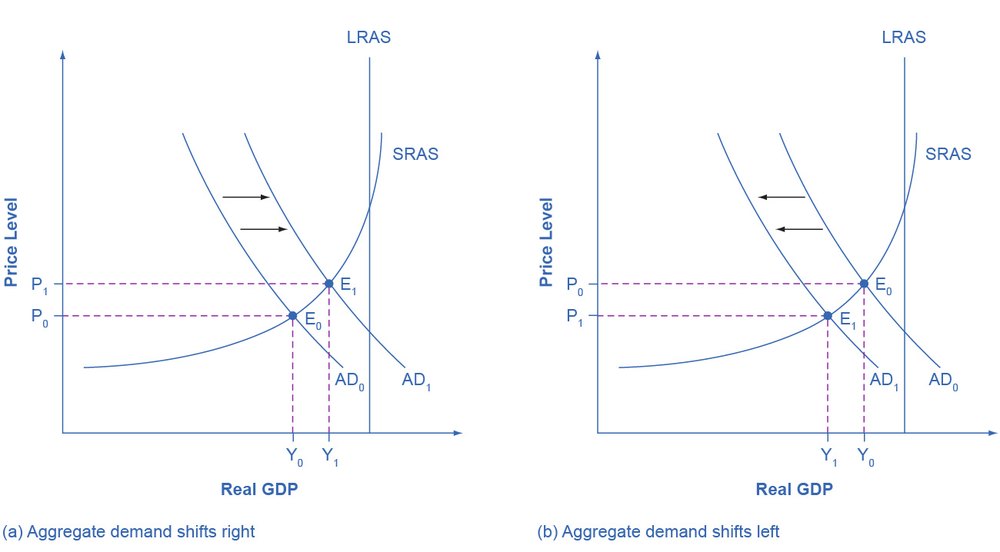
The AD–AS view of the same thing: injections exceeding withdrawals shifts AD right, and how much of that becomes output rather than price level depends entirely on how far the economy sits below the vertical LRAS line.
Working the numbers
Finding equilibrium. An economy has planned injections and withdrawals of:
Investment £120bn + government spending £180bn + exports £150bn = J = £450bn
Saving £140bn + taxation £190bn + imports £160bn = W = £490bn
W exceeds J by £40bn, so withdrawals outweigh injections and national income contracts.
How far it contracts depends on the multiplier. With a marginal propensity to save of 0.15, tax 0.20 and import 0.15:
k = 1 ÷ (0.15 + 0.20 + 0.15) = 1 ÷ 0.5 = 2
Fall in national income = 2 × £40bn = £80bn
Two points the examiner is looking for. The economy does not shrink by the £40bn imbalance but by twice it, because each round of lost spending is someone else's lost income. And the multiplier is smaller in an economy with high taxes or high import propensity, the leakages in the denominator, which is why the same shock does less damage in a very open economy, and why the same stimulus achieves less there too.
Wealth and income
This distinction is examined directly and is frequently muddled.
| Income | Wealth | |
|---|---|---|
| Nature | A flow over a period | A stock at a point in time |
| Examples | Wages, rent, interest, dividends, benefits | Property, shares, pensions, savings, land |
| Measured | Per week, month or year | On a given date |
Income is what you earn; wealth is what you own. Wealth generates income (rent, dividends, interest), and income that is saved becomes wealth, but they are not interchangeable.
Why the distinction matters:
- Wealth inequality is far greater than income inequality in almost every country, because wealth accumulates across a lifetime and is inherited. Answers on inequality (4.2) that only discuss income miss most of the problem.
- Wealth effects are a determinant of consumption (2.2): rising house or share prices raise spending even when income is unchanged.
- A retired household may have low income but substantial wealth; a young graduate may have high income and negative net wealth.
- Policies differ: income tax addresses income, while capital gains, inheritance and property taxes address wealth.
Worked example
An economy has planned injections of £180bn (I = £70bn, G = £90bn, X = £20bn) and planned withdrawals of £210bn (S = £80bn, T = £95bn, M = £35bn).
- J = £180bn < W = £210bn
- more income is leaking out than is being injected
- aggregate demand falls
- firms find stocks accumulating and cut output
- national income contracts.
The contraction is amplified by the multiplier working in reverse: falling output means falling incomes, which means less consumption, which means further falls in output.
The process does not continue indefinitely. As income falls, withdrawals fall automatically, people save less, pay less tax and buy fewer imports, until W has fallen to equal J at a new, lower equilibrium income.
The key point: the economy has reached equilibrium, but at a level that may involve substantial unemployment. Equilibrium is not the same as full employment.
Evaluation.
- Whether the government should act depends on the output gap. If the new equilibrium is well below full employment, an injection through G (or a tax cut raising C) can close the gap, the Keynesian prescription.
- The size of the effect depends on the multiplier, and therefore on MPW. With withdrawals as large as these, k is relatively small and the required injection correspondingly larger.
- Automatic stabilisers are already doing part of the work: as income falls, tax revenue falls and benefit spending rises, cushioning the contraction without any policy decision.
- On the classical view, the adjustment would be temporary, falling wages and prices would restore full employment without intervention. Whether that is realistic depends on how sticky wages actually are.
- Injections and withdrawals are planned magnitudes; the model tells us the direction of adjustment, not its speed.
Judgement: the economy will settle at a lower equilibrium income with spare capacity. Whether intervention is warranted turns on how large the resulting output gap is and how quickly wages and prices would otherwise adjust.
Common exam mistakes
- Listing saving as an injection; it is a withdrawal. Only investment is the injection.
- Assuming equilibrium means full employment. It does not.
- Confusing wealth (a stock) with income (a flow), the single most common error in this topic.
- Forgetting that withdrawals adjust automatically as income changes, which is what produces the new equilibrium.
- Treating the circular flow as a closed model when the question involves trade or government.
- Ignoring the multiplier when tracing the adjustment.
Exam technique
Draw the circular flow diagram with injections entering and withdrawals leaving, labelled I, G, X and S, T, M. Then state the equilibrium condition J = W explicitly.
When data is given, compare total J with total W and state the direction of adjustment before explaining the mechanism.
For evaluation, link back to the Keynesian versus classical debate (2.3): the circular flow shows how an economy can settle below full employment, and whether that justifies intervention depends on wage flexibility and the size of the output gap.
Quick revision
- Circular flow: households supply factors and receive factor incomes; firms produce and receive spending.
- National income = national output = national expenditure.
- Injections: investment, government spending, exports.
- Withdrawals: saving, taxation, imports.
- Equilibrium where J = W. J > W → income expands; J < W → income contracts.
- Equilibrium is not necessarily full employment, a deflationary gap can persist.
- An inflationary gap means planned spending exceeds full-employment output.
- Income is a flow; wealth is a stock. Wealth inequality far exceeds income inequality.
- Wealth effects influence consumption independently of income.
Check you have it
Question 1
Which one of the following is the most likely consequence of an increase in the US national debt? An increase in:
Answer: A.
What the syllabus asks for on this topicSpecification points
Specification points
- The circular flow of income; injections and withdrawals.
- Equilibrium levels of real national output.
- The distinction between wealth and income.
Related Edexcel A-Level topics
Not the topic you were looking for? Describe what you are stuck on in your own words and we will take you to the notes that answer it.