Poverty and Inequality
Contents: 15 sections
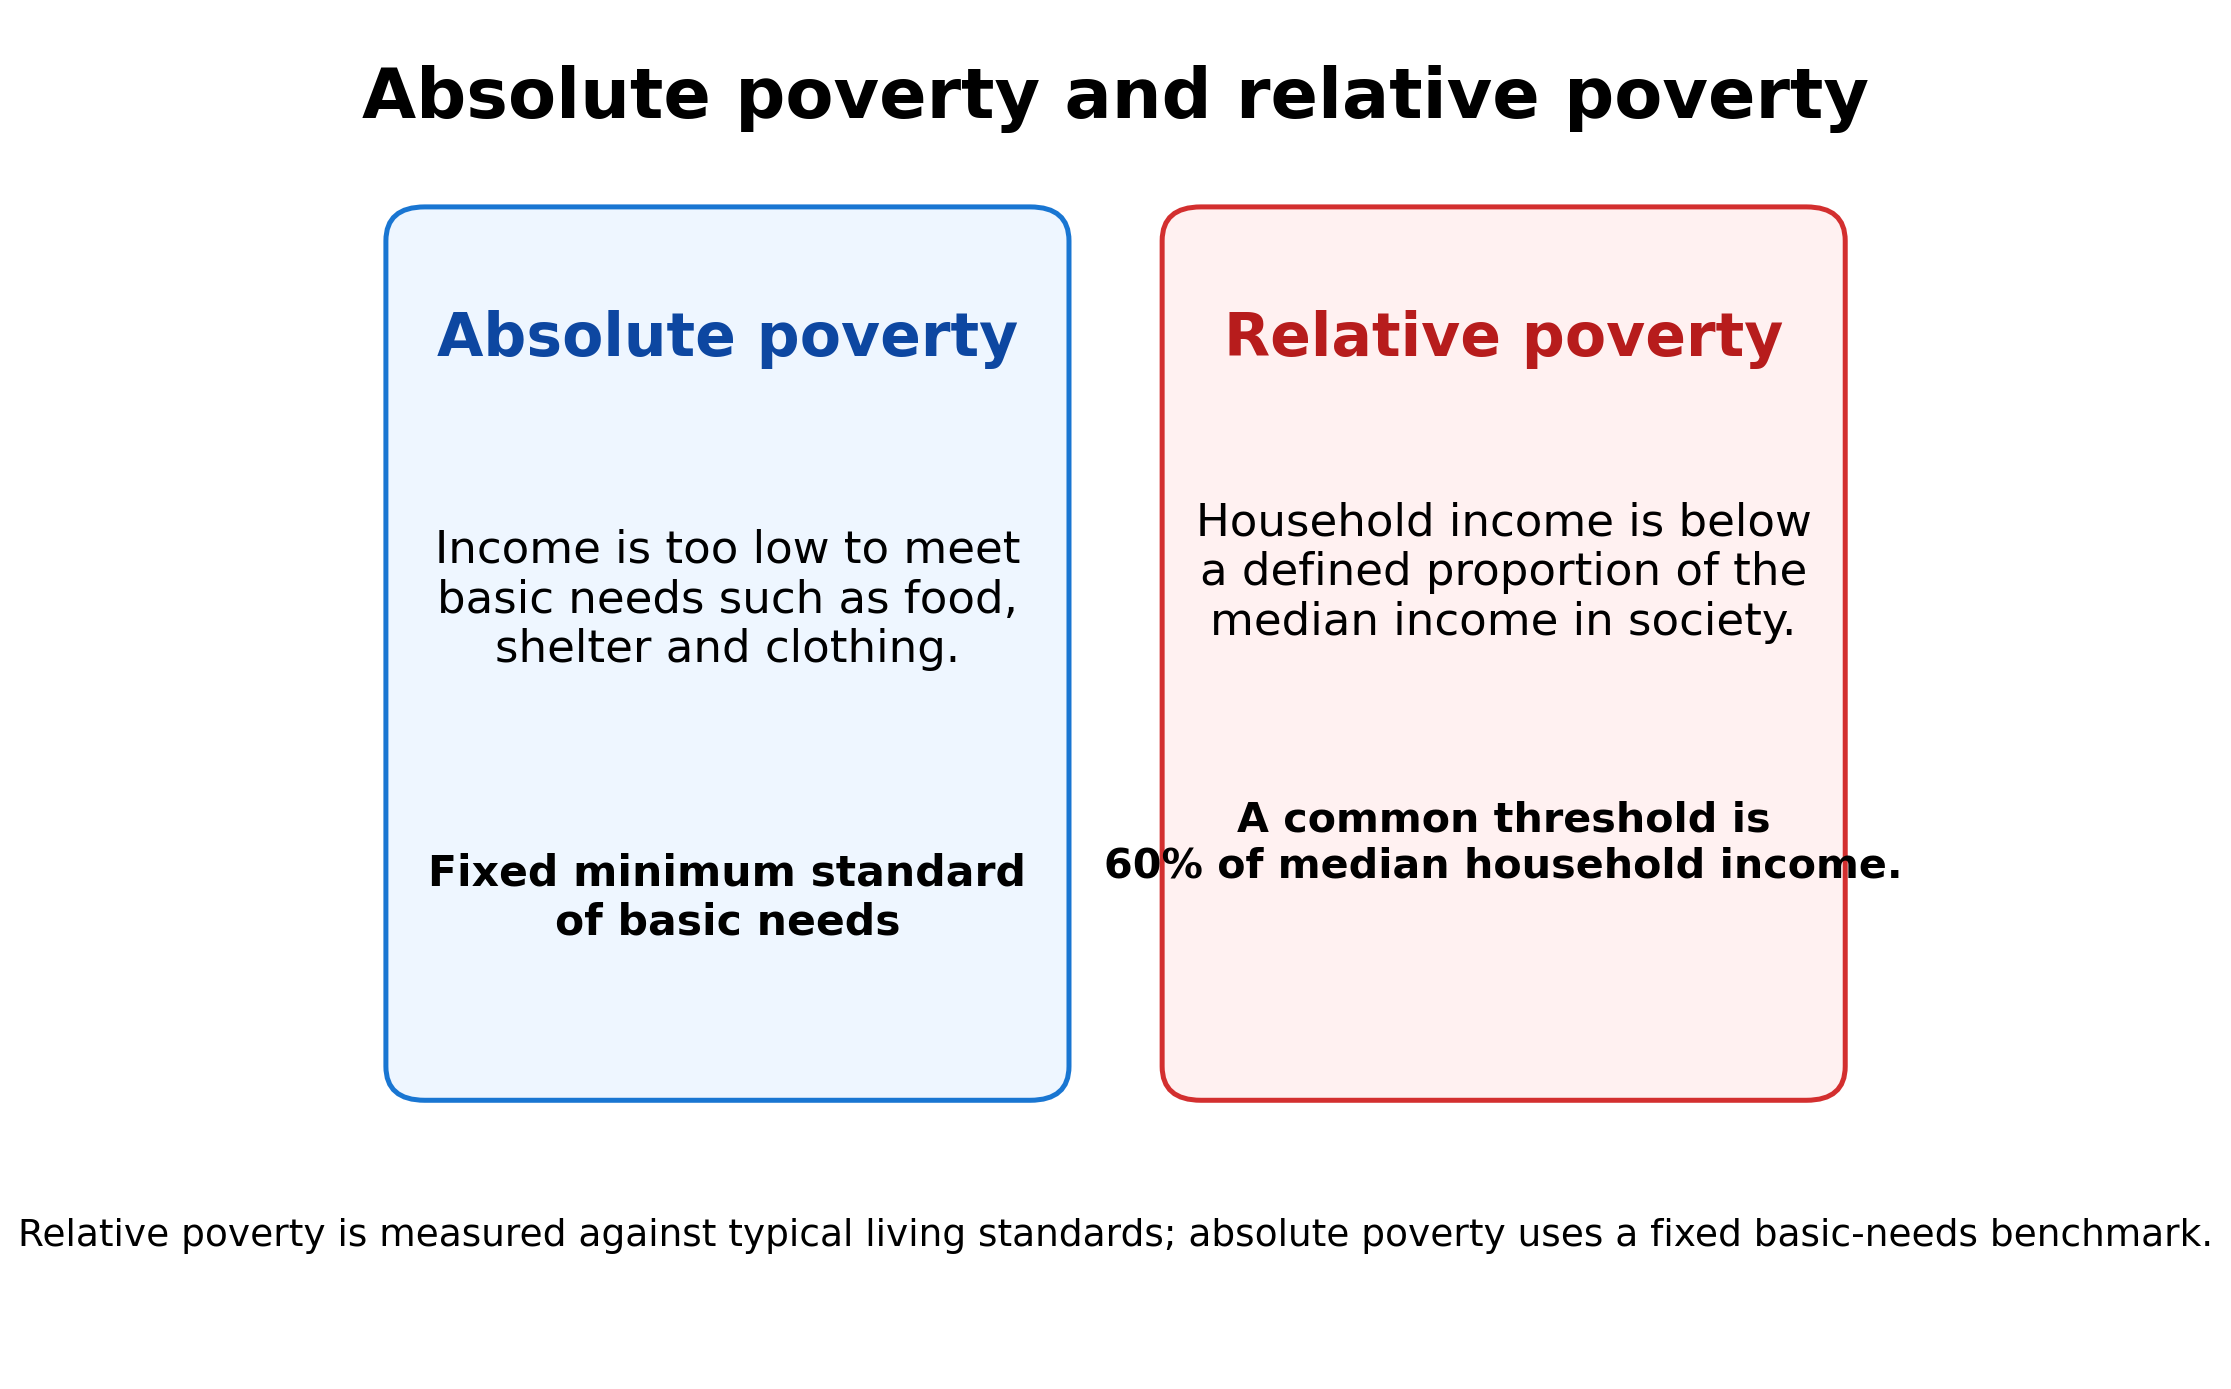
Absolute and relative poverty
| Absolute poverty | Relative poverty | |
|---|---|---|
| Meaning | Income too low to afford basic necessities | Income well below the average in that society |
| Measured against | A fixed international line | Typically 60% of median income |
| Can it be eliminated? | Yes, in principle | In principle yes, but only if the distribution narrows enough that no household sits below the threshold |
| Found in | Mainly low-income countries | Every country |
Read the benchmark carefully. Relative poverty is not "below the median". It is income below a defined percentage of median household income, conventionally 60%. A household can be counted as relatively poor while its own real income is rising, if incomes elsewhere in the distribution rise faster and pull the threshold up past it. Equally, relative poverty falls when the bottom of the distribution gains ground on the middle, whatever happens to the average.
The insight Edexcel rewards: growth can lift millions out of absolute poverty while relative poverty stays flat or worsens, because the benchmark moves with median income. The two measure genuinely different things: survival, and exclusion from normal life in your own society.
Causes of changes in poverty
Both measures move, and they do not have to move together.
| Driver | Effect on absolute poverty | Effect on relative poverty |
|---|---|---|
| Economic growth | Falls, if the gains reach low-income households | Ambiguous: the 60% threshold rises with median income, so relative poverty can hold steady or worsen if growth accrues to the top |
| Employment and unemployment | Work is the main route out; unemployment pushes households in | Same direction, and strong, since earnings dominate household income |
| Real wages | Falling real wages push households below the fixed line | Depends on whose wages move: a rise concentrated at the top lifts the threshold and can raise relative poverty |
| Inflation | Raises it where nominal incomes and benefits lag prices, and the poorest face a higher effective rate because food, energy and rent take more of their budget | Depends on whether the median is hit harder than the bottom |
| Education and skills | Falls over the long run through higher earning power | Falls where the gains reach the bottom of the distribution, rises where they reach the already-skilled |
| Taxes and benefits | Transfers and a progressive structure cut it directly and quickly | Cut it directly, since the threshold depends on the shape of the distribution the system produces |
| Structural change | Job losses in declining industries push affected households in, while new sectors pull others out | Usually raises it while it happens, because the losses and the gains fall on different groups and regions |
| Government policy | Minimum wages, benefits and public services all reach it | Reaches it, but the effect depends on where in the distribution the policy bites |
The point examiners look for: the same change can move the two in opposite directions. Growth may cut absolute poverty sharply while relative poverty stays high, because the gains are concentrated among higher-income households and the median rises with them. Write about the mechanism and about who gains, not about the average.
Measuring inequality
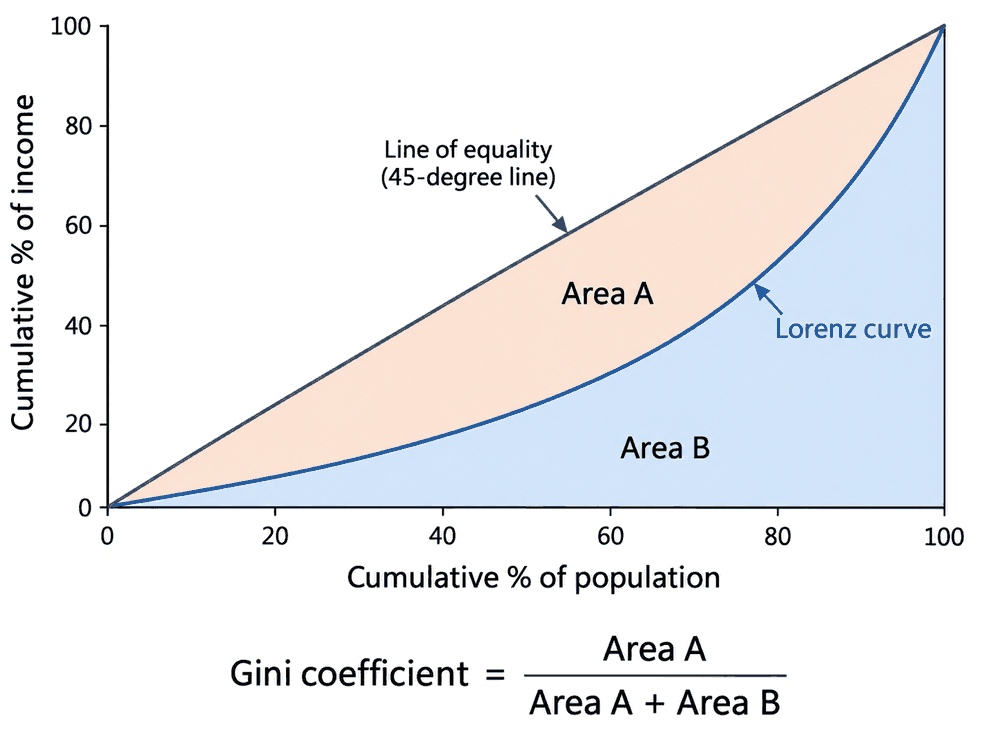
The Lorenz curve plots the cumulative percentage of total income against the cumulative percentage of the population, ranked poorest to richest.
The 45° line of perfect equality shows the distribution where each x% of the population receives exactly x% of income. The actual curve lies below it and bows further out as inequality rises.
The Gini coefficient turns that picture into a number:
Gini = A ÷ (A + B), where A is the area between the line of equality and the Lorenz curve, and A + B is the whole area beneath the line of equality.
It runs from 0 (perfect equality, curve sitting on the line) to 1 (perfect inequality).
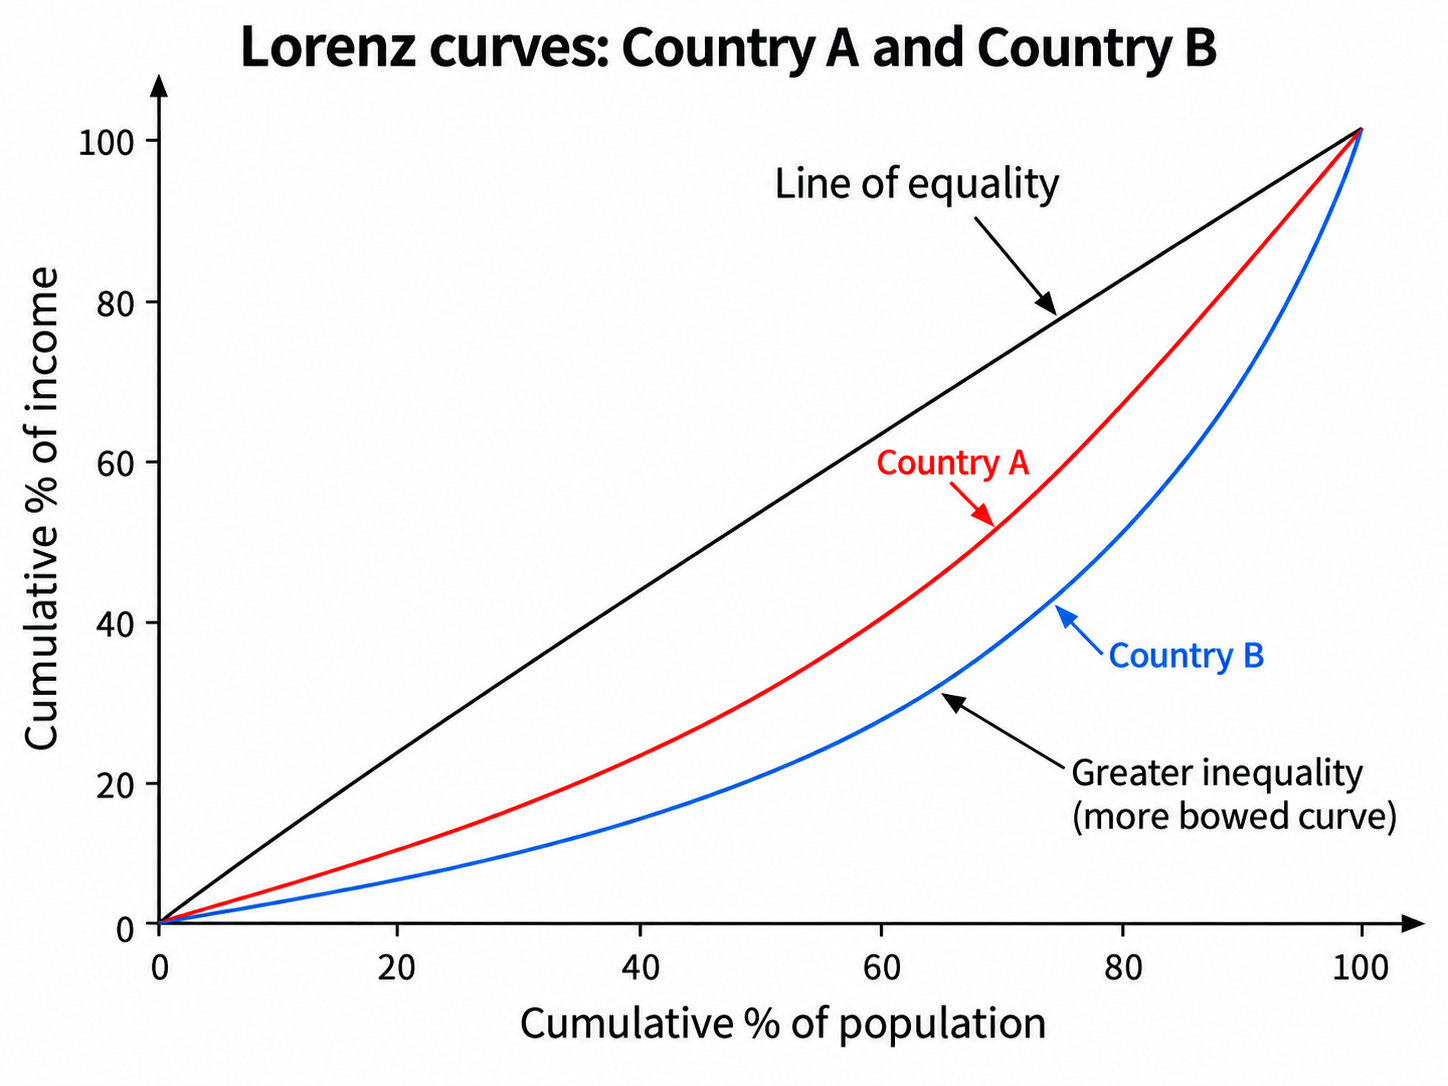
Limitations: it is a single summary statistic, so two countries can share a Gini of 0.35 while one has a very poor bottom decile and the other a very rich top 1%, the same area can be produced by differently shaped curves. It also measures income, not wealth. Reading it alongside decile ratios gives a fuller picture.
Wealth and income
| Income | Wealth | |
|---|---|---|
| Nature | A flow over a period | A stock at a point in time |
| Examples | Wages, rent, interest, dividends, benefits | Property, shares, pensions, savings, land |
Income is what you earn; wealth is what you own.
Wealth inequality is far greater than income inequality in almost every country, because wealth accumulates over a lifetime and is inherited. An answer on inequality that discusses only income misses most of the problem, and saying so explicitly is a reliable mark-earner. The policy instruments differ too: income tax addresses income, while capital gains, inheritance and property taxes address wealth.
Causes of inequality
- Differences in wages, driven by differing MRP, skills and education (3.5).
- Unemployment and worklessness.
- Wealth inequality compounding itself: assets generate income, which buys more assets.
- Inheritance, transmitting advantage across generations.
- Differences in household composition: pensioners, single-parent households.
- The tax and benefit system, which can reduce inequality or, if it relies on regressive indirect taxes, increase it.
- Discrimination.
- Globalisation and technological change, raising returns to capital and skilled labour relative to unskilled labour.
- Regional differences in productivity and opportunity.
Economic development and inequality
Development changes the shape of the distribution, not only its level.
- Structural change: labour moves out of agriculture into manufacturing and services, and earnings in the receiving sectors are both higher and more dispersed.
- Urbanisation: cities raise average productivity and pay, so the urban and rural gap widens before it closes.
- Returns to skills: new technology raises the premium on education, and the premium falls again only as the supply of educated workers catches up.
- Asset ownership: land, housing and shares rise in value, and whoever already owns them gains most, which widens wealth inequality faster than income inequality.
- Wage differentials: they widen where skills are scarce and narrow as education spreads and labour becomes more mobile.
- Tax and transfer systems: developing states widen their tax base and build welfare provision, which is the main mechanism by which measured inequality falls later in the process.
The Kuznets hypothesis is the theory that inequality follows an inverted U: it rises in the early stages of development as labour shifts into higher-paying but unequal sectors, then falls as incomes, education, welfare provision and political participation broaden.
Treat it as a hypothesis, not a law. It describes some historical paths and not others. Several high-income economies saw inequality rise from the 1980s, long after the turning point the curve predicts, which is difficult to reconcile with an inevitable downward phase. Institutions, the tax and transfer system and political choices plausibly do more work than the stage of development itself. Naming it, then saying the relationship is not inevitable, is worth more than drawing the curve.
Capitalism and inequality
Why unequal outcomes arise:
- Unequal ownership of assets: capital is distributed far less evenly than labour, and it generates income for whoever holds it.
- Inheritance: wealth passes between generations, so advantage compounds outside the labour market entirely.
- Different returns to labour and capital: where the return on capital exceeds the growth of wages, the share going to owners rises.
- Wage differentials: differences in MRP, scarcity of skills, and bargaining power all widen the spread of earnings (3.5).
- Entrepreneurship and risk-taking: the possibility of a large reward is what compensates the risk, and the successful minority ends up far above the median.
- Market power: firms with it earn supernormal profit, which accrues to owners rather than to consumers or workers.
But the outcome is not fixed. What a market produces before intervention is not what households finally receive, and the gap between the two is a policy choice:
- Progressive taxation reduces the dispersion of post-tax income, subject to the incentive and avoidance arguments above.
- Transfers raise the incomes of the poorest directly and act fastest of any instrument.
- Education attacks the cause rather than the symptom, though over a generation and only where access and quality hold.
- Competition policy attacks market power, reducing the supernormal profit that accrues to owners.
- Public services provided free at the point of use are a transfer in kind, and they narrow the distribution of real living standards by more than the income figures alone suggest.
Countries at similar levels of income and with similar market structures record very different Gini coefficients, which is the clearest evidence that the final distribution reflects institutions and choices rather than an automatic consequence of the system.
Impacts of inequality
Arguments that some inequality is necessary:
- Incentives: the prospect of higher reward encourages work, risk-taking, education and enterprise. Very strong redistribution may weaken some financial incentives to work, save, invest or take entrepreneurial risks, though how much depends on how the policy is designed, which margins it bites on and what the revenue funds.
- Higher incomes generate savings, which fund investment.
- The trickle-down argument, that gains at the top eventually raise incomes throughout, though the empirical support for it is weak, which is worth saying.
Arguments that high inequality is harmful:
- Lower aggregate demand, since poorer households have a higher MPC; concentrating income at the top, where the MPC is lower, reduces consumption.
- Reduced social mobility and wasted talent, the poverty cycle means able children never reach their productive potential, so long-run growth suffers.
- Health and social costs: worse health outcomes, higher crime.
- Political instability and reduced social cohesion.
- Market failure: under-consumption of education and healthcare among the poor is a positive externality forgone.
Policies to reduce inequality
| Policy | Mechanism | Drawback |
|---|---|---|
| Progressive taxation | Higher earners pay a larger proportion | May weaken work incentives; avoidance and evasion; the Laffer argument |
| Benefits and transfers | Raise the incomes of the poorest directly | Cost; possible dependency and the poverty trap |
| National minimum / living wage | Raises the lowest wages | Possible unemployment if set above the competitive wage (3.5) |
| Free education and training | Raises human capital and future earnings: attacks the root | Very slow, a generation to work through |
| Free healthcare | Keeps people able to work; prevents medical costs causing poverty | Expensive; opportunity cost |
| Inheritance and wealth taxes | Address the stock, not just the flow | Avoidance; capital flight; politically difficult |
| Regional and infrastructure policy | Raises productivity in poorer regions | Long lags; risk of government failure |
The recurring trade-off is equity versus efficiency: redistribution works quickly but may blunt incentives; raising productivity is durable but slow. The strongest answers argue for a combination. Education can reduce inequality while also raising productive potential, but its effects are long term and depend on access, quality and whether the labour market offers opportunities to those who gain the skills.
Working the numbers
Reading a Lorenz curve. Income shares by quintile, poorest first:
| Quintile | Share of income | Cumulative |
|---|---|---|
| Poorest 20% | 5% | 5% |
| Second 20% | 10% | 15% |
| Third 20% | 15% | 30% |
| Fourth 20% | 23% | 53% |
| Richest 20% | 47% | 100% |
The cumulative column is what gets plotted. A point at (40, 15) means the poorest 40% receive 15% of income. Always cumulative, always poorest-first. Under perfect equality that point would be (40, 40), and the vertical gap between the two is the inequality the diagram shows.
The richest fifth receives 47%, more than the bottom three-fifths combined (30%). That single comparison is often worth more than quoting a Gini figure.
Progressive, proportional, regressive. The test is what happens to the average rate as income rises, not the amount paid.
A 20% VAT. Household A earns £20,000 and spends £19,000; Household B earns £80,000 and spends £48,000.
A pays 20% × £19,000 = £3,800, which is 19% of income
B pays 20% × £48,000 = £9,600, which is 12% of income
B pays two and a half times as much in cash, yet the tax takes a smaller share of its income. The average rate falls as income rises, so VAT is regressive, despite an identical rate for everyone. The mechanism is that poorer households must spend a larger proportion of what they earn, so a tax on spending reaches more of it.
The redistributive effect. If a Gini of 0.49 before taxes and transfers falls to 0.34 after, the system is clearly redistributive, but that measures whether it redistributes, not whether it redistributes enough, which is a normative question about equity rather than a measurement one.
Worked example
A government raises the top rate of income tax to reduce inequality.
- Higher earners' post-tax income falls
- the income distribution narrows
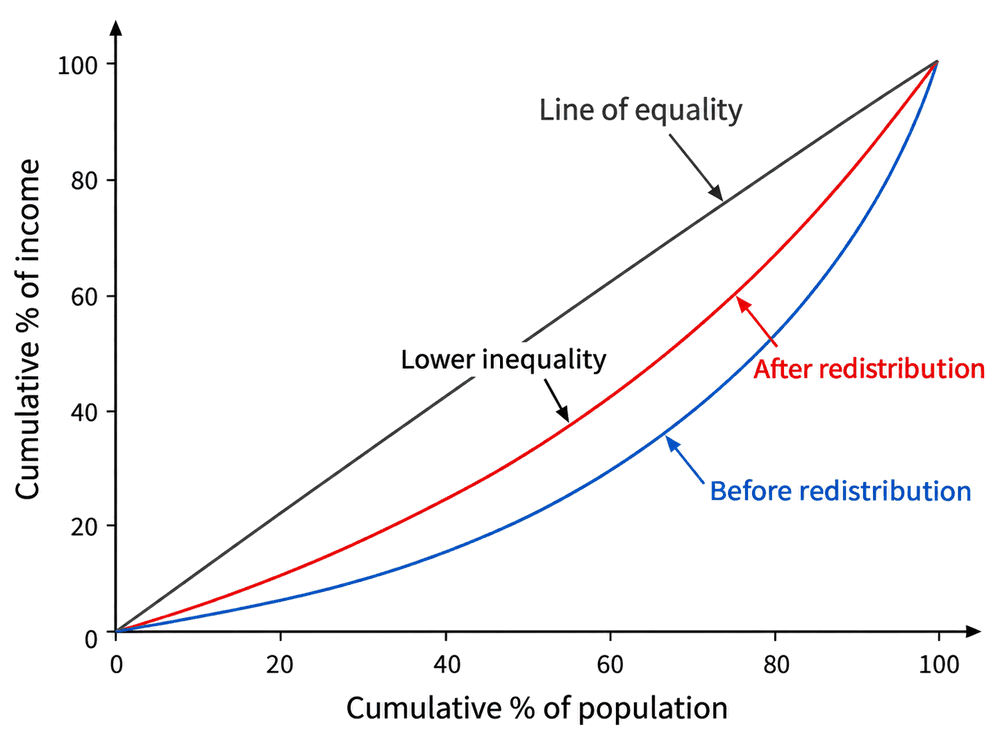
- the Lorenz curve moves towards the line of equality
- the Gini coefficient falls
- and if the revenue funds benefits or public services, the incomes of the poorest rise, narrowing it further.
Evaluation.
- Incentive effects. Higher marginal rates may reduce hours worked, discourage entrepreneurship, or prompt emigration of high earners. Note that this is theoretically ambiguous: the substitution effect discourages work, but the income effect may increase it, since a person needs more hours to reach a target income. Which dominates is an empirical question.
- The Laffer curve suggests that beyond some rate, revenue falls as avoidance, evasion and relocation rise. The theoretical point is uncontroversial; where the peak lies is contested and the evidence weak, so it should be used with caution rather than asserted.
- Avoidance and evasion mean the measured burden may fall well short of the intended one.
- It addresses income, not wealth, and since wealth inequality is much larger, the effect on overall inequality may be modest. Capital gains and inheritance taxes would reach further.
- How the revenue is spent matters as much as how it is raised. Revenue funding education reduces inequality durably; revenue funding transfers reduces it immediately but not permanently.
Judgement: a higher top rate reduces measured income inequality but reaches only part of the problem, and its revenue yield is uncertain. Pairing it with wealth taxation and with spending on education addresses both the stock and the root cause. Education is the measure most likely to raise productive potential alongside equity, though on a much longer horizon and only where access and quality reach the households that need it.
Common exam mistakes
- Confusing absolute with relative poverty.
- Saying growth eliminates relative poverty; it need not, because the benchmark moves with median income.
- Defining relative poverty as "below the median". It is below a set percentage of the median, usually 60%.
- Confusing wealth (a stock) with income (a flow). The single most common error here.
- Describing the Lorenz curve without giving the Gini ratio, or vice versa.
- Getting the Gini scale backwards, 0 is perfect equality.
- Treating all inequality as harmful, ignoring the incentive argument.
- Listing policies without a drawback for any of them.
Exam technique
Draw the Lorenz curve with both axes labelled as cumulative percentages, the 45° line, and areas A and B marked, then state Gini = A ÷ (A + B). Most of the marks in measurement questions attach to that diagram.
Distinguish income from wealth explicitly whenever inequality is discussed; it is a reliable route into the higher bands.
For policy evaluation, use equity versus efficiency, the income and substitution effects on labour supply, and the distinction between measures that address the flow and those that address the stock.
Quick revision
- Absolute poverty: cannot afford necessities; a fixed line; can be eliminated. Relative: below 60% of median income; exists everywhere.
- Lorenz curve: cumulative income share against cumulative population share, against the 45° line.
- Gini = A ÷ (A + B), from 0 (equality) to 1 (inequality).
- Income is a flow; wealth is a stock. Wealth inequality is far greater.
- Causes: wage differences, unemployment, inherited wealth, tax and benefit design, discrimination, globalisation, regional divides.
- Some inequality supports incentives; high inequality lowers AD, mobility and long-run growth.
- Policies: progressive tax, benefits, minimum wage, education, healthcare, wealth and inheritance taxes, regional policy.
- The trade-off is equity versus efficiency; education can serve both, but slowly and only where access and quality hold.
- The same change can move absolute and relative poverty in opposite directions: growth cuts absolute poverty, but relative poverty holds if the gains sit at the top.
- Development reshapes the distribution through structural change, urbanisation, returns to skills and asset ownership. Kuznets is a hypothesis, not a law.
- Capitalism generates unequal outcomes through asset ownership, inheritance, returns to capital and market power, but taxes, transfers, education, competition policy and public services decide the final distribution.
What the syllabus asks for on this topicSpecification points
Specification points
- Absolute and relative poverty, and the difference between them.
- The causes of changes in absolute and relative poverty.
- Measurements of inequality: the Lorenz curve and the Gini coefficient.
- The causes of inequality, including wage differentials, wealth, inheritance and the tax and benefit system.
- The distinction between wealth and income inequality.
- The impact of economic change and development on inequality, including the Kuznets hypothesis as a hypothesis.
- The significance of capitalism for inequality, and why the pre-intervention distribution is not the final one.
- Government policies to reduce poverty and inequality.
- Evaluation and trade-offs, principally equity against efficiency.
Related Edexcel A-Level topics
Not the topic you were looking for? Describe what you are stuck on in your own words and we will take you to the notes that answer it.