Reaction kinetics
Contents: 6 sections
Collision theory
For a reaction to happen, particles must collide, and a collision is only successful if two conditions are met:
- The particles collide with energy equal to or greater than the activation energy.
- They collide in the correct orientation.
Activation energy (Eₐ) is the minimum energy that colliding particles must have for a reaction to occur.
Most collisions achieve nothing. Rate depends on the frequency of successful collisions, and every factor below works by changing either how often particles meet or what fraction of those meetings have enough energy.
The factors
| Factor | Effect on rate | Why |
|---|---|---|
| Higher concentration | Faster | More particles per unit volume, so collisions are more frequent |
| Higher pressure (gases) | Faster | Same reason: the particles are closer together |
| Larger surface area | Faster | More of the solid is exposed, so more collisions per second |
| Higher temperature | Much faster | Particles move faster, and a much larger fraction exceed Eₐ |
| Catalyst | Faster | Alternative route with a lower Eₐ |
Temperature is different in kind from the first three, and the difference is the point of the topic. Concentration, pressure and surface area only change the frequency of collisions. Temperature changes the frequency and the proportion of collisions that are energetic enough, and the second effect is far the larger. A rise of 10 °C often roughly doubles the rate, which a modest increase in collision frequency could never explain.
The Boltzmann distribution
The Boltzmann distribution shows how molecular energies are spread in a sample. Its shape matters as much as its position:
- It starts at the origin, because no molecule has zero energy.
- It rises to a peak at the most probable energy.
- It has a long tail to the right that never touches the axis, because there is no upper limit on energy.
- The total area under the curve is the total number of molecules.
The activation energy is marked as a vertical line well to the right of the peak. Only the molecules in the shaded area beyond it can react.
Raising the temperature
At a higher temperature the curve becomes lower and flatter, and its peak shifts to the right. The area under the curve is unchanged, because the number of molecules has not changed.
The shaded area beyond Eₐ becomes much larger. That is the explanation the mark scheme wants: a small rise in temperature produces a large increase in the proportion of molecules with energy greater than the activation energy.
Two details that are frequently drawn wrongly: the new curve must start at the origin like the old one, and the two curves must cross, since the area is conserved.
Adding a catalyst
A catalyst does not change the distribution at all. The curve stays exactly where it was. What moves is the activation energy line, which shifts to the left, so a greater proportion of the same molecules now have enough energy.
That distinction is worth being precise about: temperature changes the curve, a catalyst changes the line.
Catalysis
A catalyst increases the rate of a reaction by providing an alternative reaction pathway of lower activation energy, and is chemically unchanged at the end.
A catalyst is not consumed, which is why a small quantity is enough for a large amount of reaction. It is also worth remembering from the equilibria topic that a catalyst does not shift the position of equilibrium: it lowers Eₐ for the forward and reverse reactions equally.
Homogeneous catalysis has the catalyst in the same phase as the reactants. The oxidation of sulfur dioxide by NO₂ in the atmosphere is a gas-phase example.
Heterogeneous catalysis has the catalyst in a different phase, usually a solid with gaseous or aqueous reactants. Iron in the Haber process and platinum in a catalytic converter are the standard examples. The reaction happens on the surface, which is why these catalysts are used as fine powders, meshes or thin coatings on a honeycomb: it maximises the surface area available.
On an energy profile, a catalysed reaction has a lower hump, and often two smaller humps if the route goes through an intermediate. The reactant and product levels are unchanged, so ΔH is the same. Drawing a catalyst as lowering the products is a serious error.
Common mistakes
- Saying a catalyst lowers the energy of the reaction. It lowers the activation energy only, and ΔH is unaffected.
- Explaining the temperature effect purely by faster movement. The dominant reason is the larger proportion of molecules exceeding Eₐ.
- Drawing a Boltzmann curve that starts above the origin, or one that does not cross the original curve.
- Saying a catalyst shifts the Boltzmann curve. It moves the activation energy line instead.
- Saying a catalyst increases the yield at equilibrium. It only gets there faster.
- Forgetting orientation. Energy alone does not make a collision successful.
Check you have it
Question 1
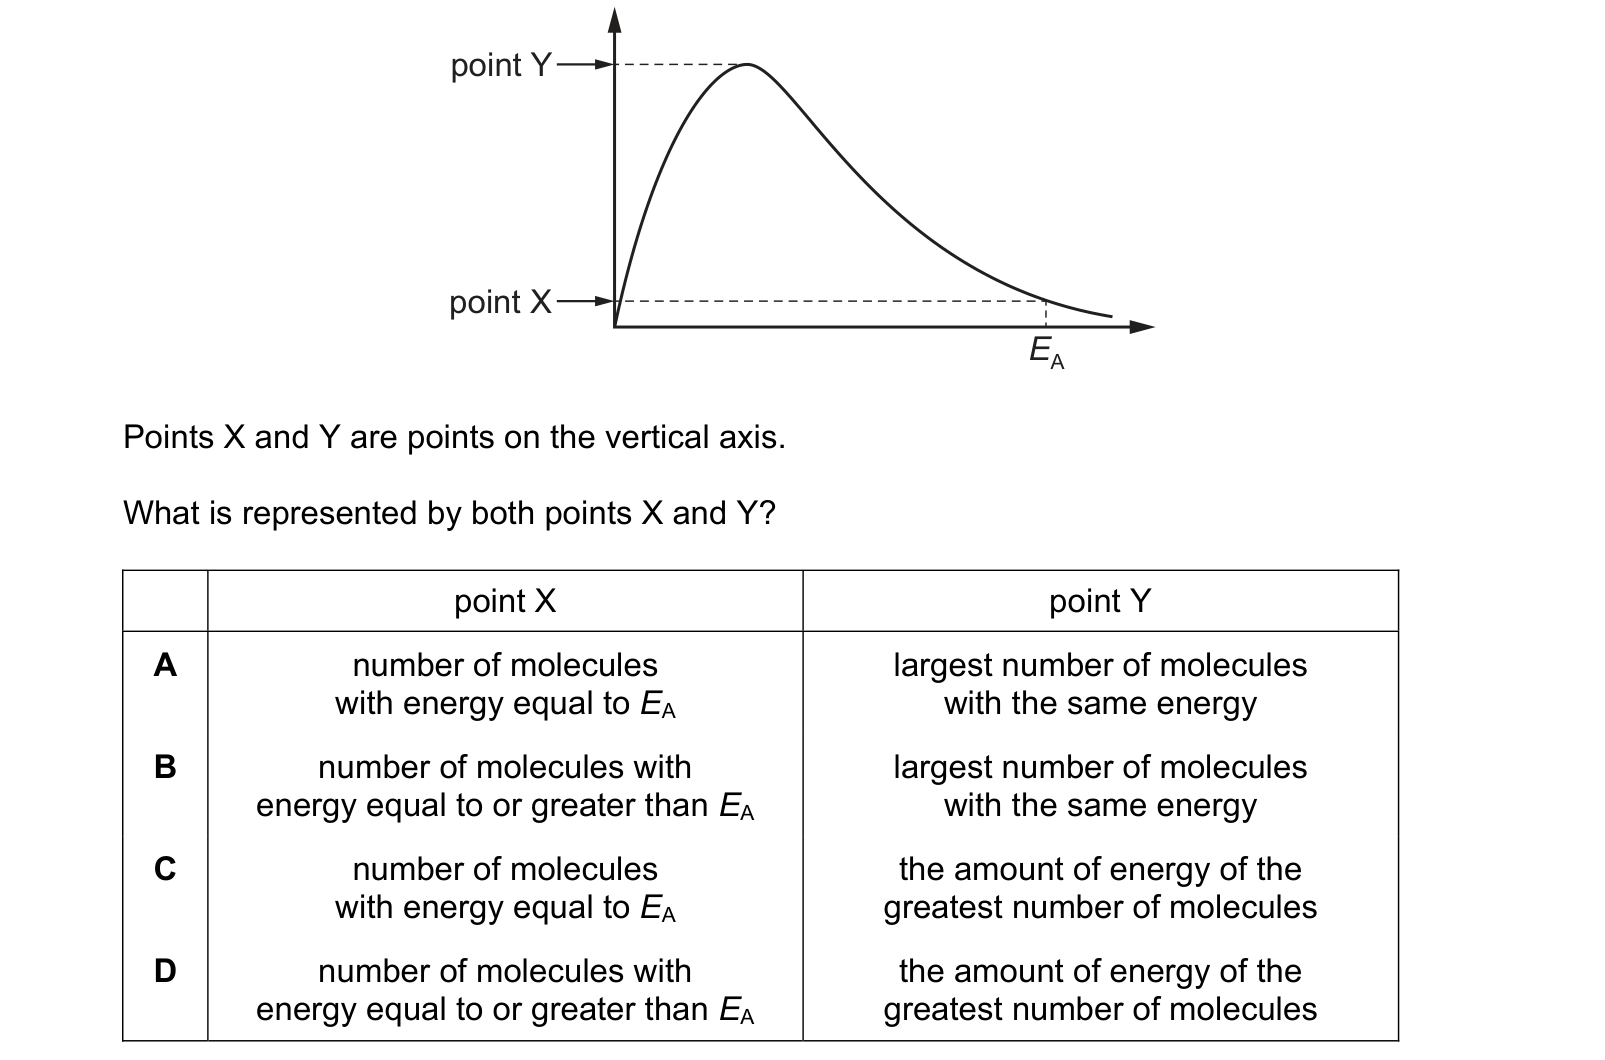
The diagram shows a Boltzmann distribution curve. The axes are not labelled. Points X and Y are points on the vertical axis. What is represented by both points X and Y? Each answer gives, in order: point X; point Y.
Answer: A.
That single observation kills C and D immediately, since both describe Y as an amount of energy. Energy is measured along the horizontal axis, which is where Ea is marked.
Y is the height of the peak, so it is the largest number of molecules sharing any one energy. The energy at which that happens is read off the horizontal axis, not the vertical.
X is the height of the curve at Ea, which is the number of molecules with energy exactly equal to Ea.
B is the one worth being careful about. The number of molecules with energy equal to or greater than Ea is the area under the curve to the right of the Ea line, not the height of the curve at that point. That area is the quantity that matters for the reaction rate, which is probably why B is tempting, but an area is not a point on the vertical axis.
The general rule is worth keeping: on a Boltzmann distribution, a height answers "how many at this energy" and an area answers "how many above this energy".
Question 2
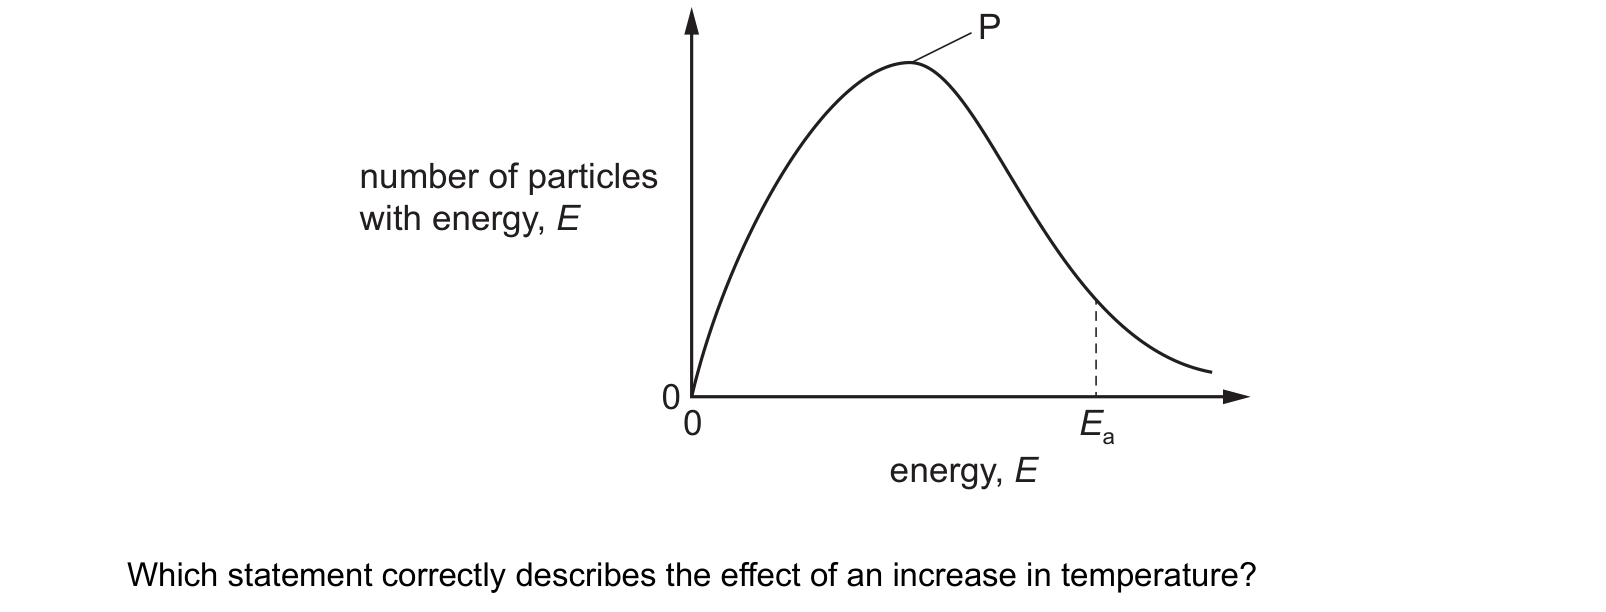
The diagram shows the Boltzmann distribution for one mole of a gas. The gas takes part in a reaction with an activation energy, Ea. energy, E
Which statement correctly describes the effect of an increase in temperature?
Answer: D.
The peak moves right and gets lower. The molecules have a wider spread of energies, so the curve flattens and broadens. The total area under the curve must stay the same, because it represents the total number of molecules, and that number has not changed. So if the curve spreads sideways it must come down in height.
More molecules exceed Ea. The curve shifts towards higher energies, so the area under the tail beyond the activation energy grows, and it grows dramatically, because that tail is exponential.
So peak lower and more molecules above Ea, which is D.
A and B both raise the peak, which would require the total area to increase, meaning molecules appearing from nowhere.
C gets the peak right and the tail wrong, which is self-contradictory: if the curve has shifted to higher energies, more of it must lie beyond any fixed value of Ea.
The area beyond Ea is the whole reason a small temperature rise has such a large effect on rate. A 10 °C rise increases the average speed by only about 2%, and yet it roughly doubles the reaction rate, because it is the tail that matters and the tail grows exponentially.
Question 3
The equation shows a reaction that occurs between carbon monoxide and nitrogen monoxide in a catalytic converter.
2CO(g) + 2NO(g) → 2CO2(g) + N2(g)
Which statement is correct?
Answer: C.
C is correct. Nitrogen monoxide is one of the ingredients of photochemical smog: in sunlight NO and unburnt hydrocarbons react to produce ground-level ozone and other irritants. Converting NO to harmless N₂ removes that ingredient, so the risk of smog falls.
A names the wrong catalyst. Catalytic converters use platinum, palladium and rhodium, coated on a honeycomb to give a large surface area. Finely divided iron is the Haber process.
B is false in an instructive way. One product is CO₂, which is itself a greenhouse gas, so the reaction does not prevent greenhouse emissions. It converts a toxic gas into a warming one, which is a genuine trade-off rather than a clean win.
D is backwards. The reaction produces nitrogen, and removing nitrogen oxides reduces ozone depletion in the upper atmosphere rather than increasing it.
Keeping the two ozone problems apart is worth doing. Ozone is a pollutant at ground level, where this reaction helps by removing NO, and a protective layer in the stratosphere, where nitrogen oxides are among the things that destroy it. The converter helps in both places.
What the syllabus asks for on this topicSyllabus points
Syllabus points
- Explain reaction rate in terms of collision theory and activation energy.
- Explain the effect of concentration, pressure, surface area and temperature on rate.
- Describe and interpret the Boltzmann distribution of molecular energies.
- Explain how a catalyst increases rate by providing an alternative route of lower activation energy.
- Distinguish between homogeneous and heterogeneous catalysis.
Related CIE 9701 Chemistry topics
Not the topic you were looking for? Describe what you are stuck on in your own words and we will take you to the notes that answer it.