40 past-paper questions on this unit. Five of them are below. Answer on the page: each one is marked the moment you pick, the correct option is shown whether or not you found it, and the full explanation opens either way.
CIE 0654 Co-ordinated SciencesPaper 1 and Paper 2 MCQsFree account
Enzymes: five questions to try now
Real past-paper questions, the answer key from the mark scheme, and the explanation that goes with it. No account needed to answer them.
Question 1
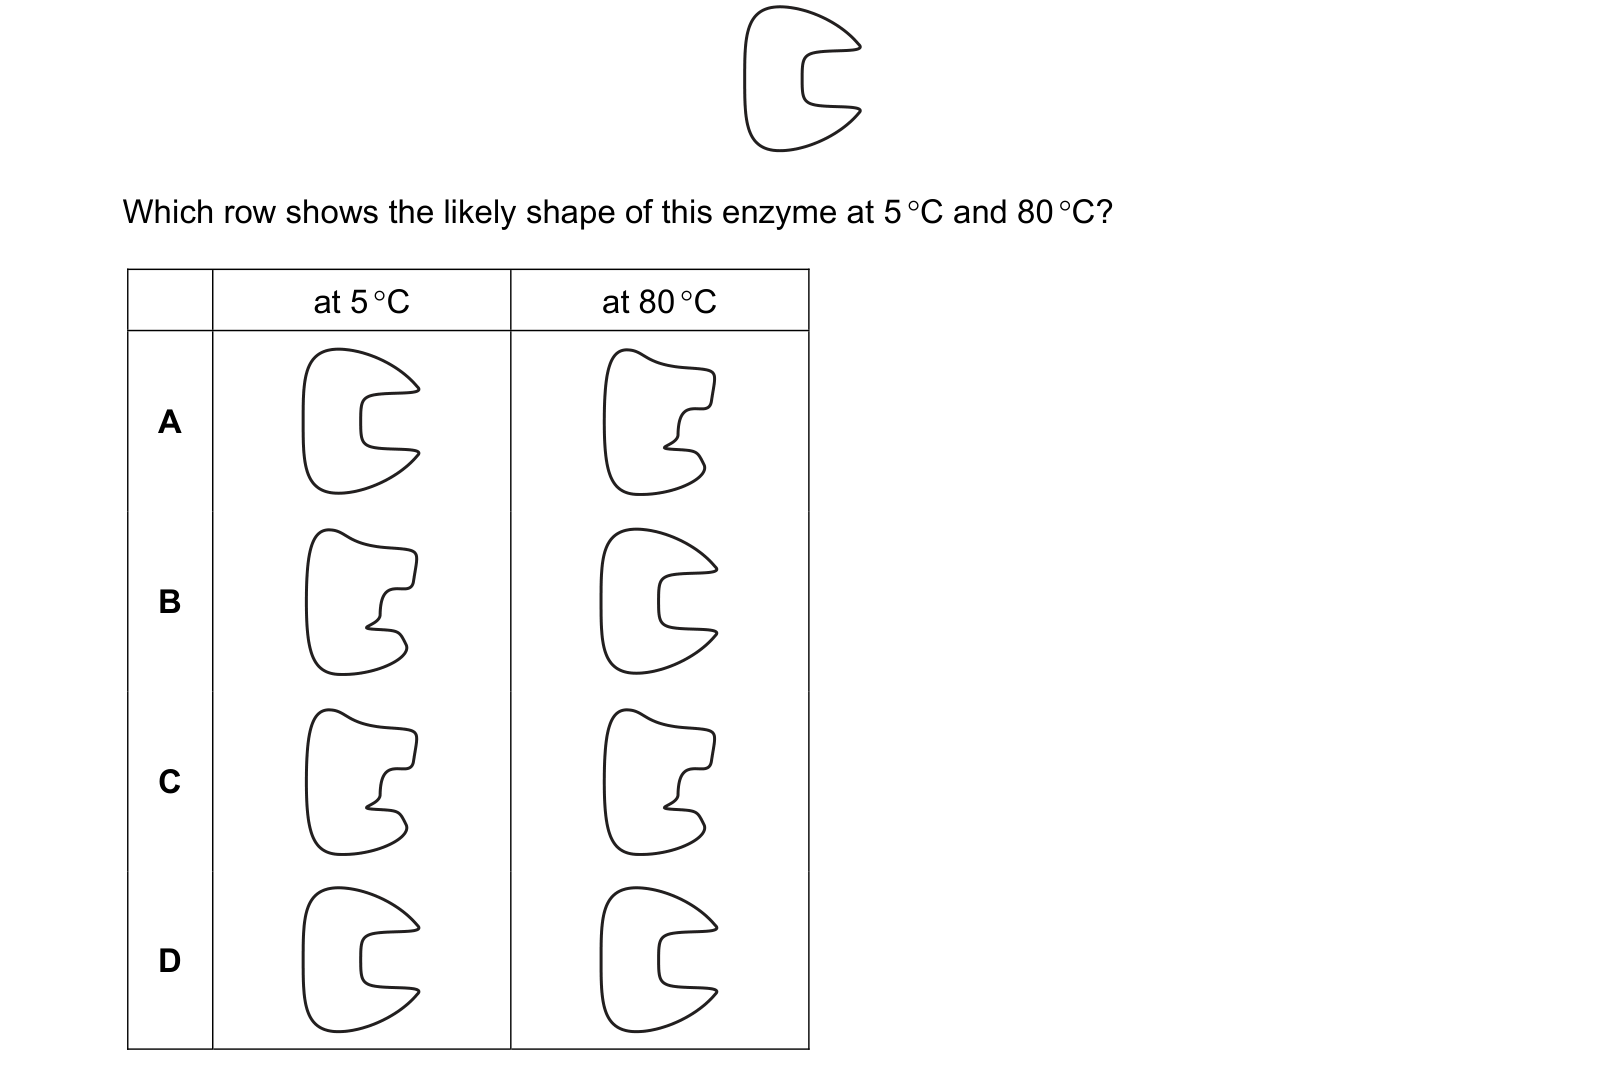
The diagram shows a functional human enzyme at 37 °C. Which row shows the likely shape of this enzyme at 5 °C and 80 °C? Use the source image for S24 Paper 23, question 4.
Answer: A.
Heat above the optimum denatures an enzyme, permanently changing the shape of its active site, whereas cold does not change the shape at all and merely slows the molecules down, so a chilled enzyme works again once it is warmed. At 5 degrees C the enzyme should therefore still be drawn with the same outline it has at 37 degrees C, and at 80 degrees C it should be drawn with the notch distorted. The row keeping the original shape at 5 degrees C and showing a distorted one at 80 degrees C is the only one that does both. The row with a distorted shape at 5 degrees C and the original shape at 80 degrees C has the two temperatures the wrong way round. The row distorting the shape at both temperatures treats cold as though it denatured as well, and the row leaving the shape unchanged at both denies that fierce heat affects an enzyme at all.
Question 2
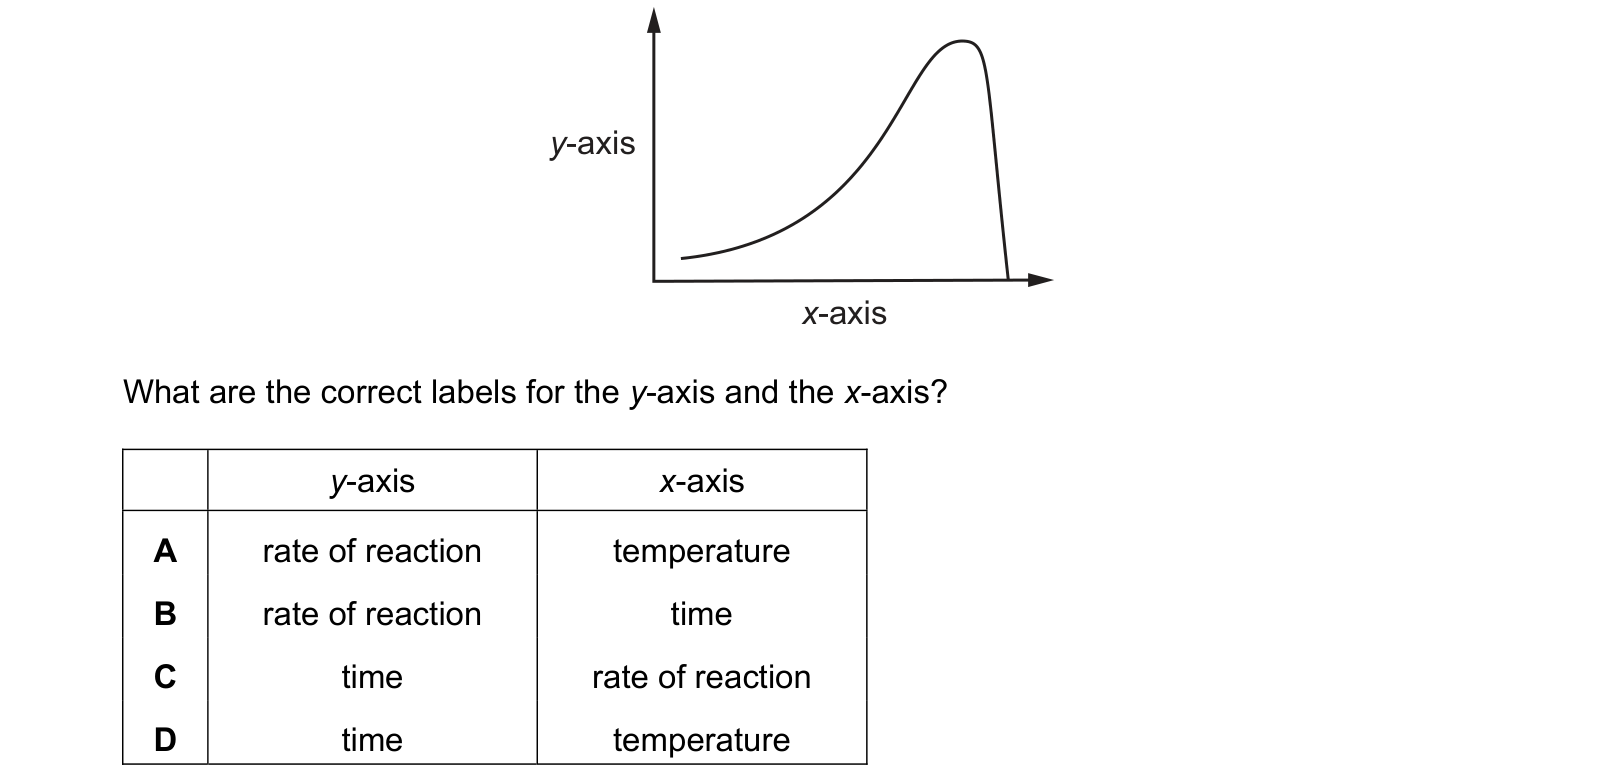
The graph shows the effect of increasing temperature on an enzyme-controlled reaction. What are the correct labels for the y-axis and the x-axis? Each answer gives, in order: y-axis; x-axis.
Answer: A.
The quantity that is deliberately changed goes on the horizontal axis and the quantity that responds goes on the vertical axis, and the stem says the temperature is being increased, so temperature belongs on the x-axis and the rate of reaction on the y-axis. The shape of the curve confirms it, since it climbs gently, then steeply, peaks at the optimum and drops almost vertically as the enzyme is denatured, which is the standard picture of rate against temperature. The row that keeps the rate on the y-axis but puts time along the bottom ignores the stem, because nothing here is being followed over time. The two rows that put time on the vertical axis make the measured response a duration rather than a rate, and a curve of time would not collapse to zero at high temperature the way this one does.
Question 3
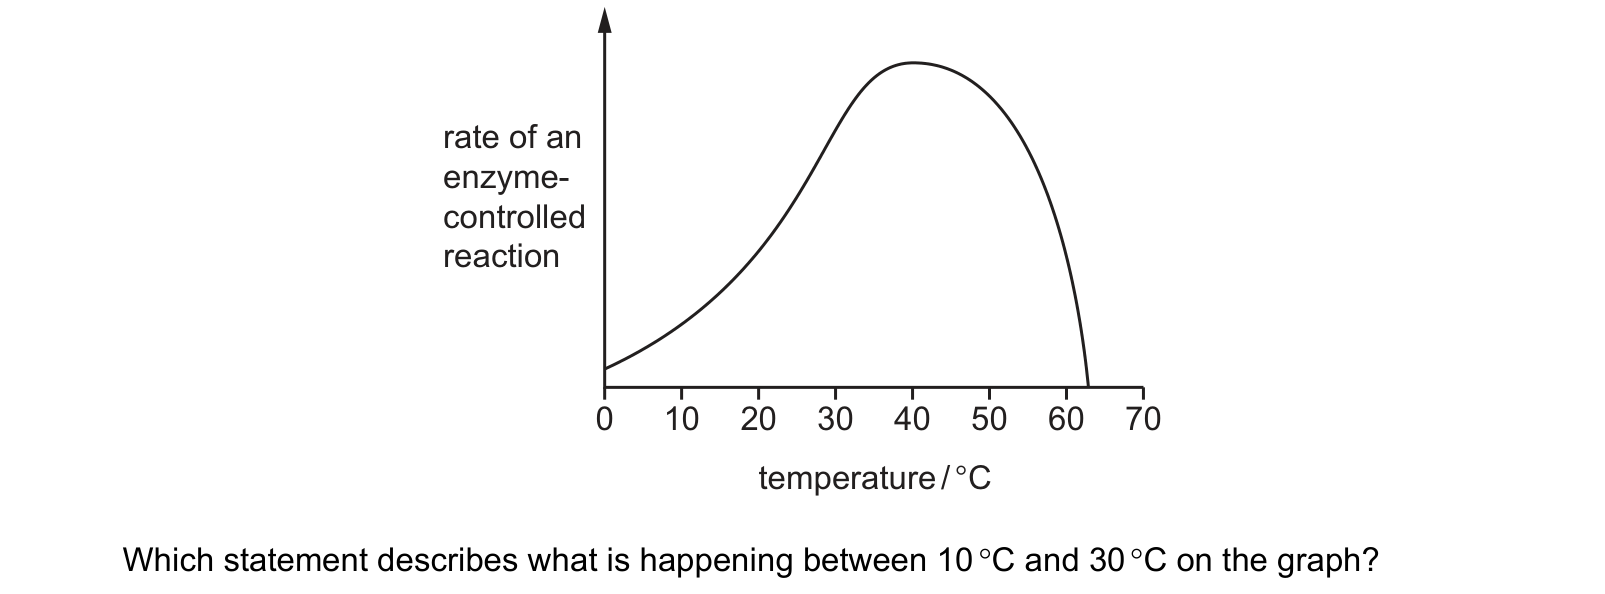
The graph shows the effect of increasing temperature on the rate of an enzyme-controlled reaction. temperature / °C Which statement describes what is happening between 10 °C and 30 °C on the graph?
Answer: D.
Between 10 and 30 degrees Celsius the graph climbs steadily, so the rate of the reaction rises as the temperature rises, and D states that relationship in the right order. Warming gives the enzyme and substrate molecules more kinetic energy, so they collide more often and more of those collisions form enzyme substrate complexes. A reverses cause and effect by making the reaction warm the mixture, whereas the temperature is set by the water bath and is the variable deliberately changed. B and C both claim the temperature has no effect, which the rising line contradicts directly, and were that true the graph would stay flat right across this stretch.
Question 4
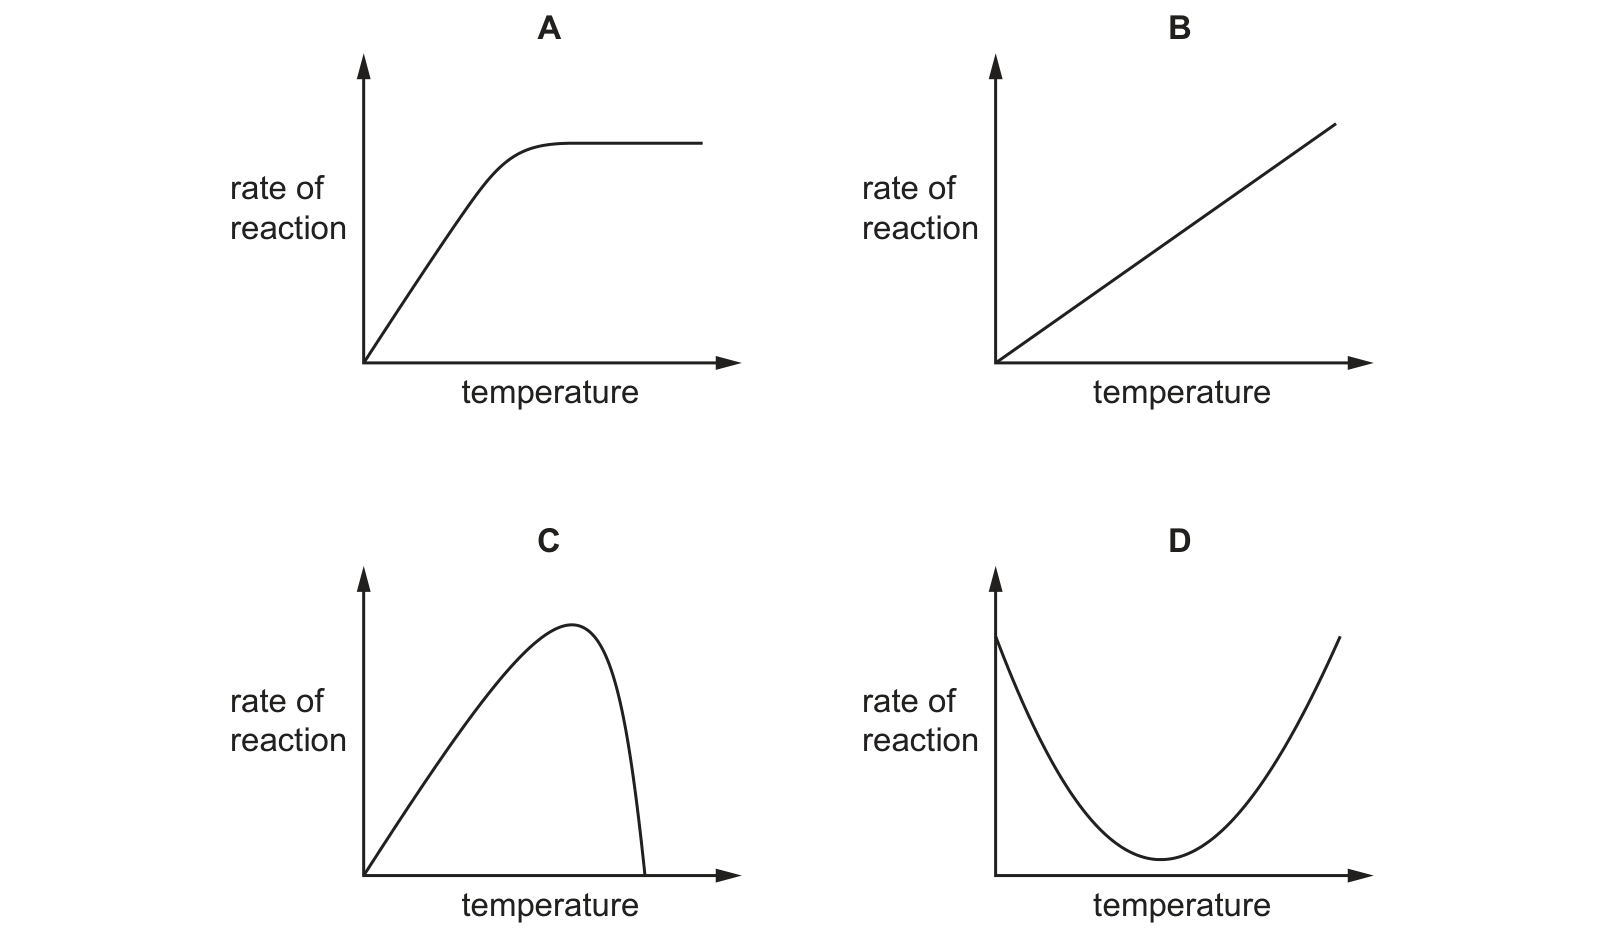
Which graph shows the effect of temperature on the rate of an enzyme-controlled reaction? Use the source image for S21 Paper 23, question 4.
Answer: C.
An enzyme-controlled reaction speeds up as the temperature rises, because enzyme and substrate molecules collide more often, and then falls steeply above the optimum because heat changes the shape of the active site until the substrate no longer fits. The graph that climbs to a peak and then drops sharply to zero is the only shape showing both halves of that story. The straight rising line has the reaction getting faster without limit, which would leave the enzyme working at temperatures that would destroy it. The line that rises and then flattens into a plateau describes a rate held back by something in short supply, such as substrate, rather than one killed off by heat. The curve that falls, bottoms out and climbs again would have the enzyme at its worst in the middle of the range and at its best at both extremes, which no protein does.
Question 5
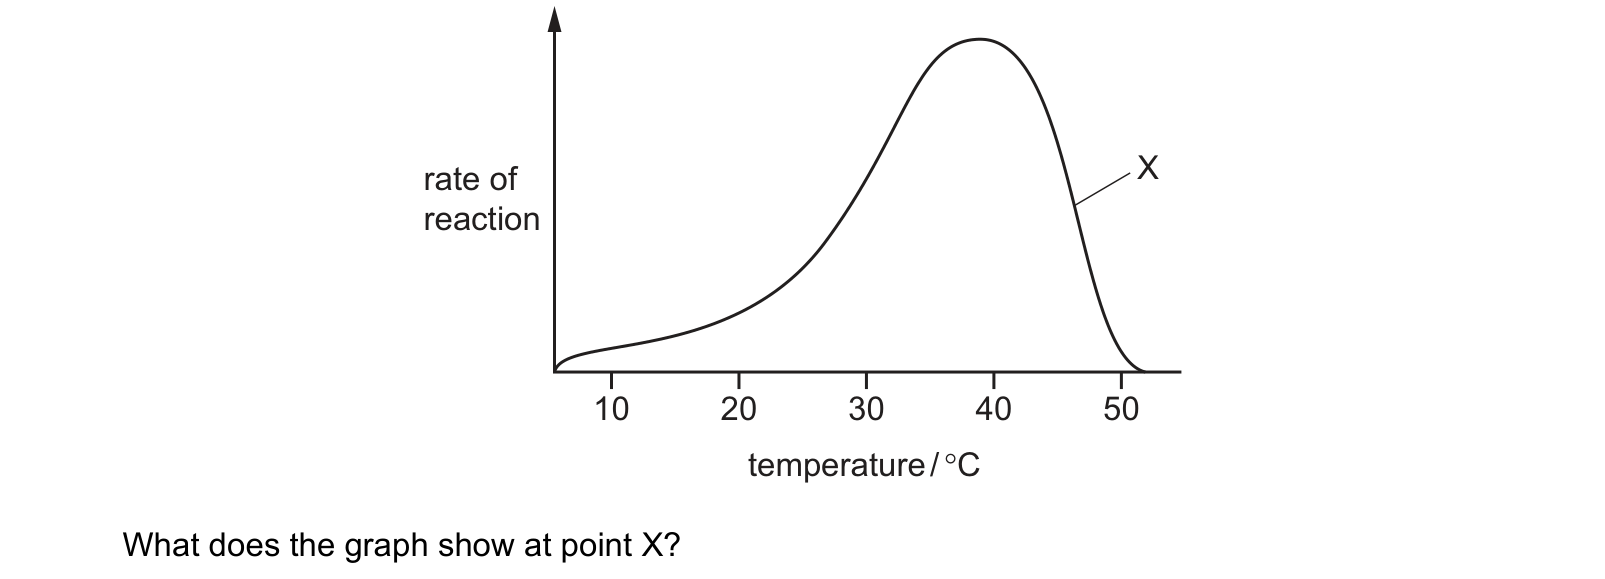
The graph shows the rate of reaction of salivary amylase at different temperatures. temperature / °C What does the graph show at point X?
Answer: D.
The curve rises to a peak near 38 degrees C and then falls steeply, and X sits on that falling side, above the peak. A rate that drops while the temperature keeps rising means the enzyme is past its optimum and the heat has begun to change the shape of its active site, which is what the point shows. Saying the enzyme has stopped working is too strong at X, because the curve there is still well above the axis and only reaches zero near 50 degrees C. Saying the reaction is nearly complete confuses the axes, since this graph plots rate against temperature rather than against time, so nothing is being used up along it. Saying the rate is controlled by pH introduces a variable the experiment held constant, when the only quantity changing here is the temperature.
These questions are drawn from past CIE 0654 Co-ordinated Sciences papers and filtered to enzymes. You answer, you find out immediately whether you were right, and you get the reasoning for the correct option and for each distractor. Wrong answers go to a mistakes locker so you can come back to exactly those.
Practice is free. You need an account only so your progress and your mistakes are still there next time.
These are the errors that cost marks on enzymes, taken from our own topic notes. Read them before you practise and you will recognise the traps in the questions.
Calling enzymes carbohydrates, fats or hormones. They are proteins.
Leaving nitrogen off the list of elements in an enzyme.
Saying enzymes are used up in the reaction.
Saying low temperatures denature enzymes. Low temperatures only slow them down.
Explaining the fall after the optimum by "fewer collisions". Collisions are more frequent; the active site has changed shape.
Saying a denatured enzyme recovers on cooling.
Saying the active site is the same shape as the substrate rather than complementary to it.
Saying the substrate is denatured.
Revise it first
If any of the above is unfamiliar, work through the notes before practising: Enzymes revision notes.