Photosynthesis
Contents: 8 sections
Cambridge International AS & A Level Biology 9700 · A Level
Every objective in this topic is printed under "A Level subject content" in the 9700 syllabus, so all of it is A Level and none of it is AS. It is examined on Paper 4, with the practical objectives feeding Paper 5. Paper 1 is the AS multiple-choice paper and does not reach this topic, so there is no multiple-choice practice on this site tagged to it.
The chloroplast, read as a machine
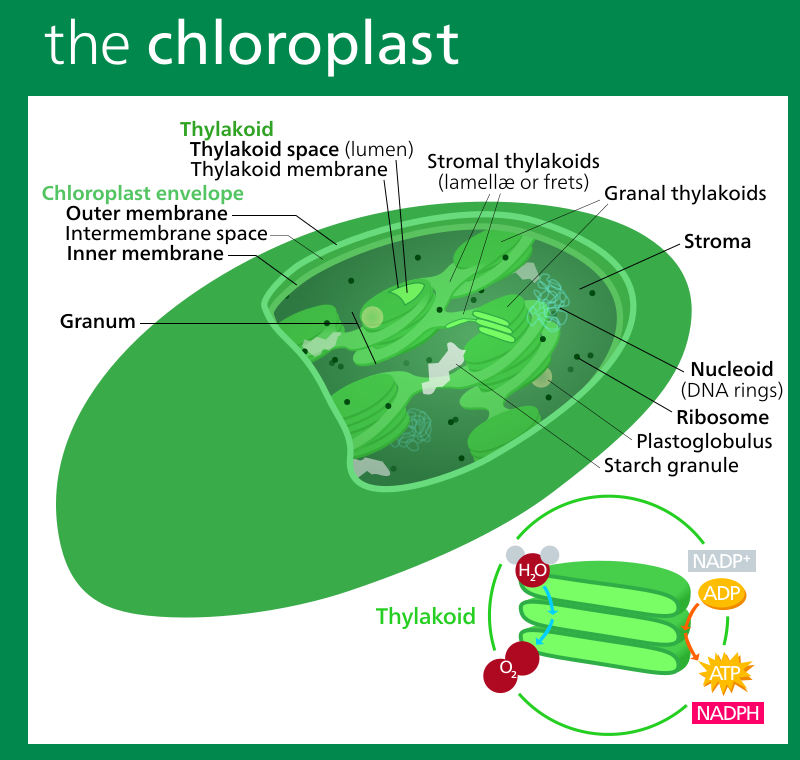
A chloroplast has a double envelope, an internal membrane system of flattened sacs called thylakoids stacked into grana, and a fluid stroma around them. Each feature exists for a reason:
- Thylakoid membranes carry the photosystems, the electron carriers and ATP synthase. Stacking them into grana packs an enormous membrane area into a small volume, so a great many photosystems can be held facing the light.
- The thylakoid space is a small enclosed compartment. A small volume means protons pumped into it build a steep gradient quickly, exactly as the intermembrane space of a mitochondrion does.
- The stroma holds the enzymes of the Calvin cycle, including rubisco, along with starch grains, lipid droplets, chloroplast DNA and 70S ribosomes.
Placing the two stages correctly is worth a mark on its own: light-dependent in the thylakoids, light-independent in the stroma. The two are joined by ATP and reduced NADP diffusing the short distance from one to the other.
Pigments, absorption and action spectra
Four pigments are named. Chlorophyll a is the primary pigment, sitting at the reaction centre of each photosystem. Chlorophyll b, carotene and xanthophyll are accessory pigments: they absorb wavelengths that chlorophyll a absorbs poorly and pass the energy on to it. A wider range of pigments means a wider range of usable wavelengths, and therefore more photosynthesis from the same light.
Two graphs are examined and they are easy to confuse:
- An absorption spectrum plots how much light a pigment absorbs against wavelength. It is a property of the pigment, measured in a test tube.
- An action spectrum plots the rate of photosynthesis against wavelength. It is a property of the whole plant.
The two have peaks in the blue-violet region and in the red region, with a trough in the green, which is why leaves look green: green light is reflected and transmitted rather than absorbed. The similarity in shape is the evidence that the pigments in the absorption spectrum are the ones driving photosynthesis. The mismatches are informative too. An action spectrum is usually broader and higher in the region between the peaks than the absorption spectrum of chlorophyll a alone, because the accessory pigments are absorbing there.
Separating the pigments by chromatography
Grind leaf tissue with a little sand and a small volume of propanone, spot the extract repeatedly onto the origin line of the chromatography paper letting it dry between spots, and run it in a solvent with the origin above the solvent level. The pigments separate because each has a different solubility in the solvent and a different attraction to the paper.
Each pigment is identified by its Rf value:
Rf = distance moved by the pigment / distance moved by the solvent front
Worked example. The solvent front travels 92 mm from the origin. A yellow-orange spot has travelled 87 mm.
Rf = 87 / 92 = 0.95
which matches carotene, the most soluble of the four in the usual solvent and therefore the one that runs furthest. Rf is always less than 1, so an answer above 1 means the two distances have been divided the wrong way round, and both distances must be measured from the origin line to the centre of the spot.
The light-dependent stage
Light is absorbed by a photosystem and its energy is funnelled to the chlorophyll a at the reaction centre. An electron in that chlorophyll absorbs the energy and is raised to a higher energy level, where it is captured by an electron acceptor. This is photoactivation.
Non-cyclic photophosphorylation
Both photosystems are involved and the electrons travel in one direction, from water to NADP.
- Light strikes PS II. An electron is photoactivated and passed to the electron transport chain.
- PS II is now short of an electron. It is replaced by the photolysis of water, catalysed by the oxygen-evolving complex:
2H₂O → 4H⁺ + 4e⁻ + O₂
This is the source of every molecule of oxygen a plant releases, and of the protons that build the gradient.
- As the electron passes down the chain it releases energy, which is used to transfer protons from the stroma into the thylakoid space.
- Protons flow back into the stroma through ATP synthase, and that flow drives ATP synthesis. This is chemiosmosis, the same mechanism as in the mitochondrion.
- The electron arrives at PS I, where it is photoactivated a second time and passed, along with a proton, to NADP, forming reduced NADP.
Products: ATP, reduced NADP and oxygen.
Cyclic photophosphorylation
Only PS I is involved. The photoactivated electron passes down a short chain and returns to the same chlorophyll molecule it left. Protons are still pumped and ATP is still made, but no water is split, so there is no oxygen and no reduced NADP.
The point of having both is balance. The Calvin cycle needs more ATP than reduced NADP, and cyclic photophosphorylation tops up the ATP without producing reduced NADP the cycle cannot use.
The Calvin cycle
Three stages, all in the stroma, all running in the light and the dark provided ATP and reduced NADP are available.
- Fixation. Rubisco catalyses the combination of carbon dioxide with ribulose bisphosphate (RuBP), a 5C compound. The 6C product is unstable and splits at once into two molecules of glycerate 3-phosphate (GP), a 3C compound.
- Reduction. GP is reduced to triose phosphate (TP) using reduced NADP as the reducing agent and ATP as the energy source. Both come from the light-dependent stage, and this is the only step that uses reduced NADP.
- Regeneration. Five out of every six TP are used, with more ATP, to regenerate RuBP so the cycle can continue. The sixth leaves the cycle.
The arithmetic of that last point is the part students most often miss, and it follows from the carbon count.
Worked example. Six turns of the cycle fix six CO₂.
carbon in = 6 × 1 = 6
Six turns produce twelve GP and therefore twelve TP:
carbon in TP = 12 × 3 = 36
RuBP must be regenerated for the next six turns:
carbon needed for RuBP = 6 × 5 = 30
so the carbon available to leave the cycle is
36 - 30 = 6
which is two molecules of TP. Six turns, six carbon dioxide fixed, and one 6C sugar produced. The cycle is not inefficient; it is simply that most of the TP is committed to keeping the acceptor supply going.
What the intermediates become. GP is used to make some amino acids. TP is used to make carbohydrates, lipids and amino acids. Glucose, sucrose, starch and cellulose all trace back to TP.
Limiting factors
At any moment the rate of photosynthesis is set by whichever factor is in shortest supply. Three are named: light intensity, carbon dioxide concentration and temperature.
The characteristic graph rises steeply, then levels off. On the steep part the factor on the x-axis is limiting, so increasing it increases the rate. On the plateau something else has become limiting, so increasing it does nothing.
- Light intensity. More light means more photoactivation, so more ATP and reduced NADP, so faster reduction of GP. When light stops being limiting the plateau is set by carbon dioxide or temperature.
- Carbon dioxide concentration. More carbon dioxide means more fixation by rubisco. Atmospheric concentration is around 0.04 per cent, which is low enough that carbon dioxide is very often the limiting factor in a well lit field. This is why commercial greenhouses are enriched to roughly 0.1 per cent.
- Temperature. Rate rises with temperature because the enzymes of the Calvin cycle work faster, then falls sharply above the optimum as they denature. The light-dependent stage is far less temperature-sensitive, because photoactivation is a physical process rather than an enzyme-catalysed one. A curve that falls off steeply above about 40 °C is therefore telling you the light-independent stage is the part being damaged.
A quick way to read an unfamiliar graph: two curves at different carbon dioxide concentrations that lie on top of each other at low light and separate at high light show that light is limiting on the left and carbon dioxide on the right.
What happens to GP and RuBP when a factor changes
This is the classic data question and it is answerable by thinking about which step stops.
- Light removed. No ATP and no reduced NADP, so GP cannot be reduced. Fixation continues briefly. GP rises, RuBP falls, TP falls.
- Carbon dioxide removed. Nothing to fix, so GP is not made, but the GP already present is still being reduced and RuBP is still being regenerated. GP falls, RuBP rises.
Investigating the rate
With a chloroplast suspension and a redox indicator (the Hill reaction). Isolate chloroplasts by grinding leaf tissue in ice-cold isotonic buffer and centrifuging. Add DCPIP, which is blue when oxidised and colourless when reduced. In the light, electrons from the light-dependent stage reduce the DCPIP instead of reducing NADP, so the blue colour disappears. The time taken for the colour to go, or the change in absorbance measured with a colorimeter, is the measure of rate.
Vary the lamp distance to vary light intensity, or place coloured filters in front of the lamp to vary wavelength. Keep the temperature constant with a heat shield or a water bath between lamp and sample, because a lamp brought closer also warms the sample and would confound the two variables.
When light intensity is the variable, remember it follows an inverse square law with distance, so the readings are not evenly spaced in intensity even when the distances are.
With a whole aquatic plant. Elodea or Cabomba in hydrogencarbonate solution releases bubbles of oxygen. Count bubbles per minute, or better, collect the gas in a capillary tube and measure the length of the column, since bubbles vary in size. Vary lamp distance for light intensity, hydrogencarbonate concentration for carbon dioxide, or the water bath for temperature.
Worked example. A plant releases a gas column 45 mm long in 5 minutes.
rate = 45 / 5 = 9 mm min⁻¹
Moving the lamp from 20 cm to 10 cm halves the distance, so the intensity is roughly four times greater, and if light was the limiting factor the rate should rise steeply. If it barely moves, light was not limiting.
Common mistakes
- Swapping the two sites, putting the Calvin cycle in the thylakoids or the light-dependent stage in the stroma.
- Saying the light-independent stage happens at night. It happens whenever ATP and reduced NADP are available, which in practice means in the light, and it is called light-independent because light is not used directly.
- Confusing NADP with NAD. Respiration uses NAD and FAD; photosynthesis uses NADP.
- Saying the oxygen released comes from carbon dioxide. It comes from the photolysis of water.
- Describing cyclic photophosphorylation as producing reduced NADP or oxygen. It produces ATP only.
- Confusing an absorption spectrum with an action spectrum, or saying chlorophyll absorbs green light strongly.
- Saying leaves are green because chlorophyll absorbs green light. They are green because it does not.
- Forgetting that five of every six TP are needed to regenerate RuBP, and claiming one turn of the cycle makes a glucose.
- Getting the GP and RuBP changes the wrong way round when light or carbon dioxide is withdrawn.
- Dividing the wrong way in an Rf calculation and reporting a value greater than 1.
- Counting bubbles as a measure of oxygen production without acknowledging that bubbles differ in size.
- Moving a lamp closer to raise light intensity without controlling the heating that comes with it.
What the syllabus asks for on this topicSyllabus points
Syllabus points
13.1 Photosynthesis as an energy transfer process
- Describe the relationship between the structure of chloroplasts, as shown in diagrams and electron micrographs, and their function.
- Explain that energy transferred as ATP and reduced NADP from the light-dependent stage is used during the light-independent stage (Calvin cycle) of photosynthesis to produce complex organic molecules.
- State that within a chloroplast, the thylakoids (thylakoid membranes and thylakoid spaces), which occur in stacks called grana, are the site of the light-dependent stage and the stroma is the site of the light-independent stage.
- Describe the role of chloroplast pigments (chlorophyll a, chlorophyll b, carotene and xanthophyll) in light absorption in thylakoids.
- Interpret absorption spectra of chloroplast pigments and action spectra for photosynthesis.
- Describe and use chromatography to separate and identify chloroplast pigments (reference should be made to Rf values in the identification of chloroplast pigments).
- State that cyclic photophosphorylation and non-cyclic photophosphorylation occur during the light-dependent stage of photosynthesis.
- Explain that in cyclic photophosphorylation: only photosystem I (PS I) is involved; photoactivation of chlorophyll occurs; ATP is synthesised.
- Explain that in non-cyclic photophosphorylation: photosystem I (PS I) and photosystem II (PS II) are both involved; photoactivation of chlorophyll occurs; the oxygen-evolving complex catalyses the photolysis of water; ATP and reduced NADP are synthesised.
- Explain that during photophosphorylation: energetic electrons release energy as they pass through the electron transport chain (details of carriers are not expected); the released energy is used to transfer protons across the thylakoid membrane; protons return to the stroma from the thylakoid space by facilitated diffusion through ATP synthase, providing energy for ATP synthesis (details of ATP synthase are not expected).
- Outline the three main stages of the Calvin cycle: rubisco catalyses the fixation of carbon dioxide by combination with a molecule of ribulose bisphosphate (RuBP), a 5C compound, to yield two molecules of glycerate 3-phosphate (GP), a 3C compound; GP is reduced to triose phosphate (TP) in reactions involving reduced NADP and ATP; RuBP is regenerated from TP in reactions that use ATP.
- State that Calvin cycle intermediates are used to produce other molecules, limited to GP to produce some amino acids and TP to produce carbohydrates, lipids and amino acids.
13.2 Investigation of limiting factors
- State that light intensity, carbon dioxide concentration and temperature are examples of limiting factors of photosynthesis.
- Explain the effects of changes in light intensity, carbon dioxide concentration and temperature on the rate of photosynthesis.
- Describe and carry out investigations using redox indicators, including DCPIP and methylene blue, and a suspension of chloroplasts to determine the effects of light intensity and light wavelength on the rate of photosynthesis.
- Describe and carry out investigations using whole plants, including aquatic plants, to determine the effects of light intensity, carbon dioxide concentration and temperature on the rate of photosynthesis.
Related CIE 9700 Biology topics
Not the topic you were looking for? Describe what you are stuck on in your own words and we will take you to the notes that answer it.