Efficiency ratios
Contents: 7 sections
The ratios
Inventory turnover period = average inventory / cost of sales x 365 days
Rate of inventory turnover = cost of sales / average inventory, expressed as "times per year"
Trade receivables turnover period = trade receivables / credit sales x 365 days
Trade payables turnover period = trade payables / credit purchases x 365 days
Non-current asset turnover = revenue / non-current assets, expressed as "times"
Two points about the inputs decide whether the answer is right.
Inventory is measured against cost of sales, not revenue, because inventory is held at cost and the two figures must be on the same basis. Receivables and payables are measured against credit sales and credit purchases, because cash customers never became receivables. If the question gives only a total sales figure, say that you have used it and that the period will be understated.
Average inventory is opening plus closing, divided by two. If only the closing figure is given, use it and say so.
A worked set
Cost of sales $292 000, opening inventory $38 000, closing inventory $42 000. Credit sales $365 000 with trade receivables of $50 000. Credit purchases $200 000 with trade payables of $30 000.
Average inventory is 38 000 plus 42 000, divided by 2, which is $40 000. The inventory turnover period is 40 000 over 292 000, times 365, which is 50 days. The rate of turnover is 292 000 over 40 000, which is 7.3 times.
The receivables period is 50 000 over 365 000, times 365, which is 50 days. The payables period is 30 000 over 200 000, times 365, which is 54.75 days, so about 55 days.
Reading them
Inventory period. A shorter period usually means goods sell quickly and less cash is tied up. Too short can mean stock levels are so lean that sales are lost to stockouts. A lengthening period suggests falling demand, obsolete lines, or over-buying. Compare only within an industry: a baker measures this in days and a jeweller in months, and neither is doing anything wrong.
Receivables period. Shorter is generally better, since cash arrives sooner and the risk of non-payment falls. Compare it with the credit terms the business offers: 50 days against terms of 30 days means credit control is weak. Too short can mean terms so tight that customers go elsewhere.
Payables period. Longer means the business is financing itself with free supplier credit. Too long risks losing cash discounts, damaging the relationship, and having supply withdrawn or put on cash terms only.
Non-current asset turnover. How much revenue each dollar of assets generates. A low figure suggests underused capacity or a recent large purchase not yet earning.
The comparison that carries the marks
Set the receivables period against the payables period.
In the worked figures above, customers pay in 50 days and suppliers are paid in 55. The business collects before it pays, so supplier credit is funding the receivables, which eases liquidity. Reverse those numbers and the business would be paying out before collecting, and would need an overdraft to bridge the gap.
The full working capital cycle is inventory period plus receivables period less payables period. Here it is 50 plus 50 less 55, which is 45 days of trading that must be financed from somewhere other than trade credit. Shortening any of the three shortens the cycle and releases cash.
How the three families connect
Efficiency ratios explain what the profitability and liquidity ratios only report.
- A lengthening inventory period ties cash up and worsens the liquid ratio, and if the goods are becoming obsolete it will damage the gross margin when they are eventually written down.
- A lengthening receivables period worsens liquidity and raises the risk of irrecoverable debts, which is an expense and so cuts the profit margin.
- Stretching payables improves the current ratio's denominator in the short run while storing up the loss of discounts, which raises purchase costs and cuts gross margin.
- Rising asset turnover raises ROCE without any change in margin, since ROCE is margin multiplied by asset turnover.
Answers that make one of these links score well above answers that report each ratio in isolation.
Common mistakes
- Using revenue instead of cost of sales in the inventory ratios.
- Using total sales when credit sales are given.
- Multiplying by 12 and calling the answer days, or by 365 and calling it months.
- Confusing the inventory turnover period in days with the rate of turnover in times per year. They are reciprocals of each other.
- Saying a shorter receivables period is always better, with no mention of losing customers.
- Ignoring the credit terms actually offered when judging the receivables period.
- Reporting each ratio separately and never connecting them.
Check you have it
Question 1
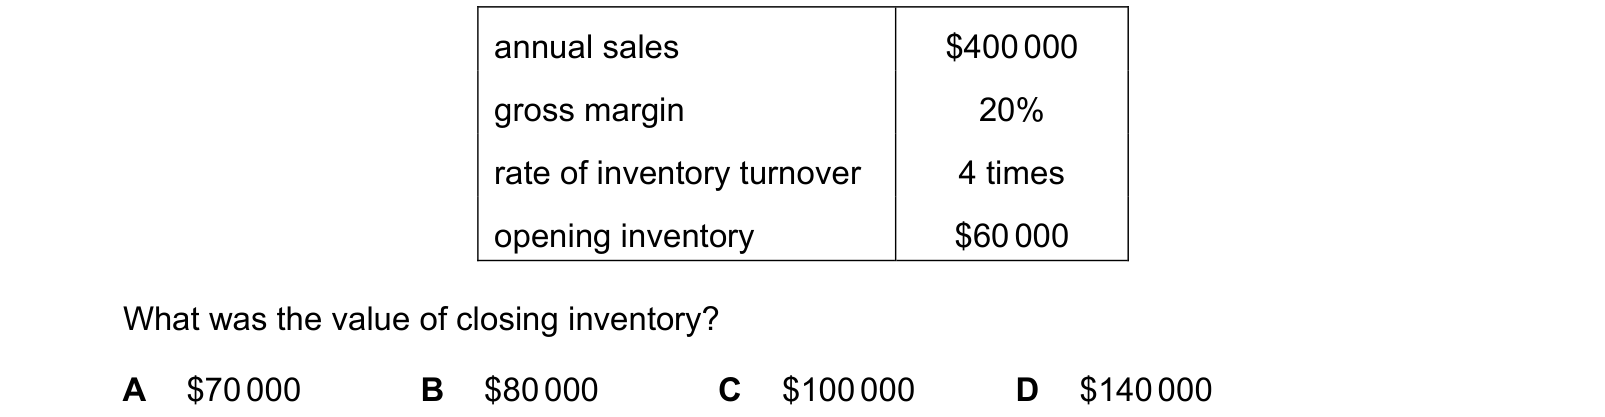
The following information was available for a business for the year ended 31 December.
annual sales $400 000
gross margin 20%
rate of inventory turnover 4 times
opening inventory $60 000
What was the value of closing inventory?
Answer: C.
Question 2
A company buys and sells all of its inventory on a credit basis.
The following information is available. $ purchases 450 000
sales 500 000
trade payables 80 000
trade receivables 120 000
Which period of credit was taken by customers?

Answer: C.
Question 3
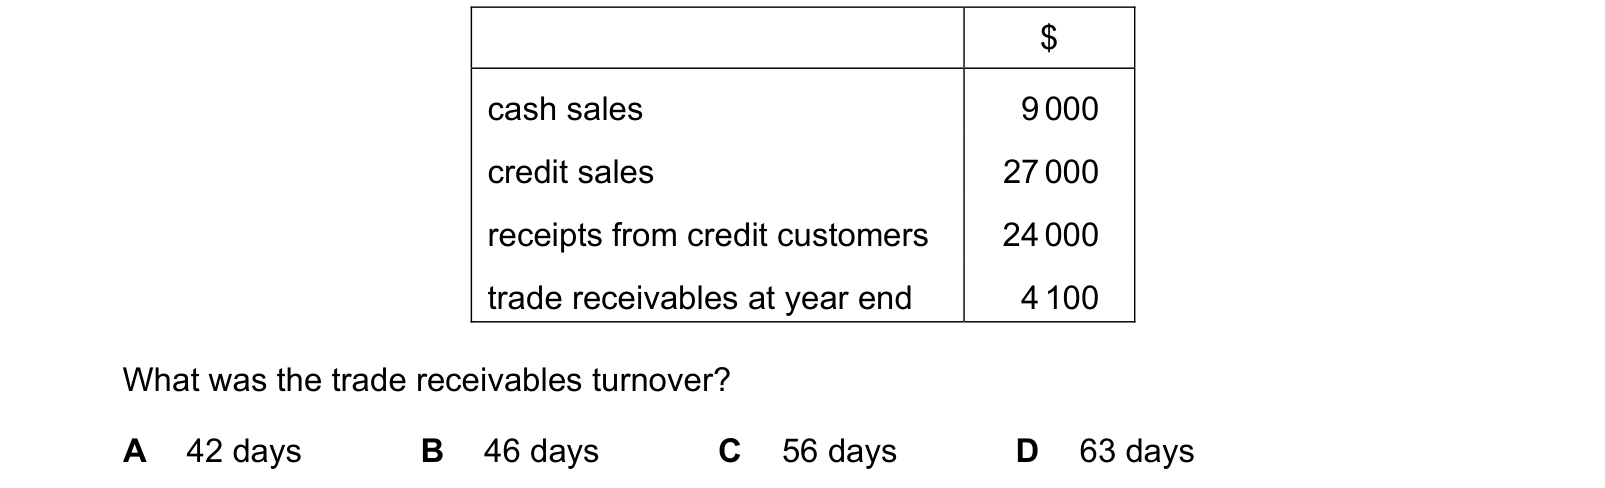
A company provided the following information at the end of its first year of trading. $ cash sales 9 000
credit sales 27 000
receipts from credit customers 24 000
trade receivables at year end 4 100
What was the trade receivables turnover?
Answer: C.
What the syllabus asks for on this topicSyllabus points
Syllabus points
- Calculate the turnover periods for inventory, trade receivables and trade payables.
- Calculate rate of inventory turnover and non-current asset turnover.
- Interpret the efficiency ratios and link them to liquidity and profitability.
Related CIE 9706 Accounting topics
Not the topic you were looking for? Describe what you are stuck on in your own words and we will take you to the notes that answer it.