Cost-volume-profit analysis
Contents: 8 sections
The formulas
Contribution per unit = selling price per unit − variable cost per unit
Contribution to sales ratio (C/S ratio) = contribution / revenue, as a percentage. It is also called the profit-volume ratio.
Break-even in units = fixed costs / contribution per unit
Break-even in revenue = fixed costs / C/S ratio
Units for a target profit = (fixed costs + target profit) / contribution per unit
Margin of safety = budgeted sales − break-even sales
Margin of safety as a percentage = margin of safety / budgeted sales x 100
Only one idea sits behind all of them. Each unit sold contributes a fixed amount towards the fixed costs; break-even is the point where enough units have been sold to cover them exactly, and every unit after that is profit.
A worked set
Selling price $50, variable cost $30, fixed costs $180 000, budgeted sales 12 000 units.
Contribution per unit is 50 minus 30, which is $20. The C/S ratio is 20 over 50, which is 40%.
Break-even in units is 180 000 divided by 20, which is 9 000 units. Break-even in revenue is 9 000 times 50, which is $450 000, and the same figure comes from 180 000 divided by 0.4, which confirms it.
The margin of safety is 12 000 minus 9 000, which is 3 000 units, or 3 000 over 12 000, which is 25% of budgeted sales.
Budgeted profit is contribution of 12 000 times 20, which is $240 000, less fixed costs of $180 000, giving $60 000. The same figure comes from the margin of safety: 3 000 units past break-even, each contributing $20, is $60 000. That second route is worth knowing, because it is what the margin of safety actually means.
Output for a target profit of $90 000 is (180 000 plus 90 000) divided by 20, which is 13 500 units.
Which formula when
Use the per unit version where the question is about a single product and gives a price and a variable cost.
Use the C/S ratio version where the answer is wanted in revenue, or where there are several products and only totals are given. It is the only way to handle a multi-product break-even, and it then assumes the sales mix stays constant.
The charts
Break-even chart. Output on the horizontal axis, costs and revenue in money on the vertical.
- The fixed cost line is horizontal.
- The total cost line starts at the fixed cost on the vertical axis and slopes upwards.
- The revenue line starts at the origin, because no sales means no revenue.
- The lines cross at the break-even point. The gap between them is a loss to the left and a profit to the right.
- The margin of safety is the horizontal distance from break-even to the budgeted output.
The revenue line starting at the origin while the total cost line starts higher up is what makes the chart work, and drawing either one from the wrong place is the usual error.
Profit-volume chart. Output on the horizontal axis, profit or loss on the vertical.
- A single line starts at minus the fixed costs where output is zero, since with no sales the business loses its whole fixed cost.
- It rises with a slope equal to the contribution per unit.
- It crosses the horizontal axis at the break-even point.
The profit-volume chart shows profit at any output directly, which the break-even chart only shows as a gap between two lines. The break-even chart shows costs and revenues separately, which the profit-volume chart hides. Say which one suits the question rather than treating them as interchangeable.
Assumptions and limitations
Each assumption is also the limitation, so a question asking for either can be answered from the same list.
- Costs split cleanly into fixed and variable. In practice semi-variable costs must be estimated, and the estimate may be wrong.
- Both lines are straight. Real revenue per unit falls when prices are cut to sell more, and real variable cost per unit falls with bulk discounts.
- Fixed costs are constant. They are stepped in reality, so a large increase in output adds a whole new block of cost.
- Everything produced is sold, so production equals sales and inventory does not change.
- The sales mix is constant in a multi-product business. Change the mix and the break-even point changes even if total sales do not.
- Only volume affects cost, ignoring efficiency, learning effects and inflation.
- It is short term, and it is static: one chart applies to one set of prices and costs.
The honest summary is that cost-volume-profit analysis is a good guide within the relevant range and a poor prediction outside it.
What changes what
Questions often ask what happens to break-even when one thing moves. The answer follows from the formula.
| Change | Break-even point |
|---|---|
| Fixed costs rise | Rises |
| Selling price rises | Falls |
| Variable cost per unit rises | Rises |
| A fixed cost becomes variable | Falls |
| Sales volume rises | No change |
The last row catches people out. Selling more does not move the break-even point at all; it only increases the margin of safety.
Common mistakes
- Dividing fixed costs by the selling price instead of by the contribution.
- Using the C/S ratio and reporting the answer in units, or the reverse.
- Drawing the revenue line from the fixed cost level rather than from the origin.
- Starting the profit-volume line at zero instead of at minus the fixed costs.
- Saying break-even falls when sales volume rises.
- Listing assumptions without saying why each one limits the technique.
- Forgetting to add the target profit to fixed costs before dividing.
Check you have it
Question 1
Which statements are true about the preparation of a break-even chart?
1 Costs are easily classified into fixed and variable.
2 Fixed costs always change as output changes.
3 The break-even point is clearly seen.

Answer: D.
Question 2
A company has the following budgeted information per unit. Fixed costs are $72 000.
What is the increase in break-even sales if fixed costs increase by 33 %?
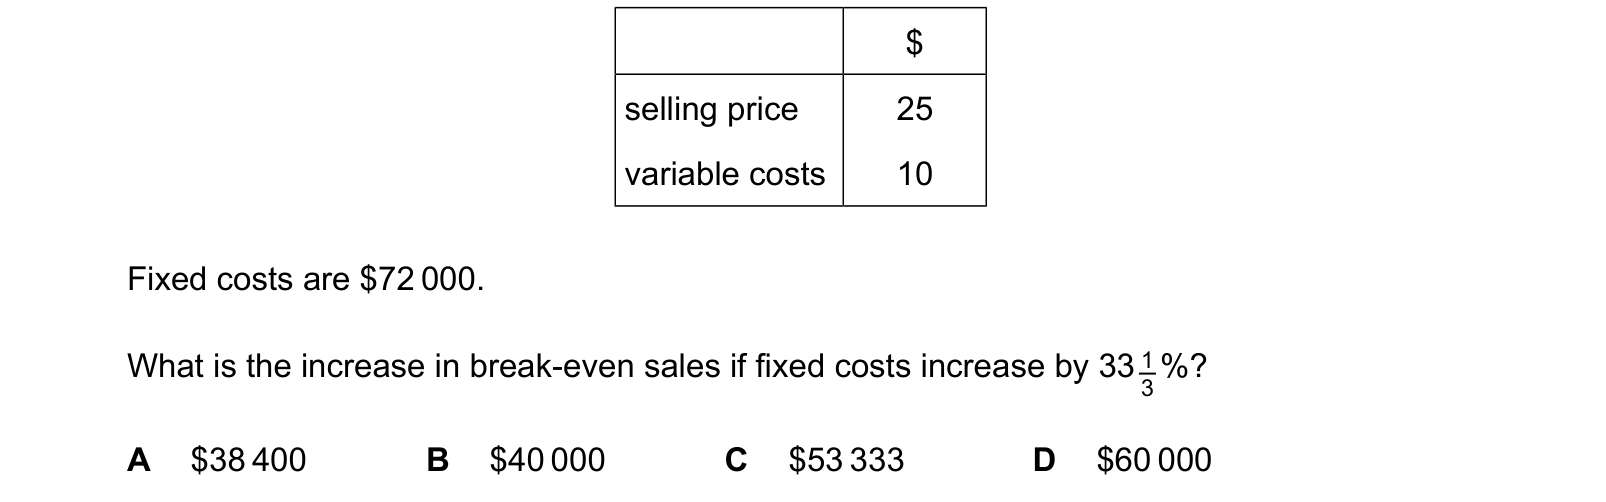
Answer: B.
Question 3
A business provides the following information.
break-even point 4500 units
unit selling price $50
contribution to sales ratio 40%
What is the effect on the break-even point if the unit selling price is increased by 10%?

Answer: D.
What the syllabus asks for on this topicSyllabus points
Syllabus points
- Calculate break-even point, margin of safety and target profit output.
- Calculate and use the contribution to sales ratio.
- Draw and interpret a break-even chart and a profit-volume chart.
- Explain the assumptions and limitations of cost-volume-profit analysis.
Related CIE 9706 Accounting topics
Not the topic you were looking for? Describe what you are stuck on in your own words and we will take you to the notes that answer it.