Economic Growth
Contents: 10 sections
Actual versus potential growth
Economic growth is an increase in real GDP over time. The word real matters: nominal GDP can rise purely because prices rose, which is not growth in output at all.
The syllabus requires a clear distinction, and it is the backbone of most answers on this topic:
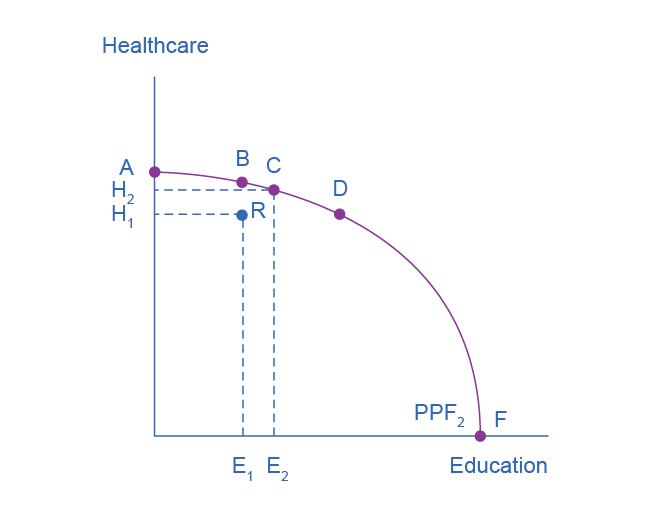
- Actual growth: an increase in real output actually produced. It means using existing capacity more fully, so it is possible only if there is spare capacity. On the PPC; it is a movement from a point inside the curve towards the curve. On AD–AS; it is a rightward shift of AD along an upward-sloping SRAS.
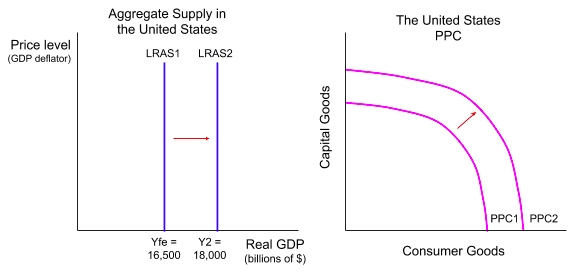
- Potential growth: an increase in the economy's productive capacity, whether or not output actually rises. On the PPC; it is an outward shift of the whole curve. On AD–AS; it is a rightward shift of LRAS.
The distinction has a direct policy consequence: demand-side policy can deliver actual growth but cannot raise potential output. Only supply-side improvements shift the frontier.
Illustrating growth
| Diagram | Actual growth | Potential growth |
|---|---|---|
| PPC | Movement from inside the curve towards it | Outward shift of the curve |
| AD–AS | AD shifts right along SRAS | LRAS (and long-run capacity) shifts right |
A point inside the PPC represents unemployed or underused resources. Moving to the curve raises output without any new resources, which is why recovering from a recession is growth, but not the same kind of growth as inventing a better technology.
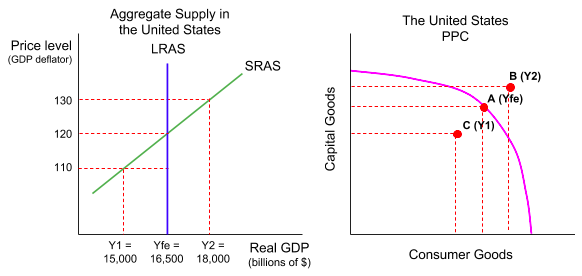
The capital goods versus consumer goods version of the PPC is the most useful one here, because it shows the trade-off that drives long-run growth directly. Choosing more capital goods today means fewer consumer goods today, but capital is itself a factor of production, so the frontier shifts further out tomorrow. Present consumption is the opportunity cost of future growth.
Measuring growth
Growth rate = (real GDP this year − real GDP last year) ÷ real GDP last year × 100
Real GDP = (nominal GDP ÷ price index) × 100
GDP per capita = real GDP ÷ population
Worked calculation. An economy's nominal GDP rises from \$750bn to \$810bn while its price index rises from 100 to 104.
Real GDP this year = (810 ÷ 104) × 100 = \$778.8bn
Real growth = (778.8 − 750) ÷ 750 × 100 = 3.8%
Nominal GDP grew 8%, real GDP grew 3.8%. More than half the apparent increase was price, not output, which is why an answer that quotes nominal growth as growth loses the point entirely.
Now bring in population. If population grew 1.5% over the same year:
Real GDP per capita growth ≈ 3.8% − 1.5% = 2.3%
The average person is better off, but by considerably less than either headline figure suggested. Where population grows faster than real GDP, output per person falls even while total output rises, the situation of several developing economies, and a standard evaluation point.
Causes of growth
Causes of actual growth work through AD, anything raising C, I, G or net exports: rising confidence, lower interest rates, fiscal expansion, an export boom, a depreciation.
Causes of potential growth work through the quantity or quality of factors of production:
- Quantity of labour: population growth, immigration, higher participation rates.
- Quality of labour (human capital): education, training, health.
- Quantity of capital: net investment in machinery, buildings and infrastructure.
- Quality of capital: technological progress, which is usually the largest long-run contributor.
- Natural resources: new discoveries, or better extraction methods.
- Institutions and efficiency: property rights, rule of law, reduced corruption, better competition, improved allocation of existing resources.
Investment does both, which is why it appears so often in answers. In the short run, investment spending is a component of AD, so it raises actual output. In the long run, the resulting capital stock raises capacity, shifting LRAS right. Making that dual point explicitly is a reliable way to show depth.
Productivity is the variable that matters most in the long run. Output per worker is what separates a country whose GDP rises because more people are working from one whose citizens are genuinely becoming better off. Only productivity growth raises GDP per capita sustainably.
Consequences of economic growth
Benefits
- Higher average incomes and material living standards: more goods and services per person.
- Lower unemployment, since firms need more workers as output expands.
- Higher tax revenue without higher tax rates, funding healthcare, education and infrastructure.
- Reduced absolute poverty, where the gains are broadly spread.
- Business confidence and investment, which can become self-reinforcing.
- Capacity to fund environmental protection, since richer economies can afford cleaner technology and stricter standards.
Costs and qualifications
- Inflation risk if growth is demand-led and the economy is near capacity.
- Inequality. Growth raises the average, and averages conceal distribution. If the gains accrue to capital owners or to particular regions, many people see little benefit, which is why GDP per capita is a weak welfare measure on its own.
- Environmental costs. Higher output can mean more pollution, resource depletion and carbon emissions, negative externalities not captured in GDP.
- Sustainability. Growth that depletes natural capital may not be repeatable. This is the core of the sustainable development argument: current output should not compromise the ability of future generations to meet their needs.
- Current account pressure, since rising incomes raise import demand.
- Structural unemployment, because growth changes which industries thrive, and workers in declining ones may lack transferable skills.
- Opportunity cost of investment. Producing more capital goods now means fewer consumer goods now, better future consumption at the price of present consumption.
The decisive distinction on the environment is between growth that comes from using up resources and growth that comes from rising productivity. The first is self-limiting and damaging; the second can continue without proportionate environmental cost. Answers that treat all growth as environmentally equivalent miss the argument the question is usually testing.
Growth versus development
Growth is an increase in output; development is a broader improvement in wellbeing including health, education, freedom and equality. Growth usually helps development but does not guarantee it: output can rise while inequality widens, environmental quality falls, or gains flow abroad rather than to residents. Making this distinction is often the strongest single evaluation point available.
Real-world examples
- China since the 1980s is the standard case of sustained rapid growth lifting hundreds of millions out of absolute poverty, and simultaneously of the environmental and regional-inequality costs that accompany it. It supports both sides of the argument, which makes it unusually useful.
- Japan since the 1990s shows an advanced economy where growth stalled despite a highly educated workforce and large capital stock, illustrating that capacity alone does not deliver growth if demand and demographics work against it.
- Resource-rich economies whose growth tracks a single commodity price illustrate the sustainability point directly: output rising from extraction rather than productivity is vulnerable and finite.
Worked example
An economy has been in recession, with unemployment at 9% and factories operating well below capacity. The government cuts income tax.
- Lower income tax raises disposable income
- consumption rises
- AD shifts right from AD₁ to AD₂
- because the economy has substantial spare capacity, firms respond by raising output rather than prices
- real GDP rises and unemployment falls, with only modest inflationary pressure.
On the PPC this is a movement from a point inside the curve towards it, actual growth. The productive frontier has not moved.
The qualification that earns the marks. This cannot continue indefinitely. Once the economy approaches full capacity, further AD increases raise the price level rather than output, the AS curve steepens. Sustaining growth beyond that point requires potential growth: investment, education, technology. A tax cut alone cannot deliver it.
And check who gained. Suppose the tax cut was concentrated on higher earners. Real GDP has risen, so the country has grown, but if the additional income accrued mainly to households already comfortable, average living standards rose while typical living standards barely moved. Growth and welfare are related, not identical, and the sentence saying so is the difference between describing an outcome and judging it.
Common exam mistakes
- Confusing actual with potential growth, or using the wrong diagram for each.
- Shifting the PPC outward for a recovery from recession; that is a movement towards the curve, not a shift.
- Treating nominal GDP growth as economic growth without adjusting for inflation.
- Forgetting population, so total growth is mistaken for growth per person.
- Assuming growth automatically raises living standards for everyone, it raises the average.
- Ignoring environmental and distributional costs entirely.
- Treating all growth as equally damaging to the environment, without separating resource depletion from productivity gains.
- Treating growth and development as synonyms.
Exam technique
Decide first whether the question concerns actual or potential growth, then choose the diagram to match. Many answers lose marks simply by drawing an outward PPC shift for a demand-side stimulus.
Show the initial position, the change, and the new position, with axes labelled, PPC axes are two goods (or consumer and capital goods); AD–AS axes are price level and real output.
When data is given, do the arithmetic: deflate nominal figures to real, then subtract population growth. Both steps are creditworthy, and both change the conclusion.
For evaluation, the strongest routes are: spare capacity (which determines whether AD growth gives output or inflation), distribution (who actually gains), environmental sustainability, the short-run/long-run distinction, and growth versus development. A conditional judgement using two of these beats a list of six benefits.
Quick revision
- Economic growth = a rise in real GDP.
- Actual growth: using spare capacity, inside the PPC towards it; AD shifts right.
- Potential growth: raising capacity, PPC shifts outward; LRAS shifts right.
- Demand-side policy delivers actual growth only; supply-side raises potential.
- Real GDP = (nominal ÷ price index) × 100; per capita divides by population.
- Investment does both: AD in the short run, capacity in the long run.
- Productivity growth is what raises GDP per capita sustainably.
- Benefits: incomes, employment, tax revenue, poverty reduction.
- Costs: inflation, inequality, environmental damage, sustainability, opportunity cost.
- Separate growth from depletion versus growth from productivity.
- Growth ≠ development.
Check you have it
Cross-board concept practice · originally a CIE 9708 question, used here because the concept is the same. It is not IB Economics past-paper material.
Question 1
The real national income of a country fell by 3%. What could have caused this?
Answer: C.
Cross-board concept practice · originally a CIE 9708 question, used here because the concept is the same. It is not IB Economics past-paper material.
Question 2
Which government action is least likely to prevent a fall in economic growth?
Answer: A.
What the syllabus asks for on this topicSyllabus points
Syllabus points
- Define economic growth and distinguish actual from potential growth.
- Explain the causes of economic growth.
- Illustrate growth using PPC and AD–AS diagrams.
- Calculate and interpret growth rates and GDP per capita.
- Evaluate the consequences of economic growth.
Related IB Economics topics
Not the topic you were looking for? Describe what you are stuck on in your own words and we will take you to the notes that answer it.