Externalities & Common Pool Resources
Contents: 11 sections
Key definitions
| Term | Exam-ready definition |
|---|---|
| Market failure | Where the free market fails to allocate resources efficiently. |
| Externality | A cost or benefit falling on a third party outside the transaction. |
| Welfare loss | The loss of social surplus when output differs from the social optimum. |
| Common pool resource | A resource that is rival in use but non-excludable, prone to overuse. |
| Marginal external cost | The cost imposed on third parties by one more unit. |
Market failure and externalities
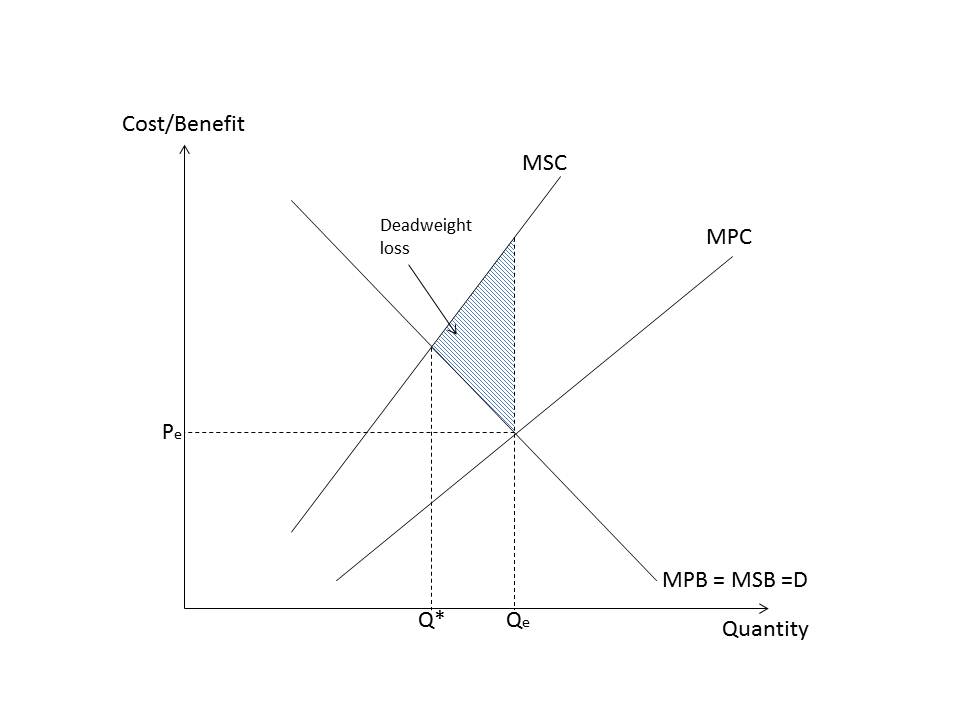
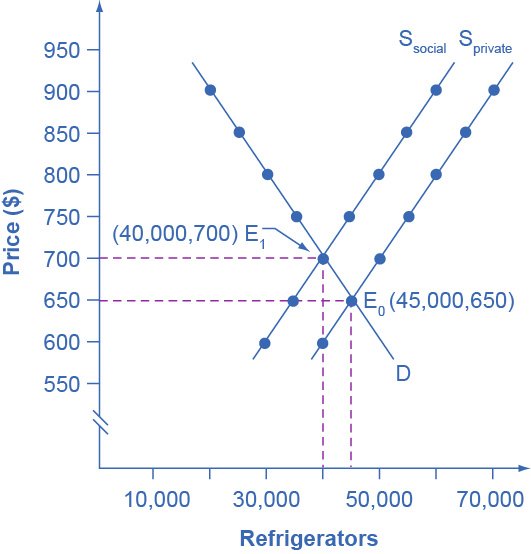
Market failure occurs when the free market fails to allocate resources efficiently, the quantity traded is not the quantity that maximises society's welfare.
A common cause is an externality: a cost or benefit affecting a third party who is neither the buyer nor the seller, and whose interests therefore never enter the transaction.
The whole topic rests on one gap:
- Social cost = private cost + external cost
- Social benefit = private benefit + external benefit
Markets clear where marginal private cost meets marginal private benefit, because that is what the two parties respond to. Society's optimum is where marginal social cost (MSC) = marginal social benefit (MSB). When an externality exists these two points differ, and the gap between them is the welfare (deadweight) loss.
The market is not irrational. It is optimising over the costs and benefits its participants actually bear, which is precisely the problem.
The four cases
| Case | Example | Relationship | Result |
|---|---|---|---|
| Negative production externality | Factory pollution | MSC > MPC | Over-production |
| Positive production externality | Firm training that raises skills across an industry | MSC < MPC | Under-production |
| Negative consumption externality | Smoking, driving, loud music | MSB < MPB | Over-consumption |
| Positive consumption externality | Vaccination, education | MSB > MPB | Under-consumption |
- Negative externalities
- the market over-produces or over-consumes. Positive externalities
- it under-provides.
Reading the diagram. In each case, one curve splits into two: the private curve the market responds to, and the social curve that includes the third-party effect. The vertical distance between them is the marginal external cost or benefit. The welfare-loss triangle sits between the two quantities, the market quantity and the social optimum, bounded by the MSC and MSB curves. For a negative externality it points towards the social optimum, which lies to the left of the market quantity.
Why welfare loss exists
It helps to say this in words rather than only shading a triangle:
For every unit produced beyond the social optimum, the cost to society exceeds the benefit to society. Each of those units makes society worse off, and the accumulated loss is the triangle.
That sentence, applied to the specific case in the question, is usually worth more than a second diagram.
Putting a number on it
A chemical plant imposes a marginal external cost of \$8 per tonne. The market produces 1,200 tonnes; the social optimum is 900.
Welfare loss = ½ × \$8 × (1,200 − 900) = \$1,200
The corrective tax = \$8 per tonne, the marginal external cost at the social optimum, which raises MPC to MSC and cuts output to 900.
The triangle's height is the external cost per unit and its base is the excess quantity. Getting those two the right way round is the whole calculation, and it is identical for a positive externality except that the excess sits on the other side: the market produces too little, so the base is the shortfall and the correction is a subsidy.
Common pool resources
Common pool (common access) resources, fish stocks, forests, clean air, groundwater, are rival in consumption (my use reduces what is available to you) but non-excludable (nobody can be prevented from using them).
That combination is destructive. Because access is free, each user compares only their private benefit against their private cost, and ignores the cost their use imposes on every other user. Every individual behaves rationally, and the collective outcome is overuse and depletion, the "tragedy of the commons".
The sustainability dimension matters for IB: these resources are often renewable but only up to a threshold. Harvest a fishery below its regeneration rate and it persists indefinitely; exceed that rate and the stock collapses, sometimes irreversibly. The cost falls on future generations, who cannot participate in today's market at all.
How they are managed, since a question asking about overuse wants remedies:
- Assigning property rights: individual transferable quotas in fisheries, land titling, so the user bears the cost of depletion and has a reason to conserve.
- Regulation: catch limits, closed seasons, protected areas.
- Taxes or charges on extraction, raising private cost towards social cost.
- Community management. Local users with long horizons and the ability to monitor each other have, in many documented cases, sustained a shared resource for generations without either privatisation or state control. This is worth knowing because it contradicts the assumption that only markets or governments can solve the problem.
Climate change is the largest example, and the hardest, because the atmosphere is a global commons: no single government has jurisdiction, every country benefits from others cutting emissions while bearing the full cost of its own cuts, and the damage falls disproportionately on countries that contributed least. That is a free-rider problem at international scale, which is why it needs treaties rather than domestic policy alone.
Policies to correct externalities
| Policy | How it works | Main weakness |
|---|---|---|
| Indirect (Pigouvian) tax | Raises private cost towards social cost, cutting output towards the optimum | Requires the external cost to be measured; regressive; ineffective if demand is inelastic |
| Subsidy | Raises private benefit towards social benefit for under-provided goods | Opportunity cost of public funds; risk of inefficiency |
| Regulation / legislation | Bans, limits, minimum standards | Enforcement costs; blunt: same rule for very different firms; can push activity to informal markets |
| Tradable permits | Caps total pollution and lets firms trade the right to emit | The cap must be set correctly; over-issuing permits collapses the price and the incentive |
| Education and awareness | Shifts demand by changing preferences | Slow, uncertain, hard to attribute |
Tradable permits deserve the mechanism spelled out, because it is what makes them attractive: the regulator fixes the total quantity of pollution and lets the market discover the price. Firms that can cut cheaply do so and sell their spare permits; firms for which cutting is expensive buy instead. The same total reduction is achieved at the lowest possible aggregate cost, something a uniform regulation cannot do, because it forces the same action on firms with very different abatement costs.
The evaluation that earns marks. Every one of these depends on the same handful of conditions, and naming them is what separates a top answer:
- Measurement. A tax should equal the marginal external cost at the social optimum. Nobody knows that number precisely, so the tax is an estimate.
- Elasticity. A tax on a good with inelastic demand raises revenue but changes behaviour little, the exact case for tobacco and fuel.
- Equity. Indirect taxes on necessities are regressive; low-income households pay a larger share of income.
- Enforcement capacity. A policy a government cannot administer is not a policy. This matters especially in developing economies.
- Time frame. Demand is more elastic in the long run, so a tax that seems ineffective in year one may work over a decade as substitutes appear.
- Government failure. Intervention can create its own distortions, lobbying, unintended consequences, poorly set caps.
Worked example
A power station burns coal and emits pollution affecting nearby residents.
- The firm pays for fuel, labour and capital, but not for the health costs borne by residents
- MSC lies above MPC by the marginal external cost
- the market produces where MPC = MPB, which is to the right of the social optimum where MSC = MSB
- every unit between those two quantities costs society more than it is worth
- welfare loss.
A per-unit tax equal to the marginal external cost at the social optimum raises the firm's private cost to the social cost, internalising the externality and cutting output to the optimum.
Whether it works depends on: whether the health cost can be valued credibly; whether demand for electricity is elastic enough for output to fall meaningfully; whether the firm can pass the tax to consumers, making it regressive; and whether the government can monitor emissions rather than merely output.
That last point is sharper than it looks. A tax on output gives a firm no reason to pollute less per unit; a tax on emissions does. Two policies that look identical on the diagram produce different behaviour, and saying so is a genuine discriminator.
Second worked example: a positive externality
Education generates benefits beyond the student, a more productive workforce, higher tax revenues, lower crime, better public health.
- Students weigh only their private benefit
- MSB lies above MPB by the marginal external benefit
- the market settles where MPB = MPC, which is to the left of the social optimum
- every unit between the two is worth more to society than it costs
- welfare loss from under-consumption.
The correction is a subsidy equal to the marginal external benefit at the optimum, or direct state provision, which is why almost every country funds education publicly rather than leaving it to the market.
Note the two differences from the negative case, which is where marks are won: the failure is under-provision, and the welfare-loss triangle sits to the right of the market quantity. The arithmetic is identical; the direction is reversed.
Common exam mistakes
- Mislabelling the MSC/MSB diagram, or shading the welfare-loss triangle on the wrong side of the social optimum.
- Confusing production with consumption externalities. Check whether the third-party effect arises from making the good or from using it.
- Saying "the market fails" without identifying which curve diverges and in which direction.
- Presenting one policy as a complete fix. Every policy question wants trade-offs.
- Describing a common pool resource as a public good. Public goods are non-rival; common pool resources are rival, which is exactly why they are depleted.
- Recommending a tax without saying how large it should be.
- Treating a tax on output as equivalent to a tax on emissions.
Exam technique
Draw the correct diagram for the specific case, MPC and MSC for a production externality, MPB and MSB for a consumption one. Mark both quantities (market and social optimum) and shade the welfare loss. Refer to the diagram explicitly in your writing; a diagram nobody mentions does almost no work.
Where a number is given for the external cost, compute the welfare-loss triangle: ½ × external cost per unit × the gap between the two quantities.
For 15-mark questions, do not simply list policies. Choose one, analyse it fully with a chain, then evaluate it against a named alternative under stated conditions. A conditional judgement, "a tax is preferable where the external cost can be measured and demand is reasonably elastic; where it cannot, direct regulation may be more reliable", is what the top band asks for.
Quick revision
- Social cost/benefit = private + external.
- Negative externality → over-provision; positive externality → under-provision.
- Welfare loss = ½ × external cost per unit × the gap between market and optimum quantity.
- The optimal tax equals the marginal external cost at the social optimum.
- Tradable permits fix the quantity and let the market find the price, achieving the cut at least cost.
- Common pool resources are rival but non-excludable → overuse; remedies are property rights, regulation, charges or community management.
- Climate change is a global commons, which is why it needs treaties.
- Public goods are non-rival and non-excludable, not the same thing.
- Evaluate on measurement, elasticity, equity, enforcement and time.
Check you have it
Cross-board concept practice · originally a CIE 9708 question, used here because the concept is the same. It is not IB Economics past-paper material.
Question 1
The table shows the marginal costs of production and marginal benefits of consumption. marginal private cost ($) marginal social cost ($) marginal private benefit ($) marginal social benefit ($) 100 150 150 200 What is demonstrated in these values?

Answer: D.
Cross-board concept practice · originally a CIE 9708 question, used here because the concept is the same. It is not IB Economics past-paper material.
Question 2
What can be deduced about an economy where no-one can be made better off without making someone else worse off?
Answer: D.
Cross-board concept practice · originally a CIE 9708 question, used here because the concept is the same. It is not IB Economics past-paper material.
Question 3
In recent years, the fuel cost of operating a jet aircraft has declined. Over the same period, improved design has led to much quieter aircraft. How would this affect the marginal private cost (MPC) and the marginal external cost (MEC) of air travel?
Answer: A.
Explanation:
1. Marginal private cost (MPC) refers to the cost incurred by the producer or consumer in producing or consuming an additional unit of a good or service. The decline in fuel costs for operating a jet aircraft would lead to a reduction in the operating costs for airlines, thus reducing the MPC of air travel.
2. Marginal external cost (MEC) refers to the cost imposed on third parties not directly involved in the production or consumption of a good or service. The improvement in the design of quieter aircraft would lead to a reduction in noise pollution and its associated costs, such as health effects and property devaluation, thus reducing the MEC of air travel.
Given that both the decline in fuel cost and the quieter aircraft design contribute to lowering the overall cost and negative externalities associated with air travel, it would result in a downward shift of both the MPC and MEC curves. This shift indicates a more efficient allocation of resources and a reduction in the overall social cost of air travel.
What the syllabus asks for on this topicSyllabus points
Syllabus points
- Define market failure and explain the four externality cases.
- Explain welfare loss from externalities using MSC/MSB analysis.
- Explain common pool resources and their overuse.
- Evaluate policies to correct externalities.
Related IB Economics topics
Not the topic you were looking for? Describe what you are stuck on in your own words and we will take you to the notes that answer it.