Low Unemployment
Contents: 11 sections
Measuring unemployment
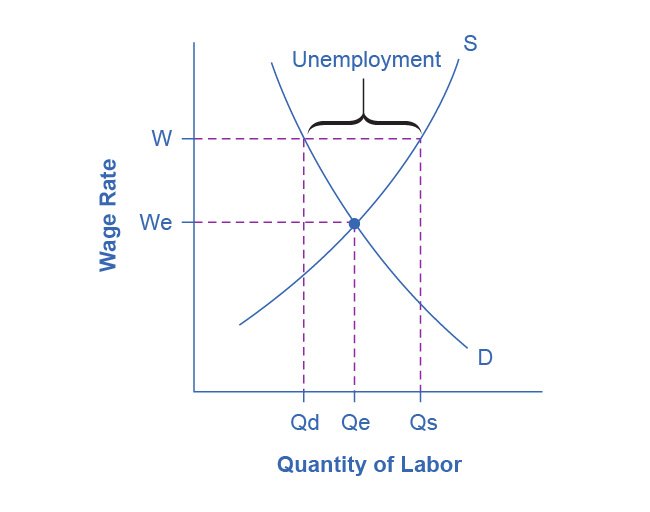
The unemployed are people of working age who are without work, available for work, and actively seeking work. All three conditions must hold, and the third is what excludes people who have given up looking.
Unemployment rate = (number unemployed ÷ labour force) × 100
The labour force is the employed plus the unemployed. It does not include everyone of working age: students, the retired, carers and the long-term sick are economically inactive and sit outside the labour force altogether.
Putting the working-age population on the denominator is the single most common calculation error in this topic. A related measure uses it deliberately:
Labour force participation rate = (labour force ÷ working-age population) × 100
Key definitions
| Term | Exam-ready definition |
|---|---|
| Unemployment | People of working age, available for and actively seeking work, who are without work. |
| Labour force | The employed plus the unemployed. |
| Economically inactive | Working-age people neither in work nor seeking it. |
| Underemployment | Working fewer hours than desired, or in a job below one's skill level. |
| Natural rate of unemployment | The rate remaining when the economy is at full employment: frictional plus structural. |
| Full employment | The output level where only the natural rate of unemployment remains. |
Types of unemployment
Identifying the type is the diagnostic step that governs every policy recommendation, and answers that skip it usually recommend the wrong policy.
| Type | Cause | Appropriate response |
|---|---|---|
| Cyclical (demand-deficient) | A fall in AD during a recession: firms need fewer workers at every wage | Demand-side policy: expansionary fiscal or monetary |
| Structural | A permanent change in the pattern of demand or technology; skills or location no longer match available jobs | Supply-side: retraining, education, relocation support |
| Frictional | People moving between jobs: a short, voluntary search period | Better job information; largely benign |
| Seasonal | Predictable variation in demand across the year (tourism, agriculture) | Diversification; often accepted |
Cyclical unemployment is the only type demand management can cure, and it is temporary, it disappears as the economy recovers. On the AD–AS diagram it appears as a deflationary gap: equilibrium output to the left of full-employment output.
Structural unemployment is the serious one. It is long-term, concentrated in particular regions and industries, and it persists even at the peak of a boom. Because the mismatch is in skills or geography, throwing extra demand at the economy does not help: the vacancies and the unemployed people are in different places or require different skills. This is exactly why diagnosing the type matters.
Structural unemployment has several distinct sources worth separating: technological change making particular skills obsolete, regional decline concentrating job losses geographically, and shifts in international competitiveness moving whole industries abroad.
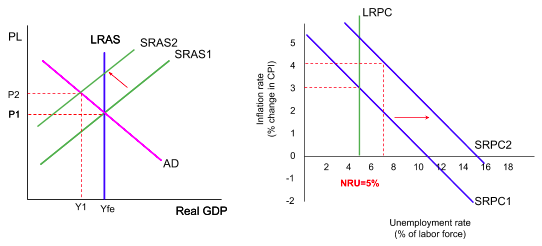 Each implies a slightly different remedy, retraining, relocation support, or industrial policy.
Frictional unemployment is not a problem to be eliminated. Some job search is efficient, it lets workers find posts that match their skills, so a zero unemployment rate is neither achievable nor desirable.
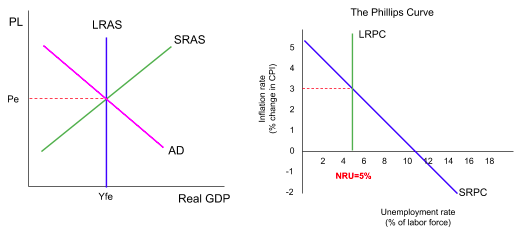
Together, frictional and structural unemployment make up the natural rate: what remains when the economy is at full employment and cyclical unemployment is zero.
Policies to reduce unemployment
The diagnostic step pays off here, because the wrong instrument does nothing at best.
For cyclical unemployment, raise AD:
- Expansionary fiscal policy (higher G, lower taxes) or expansionary monetary policy (lower interest rates)
- AD shifts right
- firms raise output
- they hire more workers
- cyclical unemployment falls.
Evaluate on: time lags, whether the economy has spare capacity, inflation risk if it does not, the size of the multiplier, and the budgetary cost.
For structural unemployment, raise the match between workers and jobs:
- Education and retraining, aimed at skills employers actually demand.
- Relocation and housing support, addressing geographical immobility.
- Improved job information and employment services.
- Reduced benefit levels or tighter conditions, a market-based alternative that sharpens incentives but does nothing about the mismatch itself and imposes real hardship on those who genuinely cannot find suitable work.
Evaluate on: very long lags, cost and opportunity cost, whether training matches real vacancies, and equity.
The general rule: demand-side policy for cyclical unemployment, supply-side policy for structural. Recommending a stimulus for a skills mismatch is the standard way to lose an otherwise good answer.
Costs of unemployment
To the unemployed individual: lost income and living standards; loss of skills and employability the longer it lasts (hysteresis); documented effects on physical and mental health; social exclusion.
To the economy: output is lost permanently, an economy operating inside its PPC can never recover the goods it did not produce. Tax revenue falls while benefit spending rises, worsening the government budget. Consumption falls, which reduces AD further.
To firms: weaker demand for their products, offset partly by easier recruitment and reduced wage pressure, which is why unemployment is not costly to every party equally, a point worth making when a question asks who is affected.
To society: rising inequality and relative poverty; higher demands on public services; in severe and prolonged cases, associations with crime and social unrest; increased regional disparity when unemployment concentrates geographically.
Hysteresis is worth naming explicitly. Long spells of unemployment erode skills, confidence and work habits, so cyclical unemployment can become structural if a recession lasts long enough. That converts a temporary problem into a permanent one and is a strong argument for acting quickly, the single best justification for accepting the costs of an early stimulus.
Difficulties in measuring unemployment
This is an explicit syllabus point and a rich source of evaluation:
- Hidden unemployment. Discouraged workers who have stopped searching are counted as inactive, not unemployed, so the headline rate understates the problem, and it can fall during a downturn simply because people gave up.
- Underemployment. Part-time workers wanting full-time hours, and graduates in low-skilled jobs, count as fully employed. The rate says nothing about the quality of work.
- The informal economy. People working unofficially may register as unemployed. This is especially significant in developing economies, where the informal sector can be a large share of activity.
- It is an average. A national rate of 6% conceals severe regional, ethnic, gender and age disparities. Youth unemployment is often two or three times the national figure.
- Different definitions. Claimant counts (people receiving benefits) and survey-based measures give different numbers, so international comparisons need care.
Note that these biases do not all run the same way: discouraged workers and underemployment make the figure look better than reality, while the informal economy can make it look worse. Saying which dominates in a given context is stronger than listing both.
Real-world examples
- Youth unemployment in southern Europe after 2008 reached multiples of the national rate in several countries, illustrating both the averaging problem and hysteresis, a cohort entering the labour market during a downturn carries the effect for years.
- Deindustrialised regions in the UK, the US rust belt and elsewhere are the standard structural case: unemployment persisting through national booms because the lost industries did not return and the skills did not transfer.
- The COVID-19 period showed the measurement problem sharply, as furlough and job-retention schemes kept workers formally employed who would otherwise have been counted unemployed, so the headline rate understated the disruption.
Worked example
An economy has 100 million employed, 8 million unemployed, and 40 million of working age who are neither working nor seeking work.
Labour force = 100 + 8 = 108 million
Unemployment rate = 8 ÷ 108 × 100 = 7.4%
Working-age population = 108 + 40 = 148 million
Participation rate = 108 ÷ 148 × 100 = 73%
Note that the 40 million inactive are excluded from the unemployment denominator but included in the participation denominator. Mixing these up is the classic lost mark.
Interpretation. If half a million discouraged workers resumed searching; they would move from inactive to unemployed, raising the measured unemployment rate even though nothing about the economy had worsened. That counter-intuitive result is a strong evaluation point about the limits of the statistic.
Now diagnose and prescribe. If the natural rate here is about 5%, then roughly 2.4 percentage points are cyclical, a deflationary gap, and a case for demand-side policy. But the remaining 5 points are frictional and structural, and no amount of stimulus will touch them. A government aiming below 5% would generate inflation without reducing unemployment further, which is precisely why full employment is defined at the natural rate rather than at zero.
Common exam mistakes
- Dividing by the working-age population instead of the labour force.
- Counting the economically inactive as unemployed.
- Recommending demand-side policy for structural unemployment.
- Treating any unemployment as bad, some frictional unemployment is efficient.
- Saying full employment means zero unemployment.
- Listing costs without distinguishing individual, economic and social effects.
- Ignoring that the headline rate can move for measurement reasons rather than real ones.
Exam technique
Diagnose before prescribing. Read the stimulus for clues about the type: a recession points to cyclical, obsolete skills or a declining industry to structural, and a person between jobs to frictional. Then match the policy, and say explicitly why the alternative would not work.
Use the AD–AS diagram for cyclical unemployment, showing the deflationary gap with equilibrium output to the left of the full-employment level. Label the axes price level and real output.
When given data, compute the rate and say what it conceals. The calculation is one mark; the sentence about discouraged workers or regional variation is where the evaluation marks are.
For evaluation: the type of unemployment, hysteresis, time lags before policy works, the measurement problems above, and the opportunity cost of retraining programmes.
Quick revision
- Unemployment rate = unemployed ÷ labour force × 100.
- Labour force = employed + unemployed; inactive people are outside it.
- Types: cyclical (AD), structural (mismatch), frictional (search), seasonal.
- Only cyclical unemployment responds to demand-side policy.
- Natural rate = frictional + structural, remaining at full employment.
- Hysteresis: long spells turn cyclical unemployment into structural.
- Demand-side policy for cyclical; supply-side for structural.
- The headline rate hides discouraged workers, underemployment and regional disparity, and the biases run in both directions.
Check you have it
Cross-board concept practice · originally a CIE 9708 question, used here because the concept is the same. It is not IB Economics past-paper material.
Question 1
A government increases direct taxation to reduce its budget deficit.
How is this likely to affect the government’s ability to achieve its macroeconomic objectives?
Answer: C.
Higher direct taxation reduces households' disposable income and firms' post-tax profits, so consumption and investment fall and aggregate demand shifts inward. Work through the three objectives. Weaker demand means firms produce less and need fewer workers, so low unemployment becomes less likely. Less output means slower growth, so economic growth becomes less likely. But reduced demand relieves demand-pull pressure on prices, so low inflation becomes more likely. Contractionary fiscal policy buys price stability at the cost of jobs and output.
Why the other options are wrong:
- A claims low inflation becomes less likely, which reverses the effect of weaker demand on prices.
- B claims low unemployment becomes more likely and growth more likely, both of which contradict falling aggregate demand.
- D gets unemployment and inflation right but claims growth becomes more likely. That is inconsistent: if firms are hiring fewer workers because demand is weak, output cannot be expanding faster. Growth and employment move together here.
Cross-board concept practice · originally a CIE 9708 question, used here because the concept is the same. It is not IB Economics past-paper material.
Question 2
An economy adopts an expansionary monetary policy to boost employment. A result of this policy is that the consumer price index rises at an accelerating rate.
Which curve could represent this?
Answer: D.
Cross-board concept practice · originally a CIE 9708 question, used here because the concept is the same. It is not IB Economics past-paper material.
Question 3
A country with a constant population experiences a 5% increase in its nominal GDP during a year.
In which situation will average living standards be most likely to have increased during the year?
Answer: B.
Nominal GDP rose 5%, but part of any nominal increase is just higher prices rather than more goods. With inflation at 3%, real GDP has grown by roughly 5% – 3% = 2%. The population is constant, so real output per head has risen by about 2% too, and average living standards have most likely improved. Real growth per head is what living standards depend on.
Why the other options are wrong:
- A, no increase in unemployment, tells us nothing about whether output per head has risen in real terms. Employment could be steady while inflation absorbed the entire 5%.
- C, no increase in real national income, is decisive in the opposite direction. If real income is unchanged, the whole 5% was inflation, and living standards have not improved at all.
- D, no redistribution of income, concerns how income is shared, not how much there is. An unchanged distribution of an unchanged real income leaves living standards where they were.
What the syllabus asks for on this topicSyllabus points
Syllabus points
- Define unemployment and explain how the unemployment rate is measured.
- Distinguish the types and causes of unemployment.
- Explain the costs of unemployment.
- Explain the policies appropriate to each type.
- Evaluate the difficulties of measuring unemployment.
Related IB Economics topics
Not the topic you were looking for? Describe what you are stuck on in your own words and we will take you to the notes that answer it.