Competitive Market Equilibrium
Contents: 11 sections
Market equilibrium
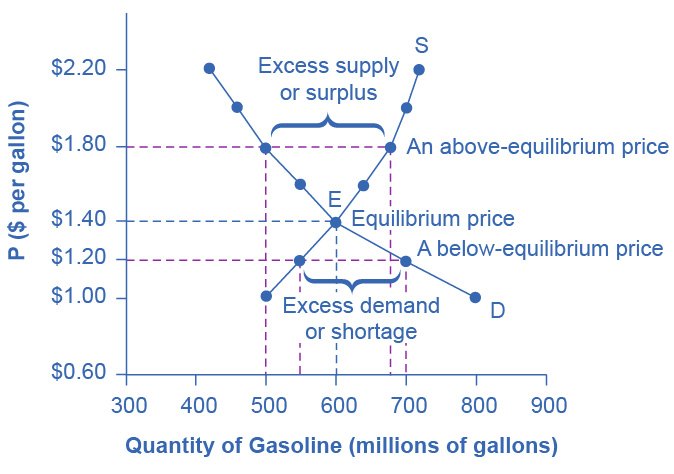
Equilibrium occurs where the demand and supply curves intersect: the price at which planned quantity demanded equals planned quantity supplied. At this market-clearing price there is no tendency for price or quantity to change, because nobody in the market has an incentive to behave differently.
Disequilibrium is self-correcting:
- Above equilibrium: quantity supplied exceeds quantity demanded, a surplus (excess supply). Firms accumulate unsold stock and cut price to shift it. As price falls, quantity demanded rises and quantity supplied falls, closing the gap until the market clears.
- Below equilibrium: quantity demanded exceeds quantity supplied, a shortage (excess demand). Consumers compete for the limited quantity and bid the price up. As price rises, quantity demanded falls and quantity supplied rises until the market clears.
Notice that in both cases the adjustment happens through movements along both curves, not shifts. This is a favourite examiner trap.
Key definitions
| Term | Exam-ready definition |
|---|---|
| Equilibrium | The price and quantity where quantity demanded equals quantity supplied. |
| Surplus | Excess supply at prices above equilibrium. |
| Shortage | Excess demand at prices below equilibrium. |
| Price mechanism | The way prices signal, ration and incentivise to allocate resources. |
| Consumer surplus | The difference between what consumers are willing to pay and what they do pay. |
| Producer surplus | The difference between the price received and the minimum acceptable price. |
| Allocative efficiency | Where resources produce the combination of goods society most values. |
Calculating equilibrium
Paper 3 gives demand and supply as equations and asks you to solve them. The method is always the same: set Qd = Qs, solve for price, then substitute back for quantity.
Worked calculation. Qd = 120 − 2P and Qs = −30 + 3P.
Set Qd = Qs: 120 − 2P = −30 + 3P
150 = 5P, so P = 30
Substitute: Qd = 120 − 2(30) = 60
Check with the other equation: Qs = −30 + 3(30) = 60 ✓
Always check by substituting into both equations. If they disagree, the algebra slipped, and the check costs one line.
Now test a disequilibrium price. At P = 20:
Qd = 120 − 40 = 80 and Qs = −30 + 60 = 30
Shortage of 50 units, quantity demanded exceeds quantity supplied, so price is bid upward.
At P = 40, Qd = 120 − 80 = 40 and Qs = −30 + 120 = 90, a surplus of 50 units, so price is pushed down. Both confirm that 30 is the only price at which the market clears.
The functions of the price mechanism
Prices allocate resources in a market economy through three roles, and a strong answer names all three:
- Signalling: prices convey information about relative scarcity and about what consumers want, without anyone needing to collect or publish that information centrally.
- Incentive: a higher price rewards producers for supplying more, and for moving resources into that market.
- Rationing: a higher price discourages some consumption, distributing a scarce good among those most willing and able to pay.
- Rising demand
- higher price
- signals scarcity
- incentivises more supply
- rations demand
- resources reallocated into that market.
This chain is the answer to "how does a market economy decide what to produce?" and is worth memorising as a sequence.
The rationing function is where equity enters. Prices ration by willingness and ability to pay, which is efficient but not necessarily fair: a rise in the price of staple food rations it away from the poorest first. That observation is the bridge from this topic to market failure and to the equity topic, and it is a legitimate evaluative point whenever a question praises the price mechanism.
Consumer and producer surplus
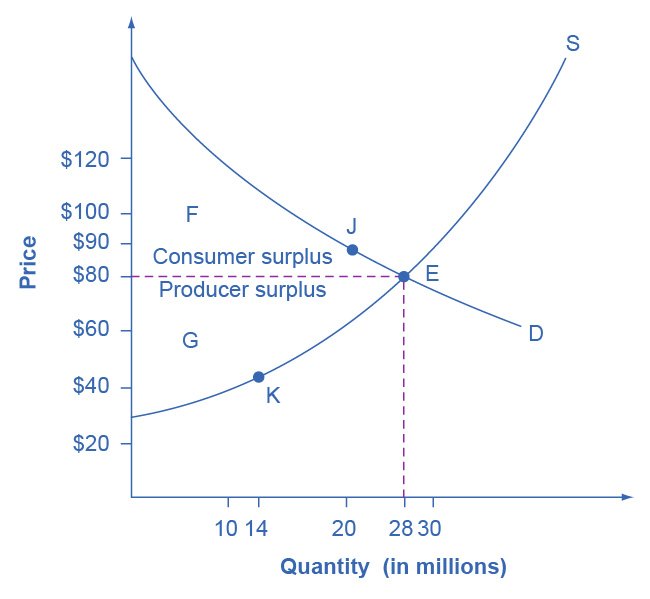
At equilibrium:
- Consumer surplus is the area below the demand curve and above the price, the benefit to consumers who would have paid more than they had to.
- Producer surplus is the area above the supply curve and below the price, the benefit to producers who would have accepted less.
- Total surplus (community surplus) is the sum of the two, and it is maximised at the competitive equilibrium.
Calculating them from the same functions as above. The surpluses are triangles, so each is ½ × base × height.
Consumer surplus. Demand reaches zero when 120 − 2P = 0, so the highest price anyone would pay is P = 60.
CS = ½ × (60 − 30) × 60 = 900
Producer surplus. Supply reaches zero when −30 + 3P = 0, so the lowest price any producer accepts is P = 10.
PS = ½ × (30 − 10) × 60 = 600
Total surplus = 900 + 600 = 1,500
The height of each triangle is the gap between the equilibrium price and the relevant intercept; the base is always the equilibrium quantity. Getting the two intercepts right is the whole task.
This is the formal meaning of allocative efficiency: resources are allocated so that no reallocation could make society better off. At equilibrium, price equals marginal cost, so the value consumers place on the last unit exactly equals the cost of producing it. Any other quantity destroys surplus.
That last point is what makes this topic the foundation for market failure: whenever the market produces something other than the allocatively efficient quantity, because of externalities, market power or missing information, there is a welfare loss.
Shifts and the new equilibrium
To analyse any event, decide whether it shifts demand, supply, or both, then read off the new equilibrium:
| Shift | Price | Quantity |
|---|---|---|
| Demand right (increase) | Rises | Rises |
| Demand left (decrease) | Falls | Falls |
| Supply right (increase) | Falls | Rises |
| Supply left (decrease) | Rises | Falls |
When both curves shift, one outcome is determinate and the other is ambiguous, depending on the relative sizes of the shifts:
| Both shift | Price | Quantity |
|---|---|---|
| D right, S right | Indeterminate | Rises |
| D right, S left | Rises | Indeterminate |
| D left, S right | Falls | Indeterminate |
| D left, S left | Indeterminate | Falls |
The pattern rather than the table: where the two shifts push a variable the same way it moves that way; where they push in opposite directions it is indeterminate. Saying so explicitly, and explaining what it depends on, is a genuine analytical point, not a hedge.
Elasticity determines the split. A demand increase raises price a lot and quantity a little when supply is inelastic; it raises quantity a lot and price a little when supply is elastic. This is why the same demand shock produces spiralling prices in housing (inelastic supply) and mostly extra output in manufacturing (elastic supply).
Worked example
A poor harvest reduces the supply of coffee.
- Bad weather destroys part of the crop
- at every price, less coffee can be supplied
- the supply curve shifts left, from S₁ to S₂
- at the original price P₁ there is now a shortage, because quantity demanded exceeds the reduced quantity supplied
- consumers bid the price up
- as price rises, quantity demanded falls and quantity supplied rises along the new curve
- equilibrium settles at a higher price P₂ and a lower quantity Q₂.
The price mechanism is doing three jobs at once here: rationing the smaller crop to those most willing to pay, signalling to growers worldwide that coffee is scarce, and incentivising more planting for next season.
Evaluation. Because demand for coffee is relatively inelastic; it is habitual and has few close substitutes, most of the adjustment falls on price rather than quantity. Growers' total revenue may therefore actually rise despite the smaller harvest, which is the classic result for primary commodity markets and links directly to 2.5.
And note who bears it. Consumer surplus falls sharply, because buyers pay more for less. The growers whose crop survived gain; those who lost their harvest do not, whatever the price does. "Producers benefit" is too crude, the gain is concentrated among the unaffected, which is why commodity price volatility is a development issue as well as a microeconomic one.
Common exam mistakes
- Confusing a surplus or shortage (a disequilibrium at a given price) with a shift of a curve.
- Shifting a curve to correct a shortage. Shortages are corrected by price changes and movements along the curves.
- Forgetting to relabel the new equilibrium price and quantity on the diagram.
- Ignoring the price mechanism's three functions when asked how resources are reallocated.
- Claiming a determinate outcome when both curves shift.
- In surplus calculations, using the wrong intercept, or the pre-shift quantity as the base.
- Saying the market is "efficient" without explaining that total surplus is maximised where price equals marginal cost.
- Treating allocative efficiency as though it also meant the outcome was fair.
Exam technique
For "analyse the effect of…" questions, follow a fixed routine: identify which curve shifts and why. Draw and label the shift, mark the new equilibrium with dotted lines, then state the direction of change in both price and quantity.
When given equations, set Qd = Qs, solve, substitute back, and check in both equations. Then, if surplus is asked for, find each intercept by setting the relevant quantity to zero before computing the triangles.
For evaluation, the reliable routes are elasticity (which determines whether price or quantity absorbs the shock), the size of the shift, the time frame (supply is more elastic in the long run), the distributional effect of price rationing, and whether the market is genuinely competitive, since the whole model assumes no market power, perfect information and no externalities. Questioning those assumptions is legitimate, syllabus-relevant evaluation.
Quick revision
- Equilibrium = where D meets S; surpluses and shortages self-correct through price.
- Adjustment to disequilibrium happens by movements along the curves.
- Solve Qd = Qs for P, substitute back for Q, and check in both equations.
- CS = ½ × (choke price − P) × Q; PS = ½ × (P − supply intercept) × Q.
- Price mechanism: signal, incentive, ration, and it rations by ability to pay.
- D right → P↑ Q↑; D left → P↓ Q↓; S right → P↓ Q↑; S left → P↑ Q↓.
- Both shift → one outcome is ambiguous; say which and why.
- Total surplus is maximised at equilibrium, where P = MC; this is allocative efficiency.
- Efficient does not mean equitable.
- Inelastic supply → shocks hit price; elastic supply → shocks hit quantity.
Check you have it
Cross-board concept practice · originally a CIE 9708 question, used here because the concept is the same. It is not IB Economics past-paper material.
Question 1
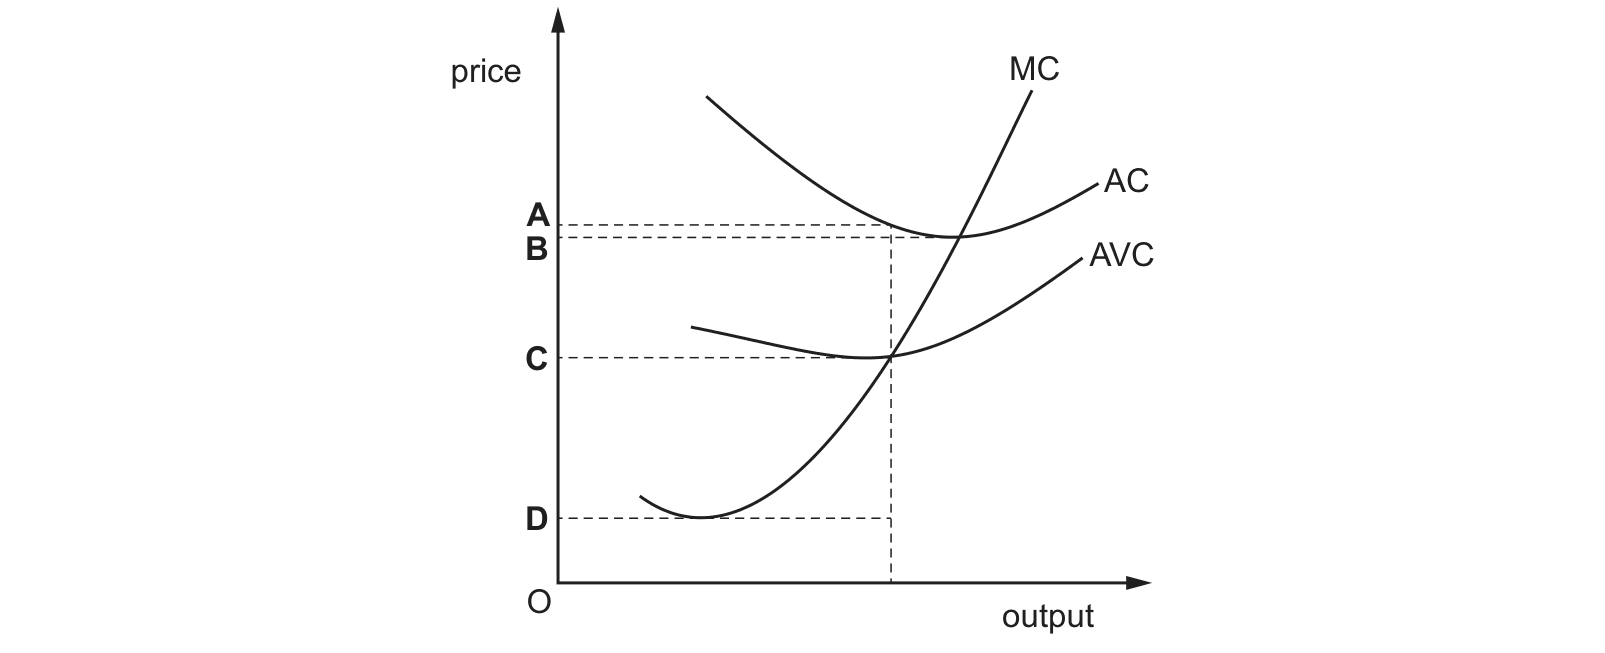
The diagram shows the cost curves of a firm operating in a perfectly competitive market. Below which price will the firm shut down in the short run?
Answer: C.
Read the diagram for the lowest point of the AVC curve and trace it across to the price axis: that is price C. Above C the firm keeps trading even at a loss, because every unit still makes a contribution towards the fixed costs. Below C each unit adds to the loss, so stopping is cheaper.
The other three prices are the diagram's deliberate distractors:
- B is minimum AVERAGE COST, where MC cuts AC. That is the break-even price, not the shutdown price, between C and B the firm loses money and still carries on.
- A is above break-even, so the firm is profitable there.
- D is the minimum of the MC curve, which is lower still and has nothing to do with the decision.
Cross-board concept practice · originally a CIE 9708 question, used here because the concept is the same. It is not IB Economics past-paper material.
Question 2
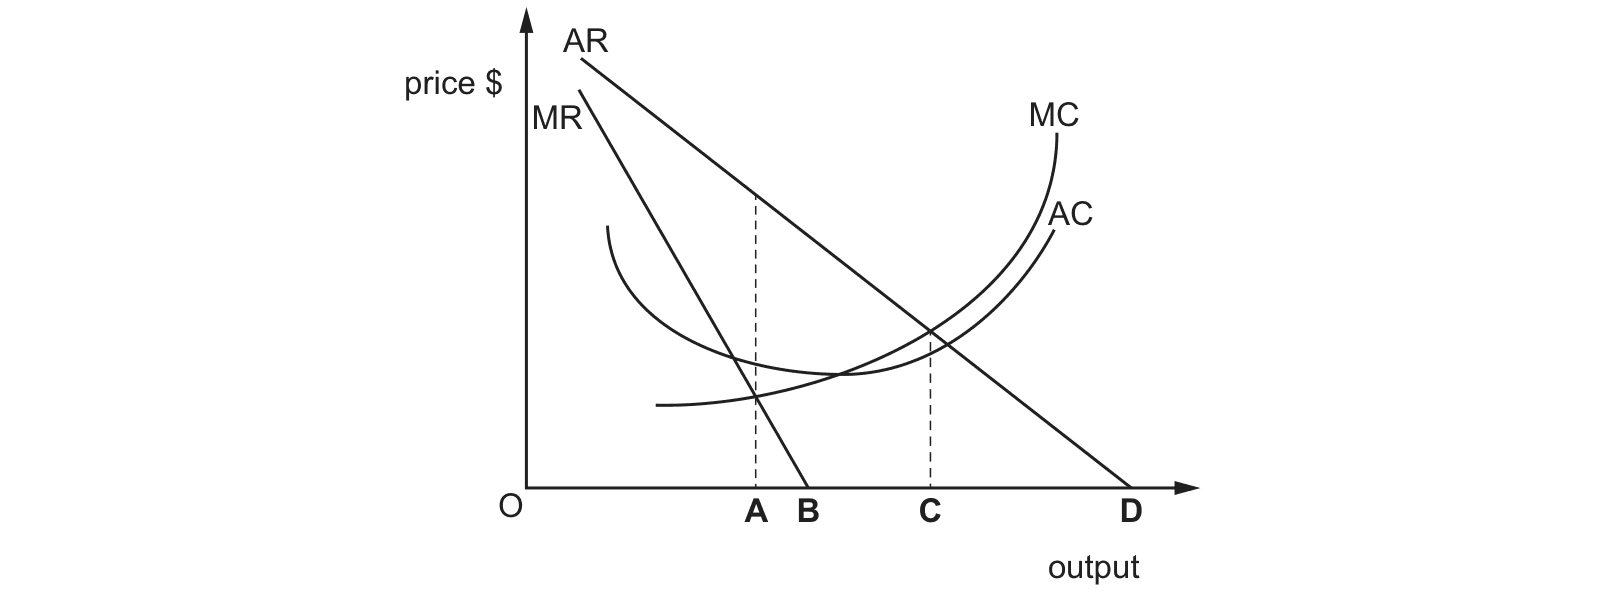
The diagram shows a firm in an imperfectly competitive market. Which level of output would maximise total revenue?
Answer: B.
On the diagram MR cuts the axis at output B, so B maximises total revenue.
The trap is A, where MC cuts MR. That is the PROFIT-maximising output, and it is always to the LEFT of the revenue-maximising one, because a profit maximiser stops while MR is still positive; it is paying attention to costs as well. A firm chasing sales revenue instead of profit deliberately pushes output past A, out to B.
Cross-board concept practice · originally a CIE 9708 question, used here because the concept is the same. It is not IB Economics past-paper material.
Question 3
A firm is operating in perfect competition. What will be the effect on the firm’s revenue if it increases its output by 5%?
Answer: B.
What the syllabus asks for on this topicSyllabus points
Syllabus points
- Explain how equilibrium price and quantity are determined.
- Calculate equilibrium from demand and supply functions.
- Explain how markets clear shortages and surpluses through the price mechanism.
- Analyse the effects of demand and supply shifts on equilibrium.
- Explain allocative efficiency, consumer and producer surplus, and the role of the price mechanism.
Related IB Economics topics
Not the topic you were looking for? Describe what you are stuck on in your own words and we will take you to the notes that answer it.